6.12 Three Methods
Three methods are 5-day patterns. There are relatively rare but it can be informative if found.
6.12.1 Rising Three
Bullish signal:
- Large bullish candle on day 1
- (small) bearish candles for next 3 days
- Large bullish candle on day 5
- Day 1 low is lowest
- Day 5 high is highest
Here is an exmample:
price <- MSFT['2012-01-10/2012-01-22']
candleChart(price, theme='white')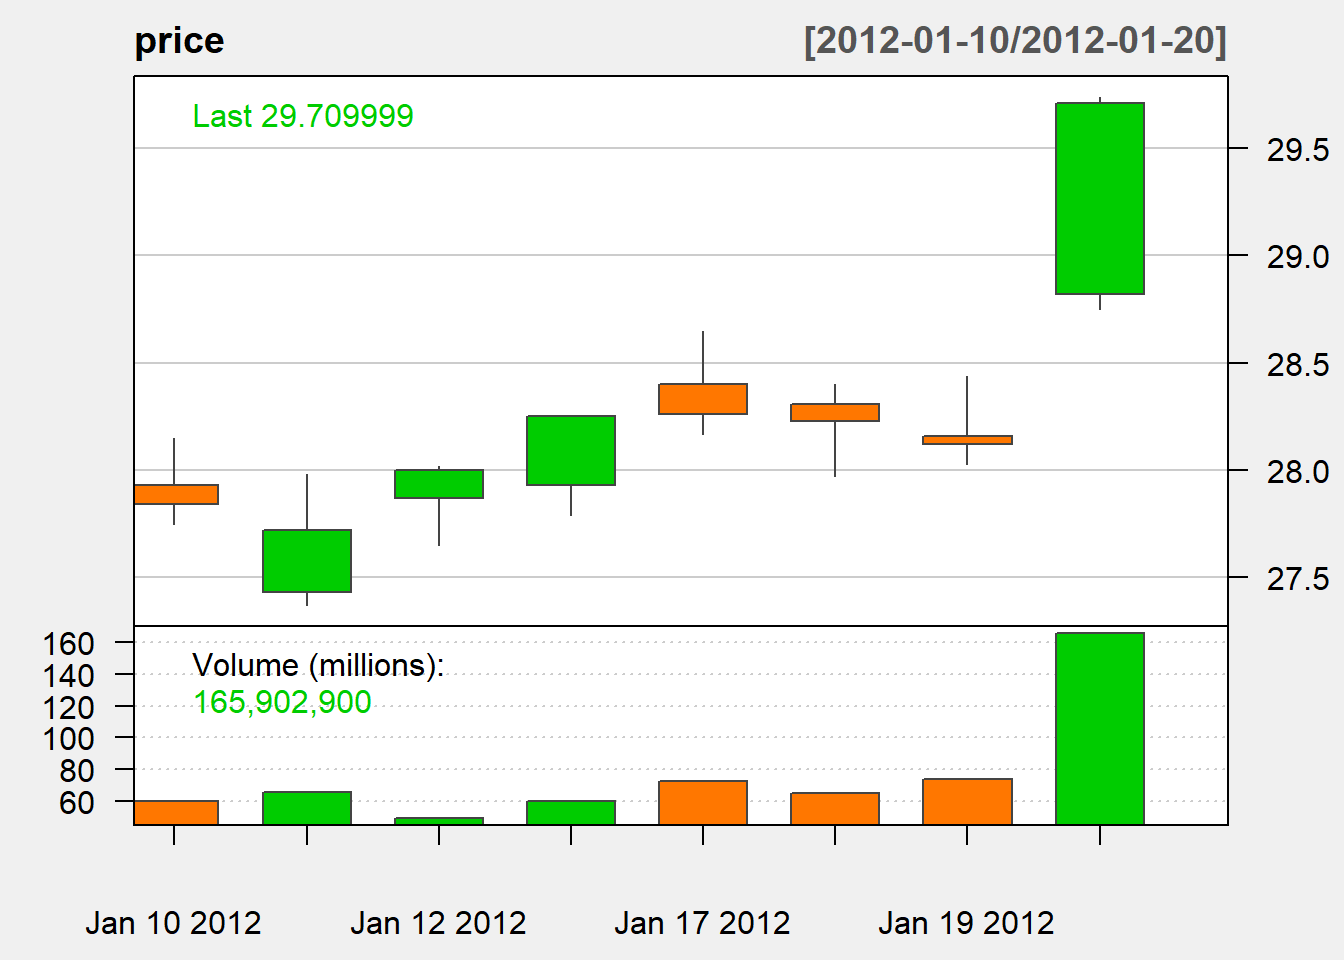
6.12.2 Falling three
Bearish signal:
- Large bearish candle on day 1
- (small) bullish candles for next 3 days
- Large bearish candle on day 5
- Day 1 high is the highest
- Day 5 low is the lowest