5.2 Simple Moving Average (SMA)
A n-day simple moving avaerage (n-day SMA) is arithmetic average of prices of past n days:
\[ SMA_t(n) = \frac{P_t+\ldots+P_{t-n+1}}{n}\]
The following is an SMA function:
mySMA <- function (price,n){
  sma <- c()
  sma[1:(n-1)] <- NA
  for (i in n:length(price)){
    sma[i]<-mean(price[(i-n+1):i])
  }
  sma <- reclass(sma,price)
  return(sma)
}
Let us apply our function:
mysma <-mySMA(Cl(AAPL),n=20)
tail(mysma,n=3)
## [,1]
## 2012-12-26 77.44186
## 2012-12-27 76.95700
## 2012-12-28 76.387215.2.1 TTR
In the TTR package, we can use SMA():
sma <-SMA(Cl(AAPL),n=20)
tail(sma,n=3)
## SMA
## 2012-12-26 77.44186
## 2012-12-27 76.95700
## 2012-12-28 76.38721We can see that our code gives the same result.
5.2.2 Trading signal
Buy signal arises when a short-run SMA crosses from below to above a long-run SMA.
Sell signal arrises when a short-run SMA crosses from above to above a long-run SMA.
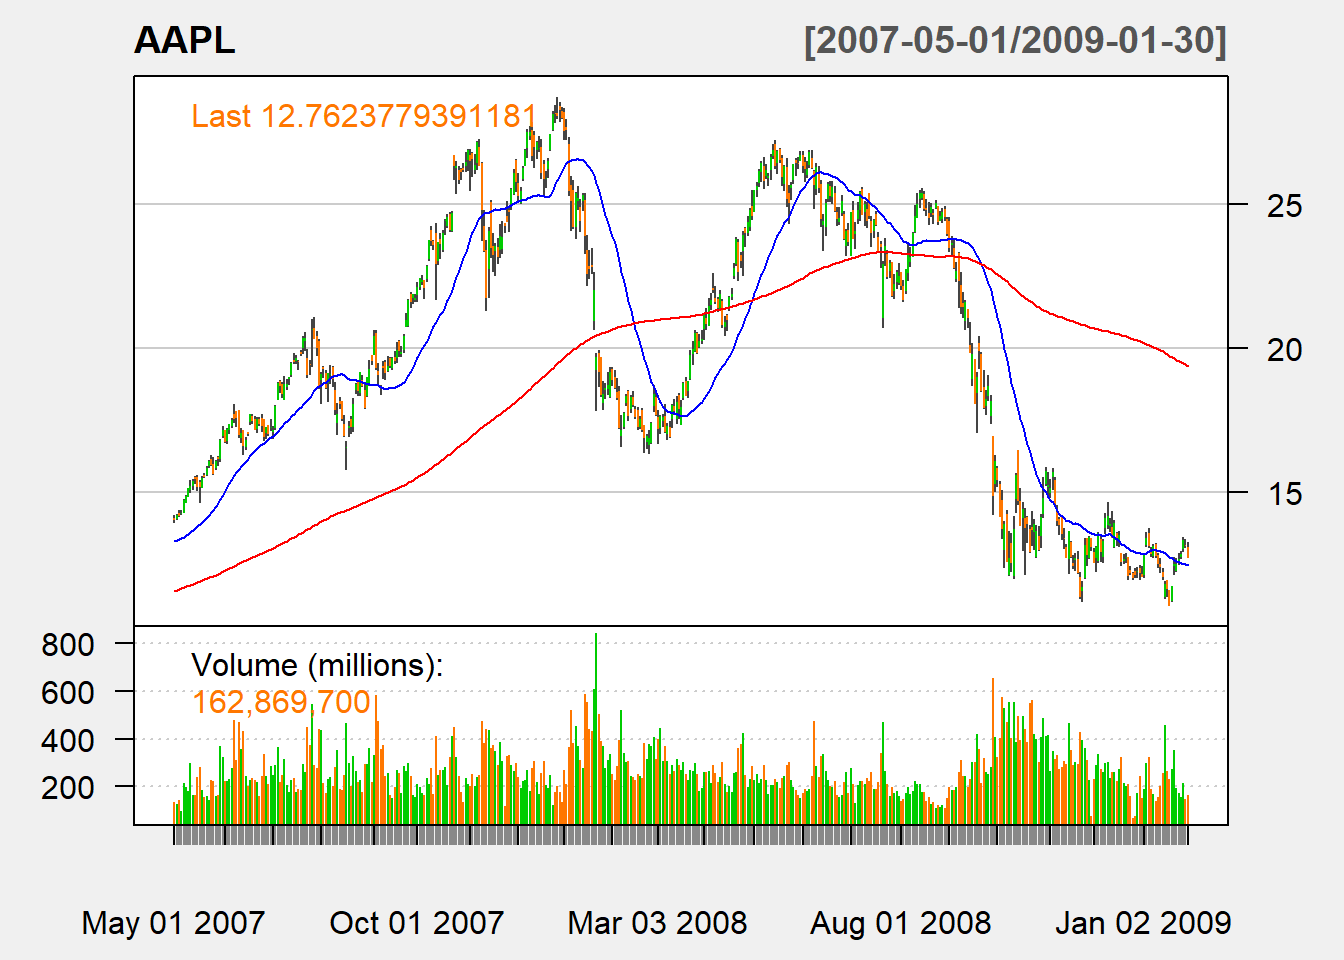
5.2.3 Charting
We use the function addSMA() to put
chartSeries(AAPL,
            subset='2007-05::2009-01',
            theme=chartTheme('white')
            )
addSMA(n=30,on=1,col = "blue")
addSMA(n=200,on=1,col = "red")