5.12 Custom indicators
The following code shows filter below the price chart:
Filter <- function(price){
  r <- price/lag(price,1)
  return(r)
}
filter <- Filter(Cl(AAPL))
chartSeries(AAPL,
            subset='2007-05::2009-01',
            theme=chartTheme('white'))
addTA(filter, col="red")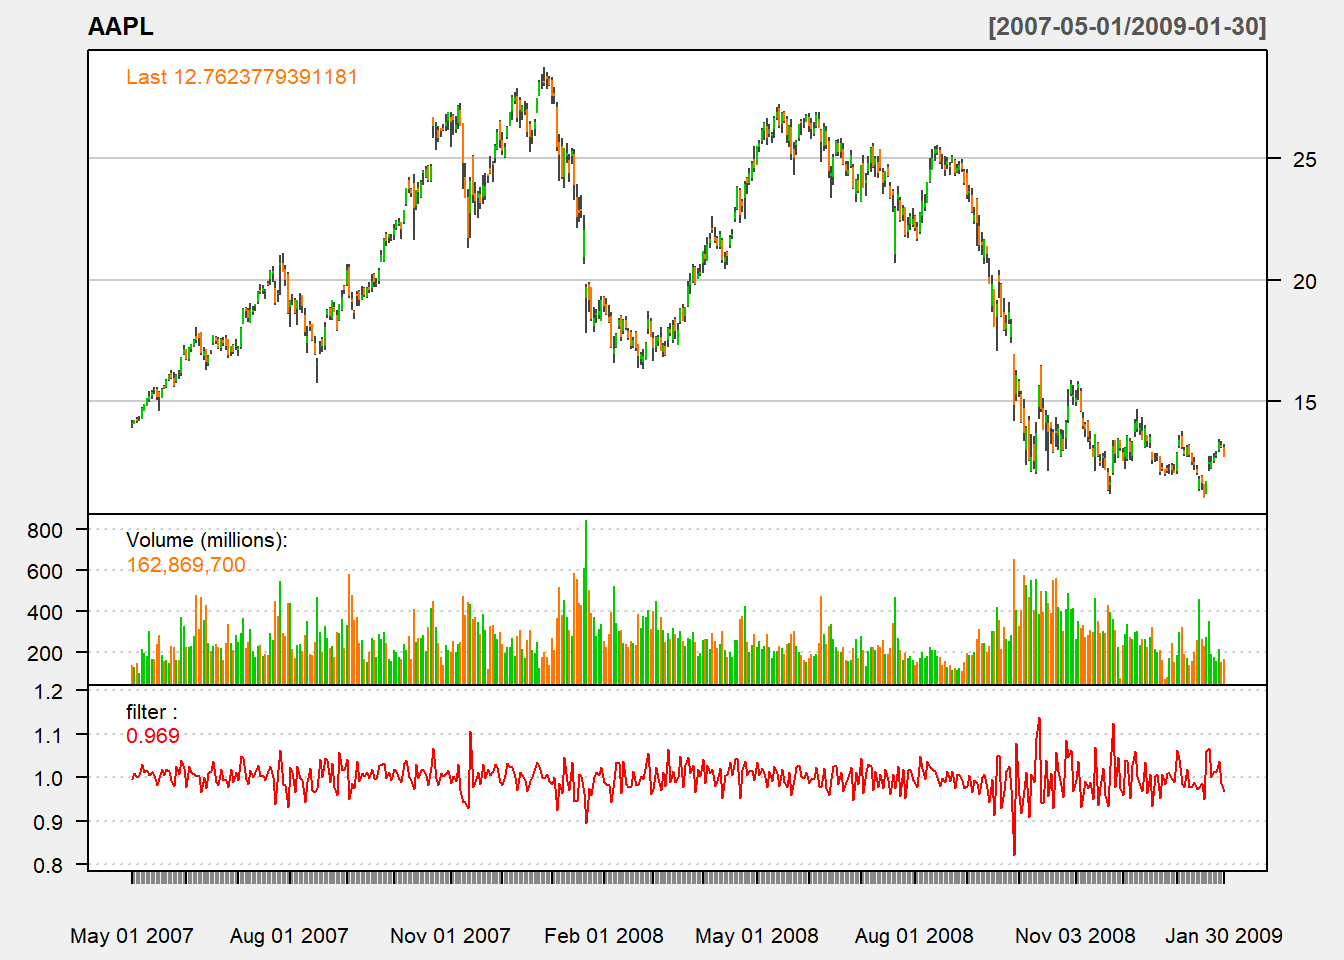
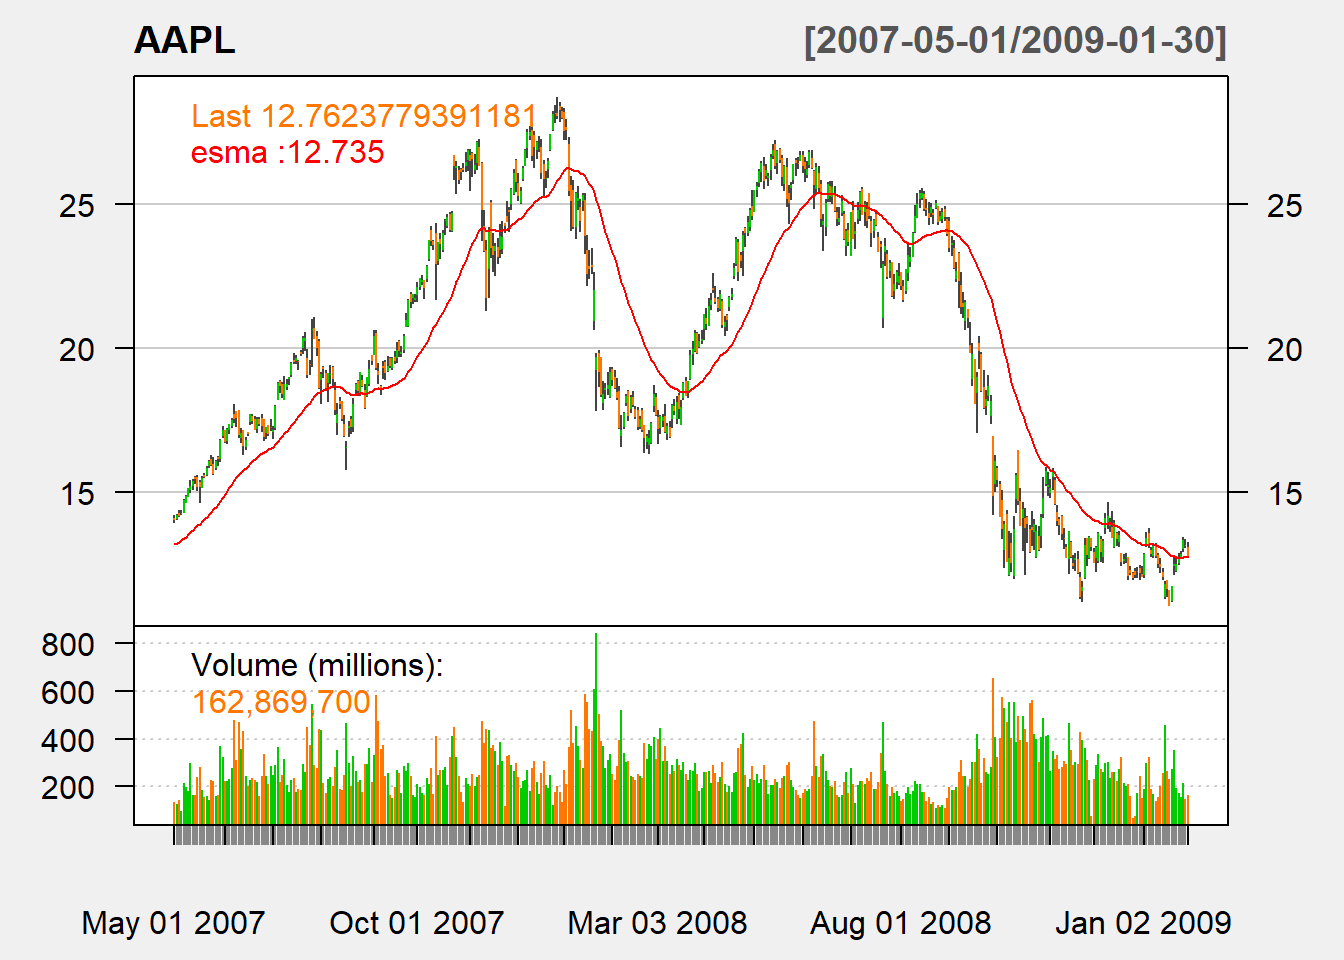
To show it on the price chart, we use the option on=1. Here, I am using a completely makeup indicatior that is average ot 30-day SMA and 40-day EMA.
esma <- 0.3*SMA(Cl(AAPL),30) + 0.7*EMA(Cl(AAPL),40)
chartSeries(AAPL,
            subset='2007-05::2009-01',
            theme=chartTheme('white'))
addTA(esma, on=1, col="red")