9.6 SMA rule with volatility filter
We will consider the following rule:
- Buy every day when
- SMA30 SMA200 and
- standard deviation of close prices is less than its median over the last 50 days.
- Sell everything when
- SMA30 SMA200
The idea is that buy signal appears only when the price goes up with low volatility.
9.6.1 Step 1: Initialization
We first download data
from ="2009-01-01"
to ="2012-12-31"
symbols = c("IBM")
currency("USD")
getSymbols(symbols, from=from, to=to, adjust=TRUE)
stock(symbols, currency="USD", multiplier=1)
initEq=10^6
We first initialize the setup.
.blotter <-new.env()
.strategy <-new.env()
strategy.st <- "SMAv"
portfolio.st <- "SMAv"
account.st <- "SMAv"
rm.strat("SMAv")

initPortf(portfolio.st, symbols=symbols,
          initDate=initDate, currency='USD')
initAcct(account.st, portfolios=portfolio.st,
         initDate=initDate, currency='USD',
         initEq=initEq)
initOrders(portfolio.st, initDate=initDate)
strategy(strategy.st, store=TRUE)
9.6.2 Step 2: Indicator
Besides SMA, we will need a new indicator to give buy signal. Since it is combination of SMA and volatility, we need to construct our own indicator, RB:
RB <- function(x,n,s,l){
  sd <- runSD(x, n, sample= FALSE)
  med <- runMedian(sd,n)
  mavg <- SMA(x,n)
  savg <- SMA(x,s)
  lavg <- SMA(x,l)
  signal <- ifelse(savg > lavg & sd < med,1,0)
  colnames(signal) <- "RB"
  reclass(signal,x)
  }
Now we are ready to define our indicators:
add.indicator(
  strategy.st, name="RB",
  arguments=list(x=quote(Cl(mktdata)),
                 n=200, s=30, l=200),
  label="RB")

add.indicator(
  strategy.st, name="SMA",
  arguments=list(x=quote(Cl(mktdata)), n=30),
  label="sma30")

add.indicator(
  strategy.st, name="SMA",
  arguments=list(x=quote(Cl(mktdata)), n=200),
  label="sma200")
9.6.3 Step 3: Signals
Now we add two signals: Buy signal appears when RB is greater than or equal to 1. Sell signals appears when SMA30 is less than SMA200.
Hence, this is different from simple trading rule. Here, we are going to do signal comparison. There are two price lists: sma200 and sma30. Then the relationship is greater than for buy and less than for less.
# Buy signal if RB>=1
add.signal(strategy.st,
           name="sigThreshold",
           arguments = list(threshold=1, column="RB",
                            relationship="gte",
                            cross=TRUE),
           label="buy")

# Sell signal if SMA30<SMA200
add.signal(strategy.st,
           name="sigComparison",
           arguments=list(columns=c("sma30","sma200"),
                          relationship="lt"),
           label="sell")
9.6.4 Step 4: Rules
We now consider buy and sell rules using market order. Note that this is the same as the case for simple SMA rule.
# Buy Rule
add.rule(strategy.st,
         name='ruleSignal',
         arguments = list(sigcol="buy",
                          sigval=TRUE,
                          orderqty=1000,
                          ordertype='market',
                          orderside='long',
                          pricemethod='market',
                          replace=FALSE),
         type='enter',
         path.dep=TRUE)

# Sell Rule
add.rule(strategy.st,
         name='ruleSignal',
         arguments = list(sigcol="sell",
                          sigval=TRUE,
                          orderqty='all',
                          ordertype='market',
                          orderside='long',
                          pricemethod='market',
                          replace=FALSE),
         type='exit',
         path.dep=TRUE)
9.6.5 Step 5: Evaluation
We first try to apply the trading rule.
out<-try(applyStrategy(strategy.st,
              portfolios=portfolio.st))
## [1] "2011-07-14 08:00:00 IBM 1000 @ 169.919478248927"
## [1] "2011-08-08 08:00:00 IBM 1000 @ 162.813574456635"
## [1] "2012-07-06 08:00:00 IBM 1000 @ 189.765720727769"
## [1] "2012-07-26 08:00:00 IBM -3000 @ 192.283894241252"
## [1] "2012-08-14 08:00:00 IBM 1000 @ 197.425962200791"
## [1] "2012-11-19 08:00:00 IBM -1000 @ 190.350006"Then we can update the accounts.
updatePortf(portfolio.st)
updateAcct(portfolio.st)
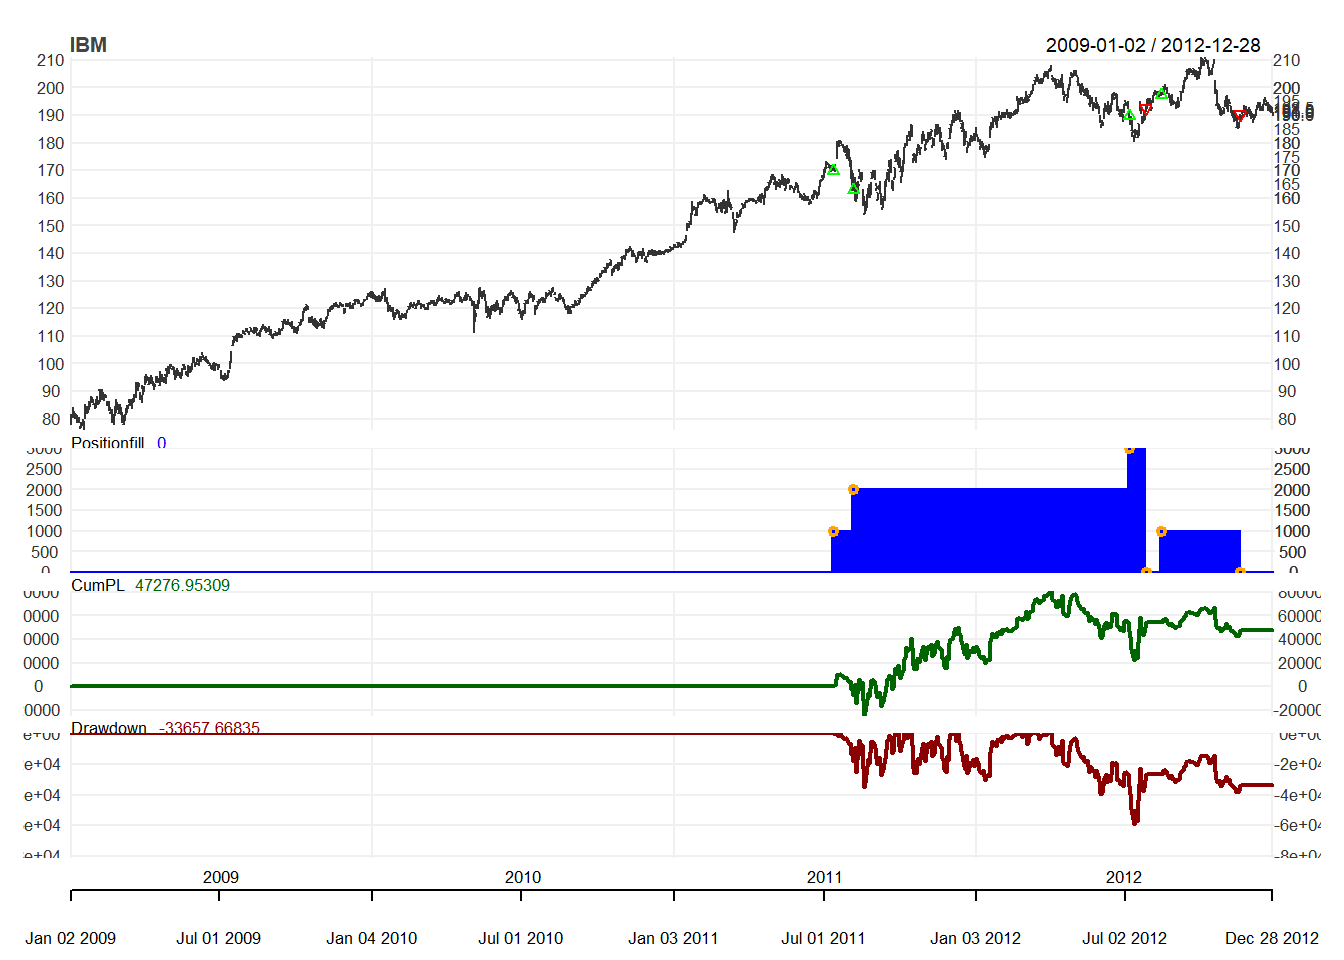
updateEndEq(account.st)We can also plot the trading positions.
chart.Posn(Portfolio=portfolio.st,
           Symbol="IBM",
           log=TRUE)