6.11 Star
Star is a 3-day pattern. The day 2 features doji while day 1 and day 3 features a large candle.
6.11.1 Morning star
Bullish signal:
- Large bearish candle on day 1
- Small candle (or doji) on day 2
- Large bullish candle on day 3
- Gap down between day 1 and day 2
- Gap up between day 2 and day 3
Here is an exmample:
price <- MSFT['2013-06-09/2013-06-18']
candleChart(price, theme='white')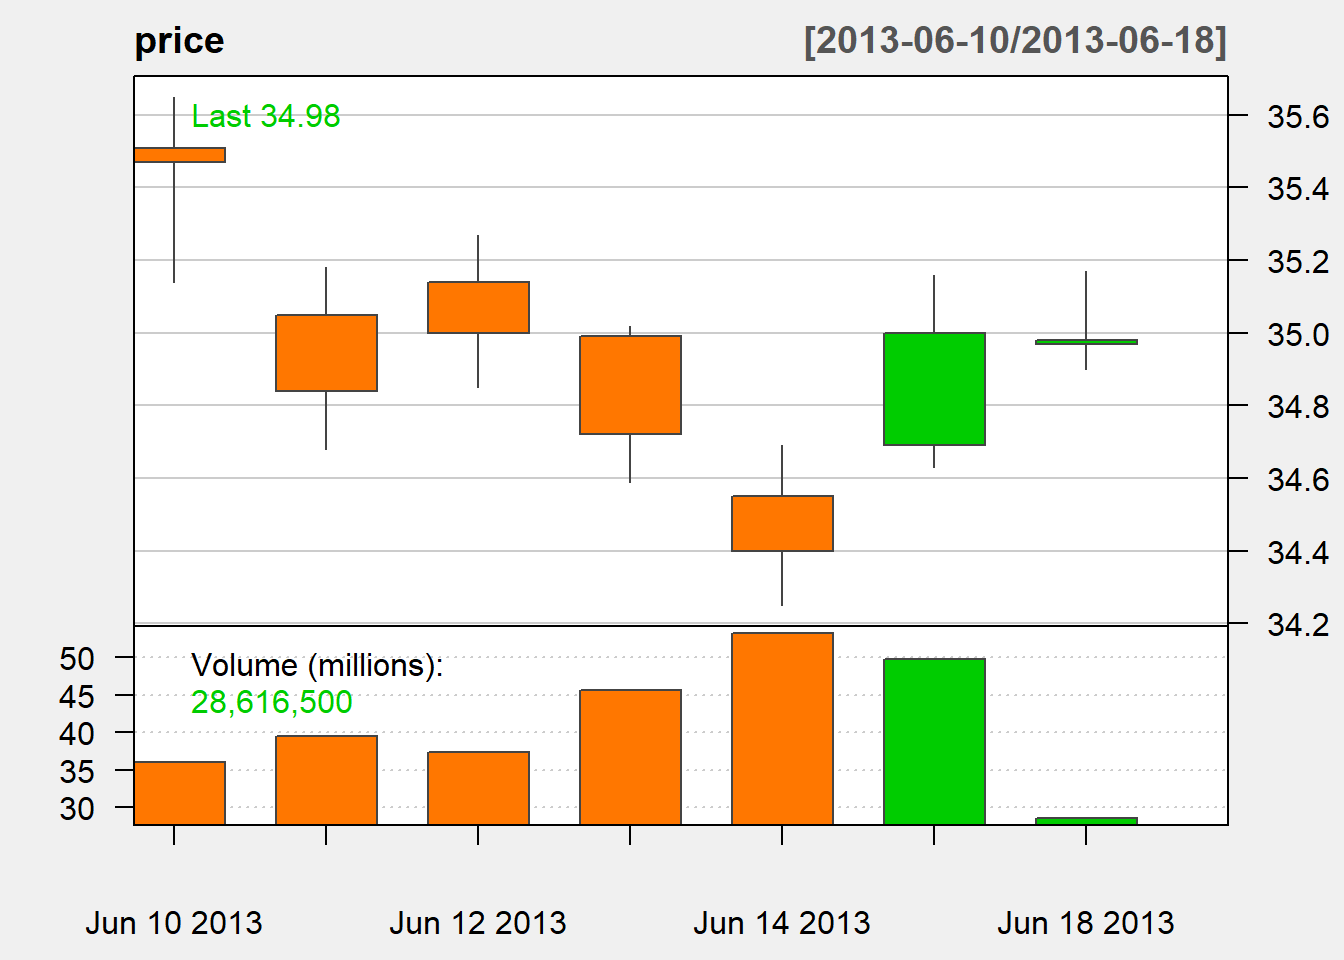
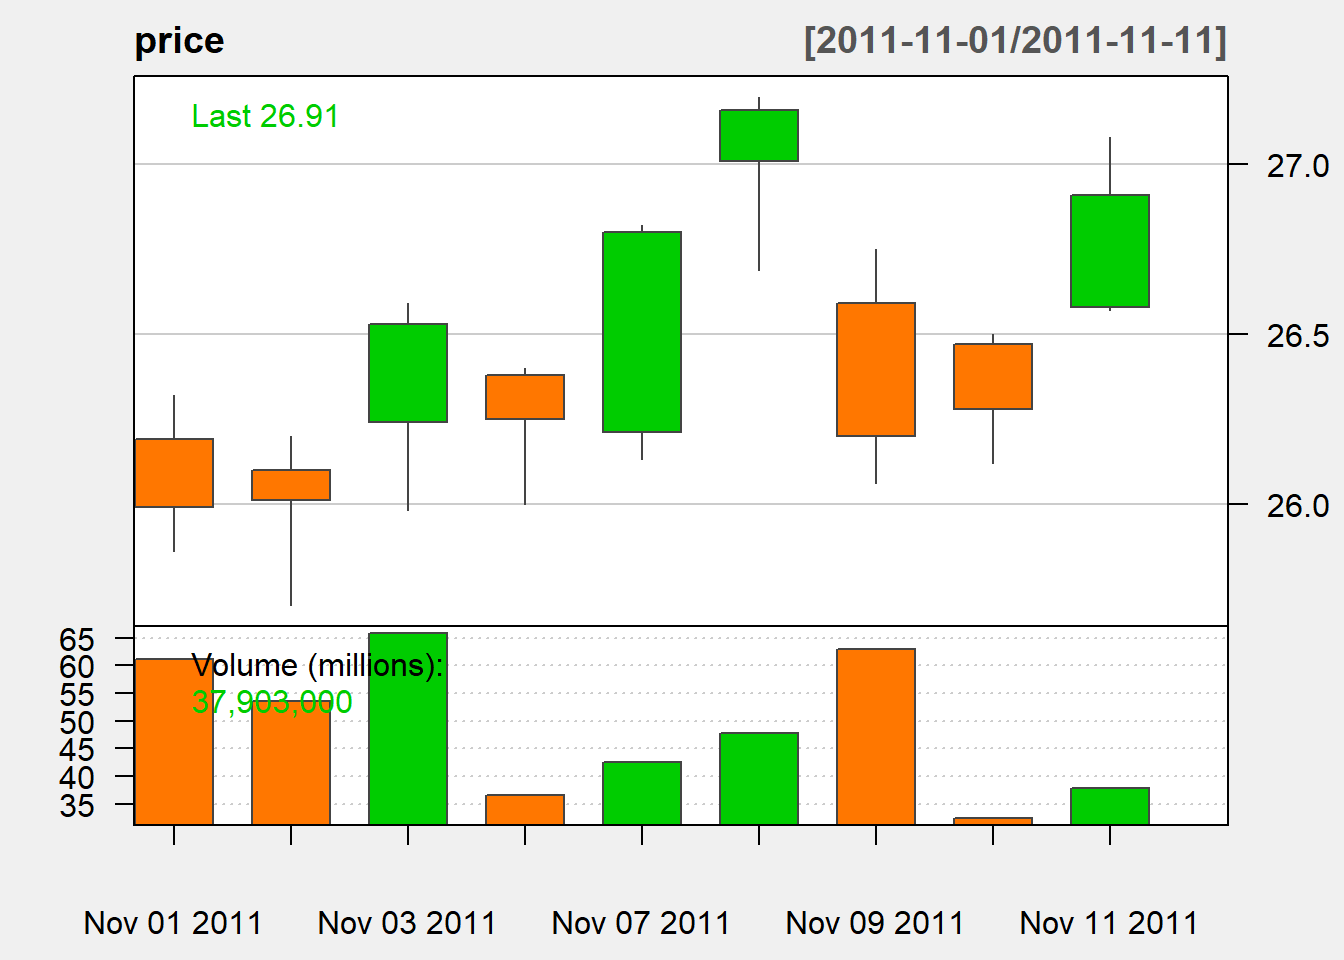
6.11.2 Evening Star
Bearish Signal:
- Large bullish candle on day 1
- Small candle (or doji) on day 2
- Large bearish candle on day 3
- Gap up between day 1 and day 2
- Gap down between day 2 and day 3
Here is an exmample:
price <- MSFT['2011-11-01/2011-11-11']
candleChart(price, theme='white')