6.4 Hammers
Hammer is a 1-day pattern. It is similar to dragonfly and gravestone doji but the real body is not too short. Its interpretation depends on it is bullish or bearish market. Hencer, there are four types of hammers (bearish or bullish market and dragronfly style or gravestone style)
6.4.1 Hammer and Hang Man
It is a dragonfly-style hammer.
- Short upper shadow
- Long lower shadow
It is a reversal signal:
- Hammer: Bullish signal in a downward trend
- Hang Man: Bearish signal in a upward trend
Here is an exmample:
price <- MSFT['2011-10-18/2011-10-25']
candleChart(price, theme='white')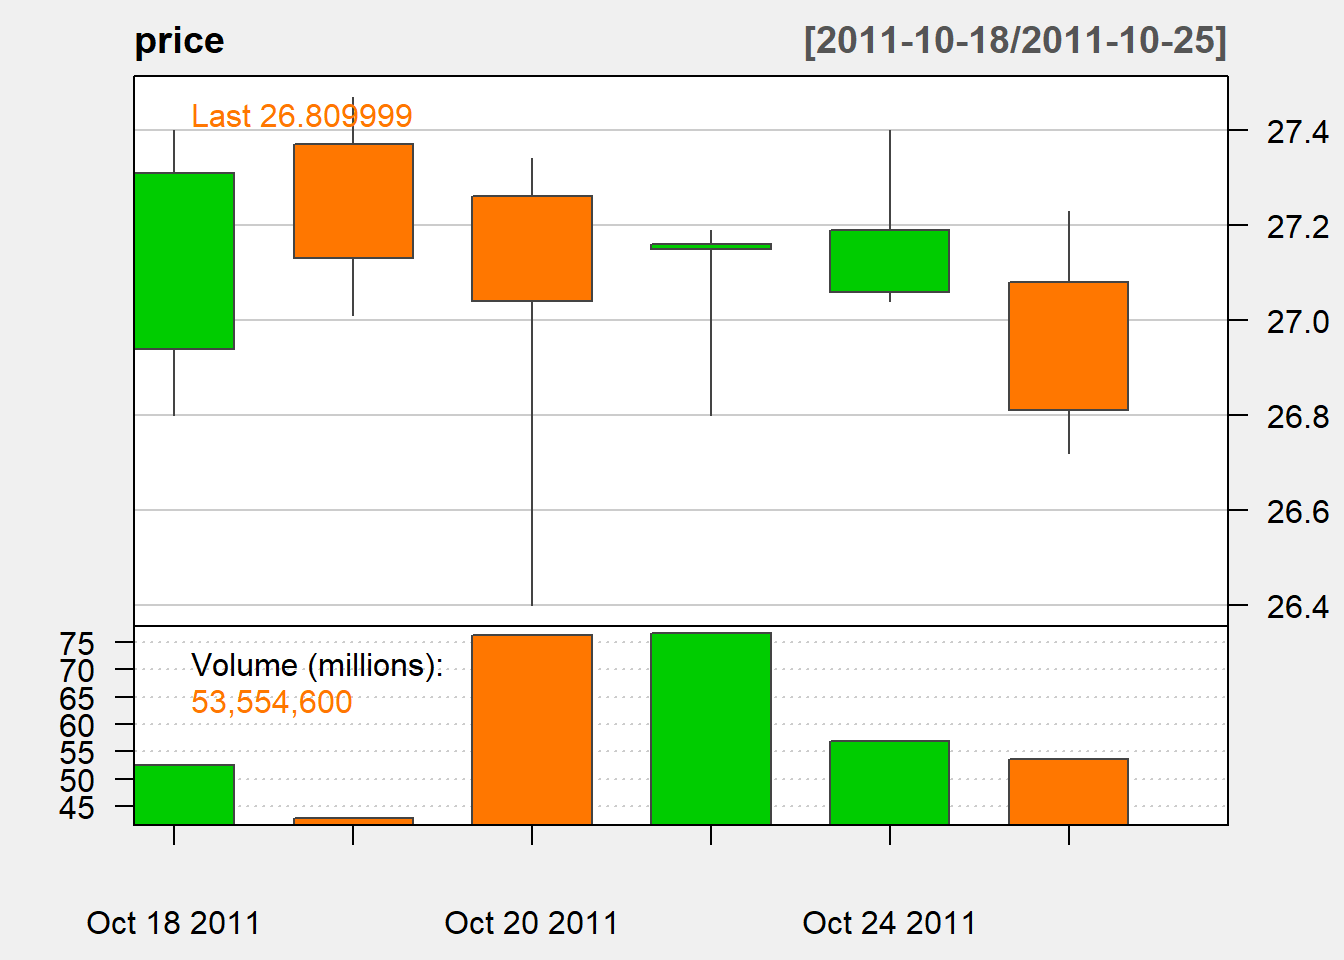
We can identify the pattern through the following code:
delta1 <- 0.1
delta2 <- 0.7
hammer <-c()
for (i in 1:N){
  if (delta1*WC[i]>US[i] && delta2*WC[i]<LS[i]){
    hammer[i] <- 1
  } else{
    hammer[i] <- 0
  }
}
hammer <- reclass(hammer,Cl(MSFT))
Let us check if our code does the job:
hammer['2011-10-18/2011-10-25']## [,1]
## 2011-10-18 0
## 2011-10-19 0
## 2011-10-20 0
## 2011-10-21 1
## 2011-10-24 0
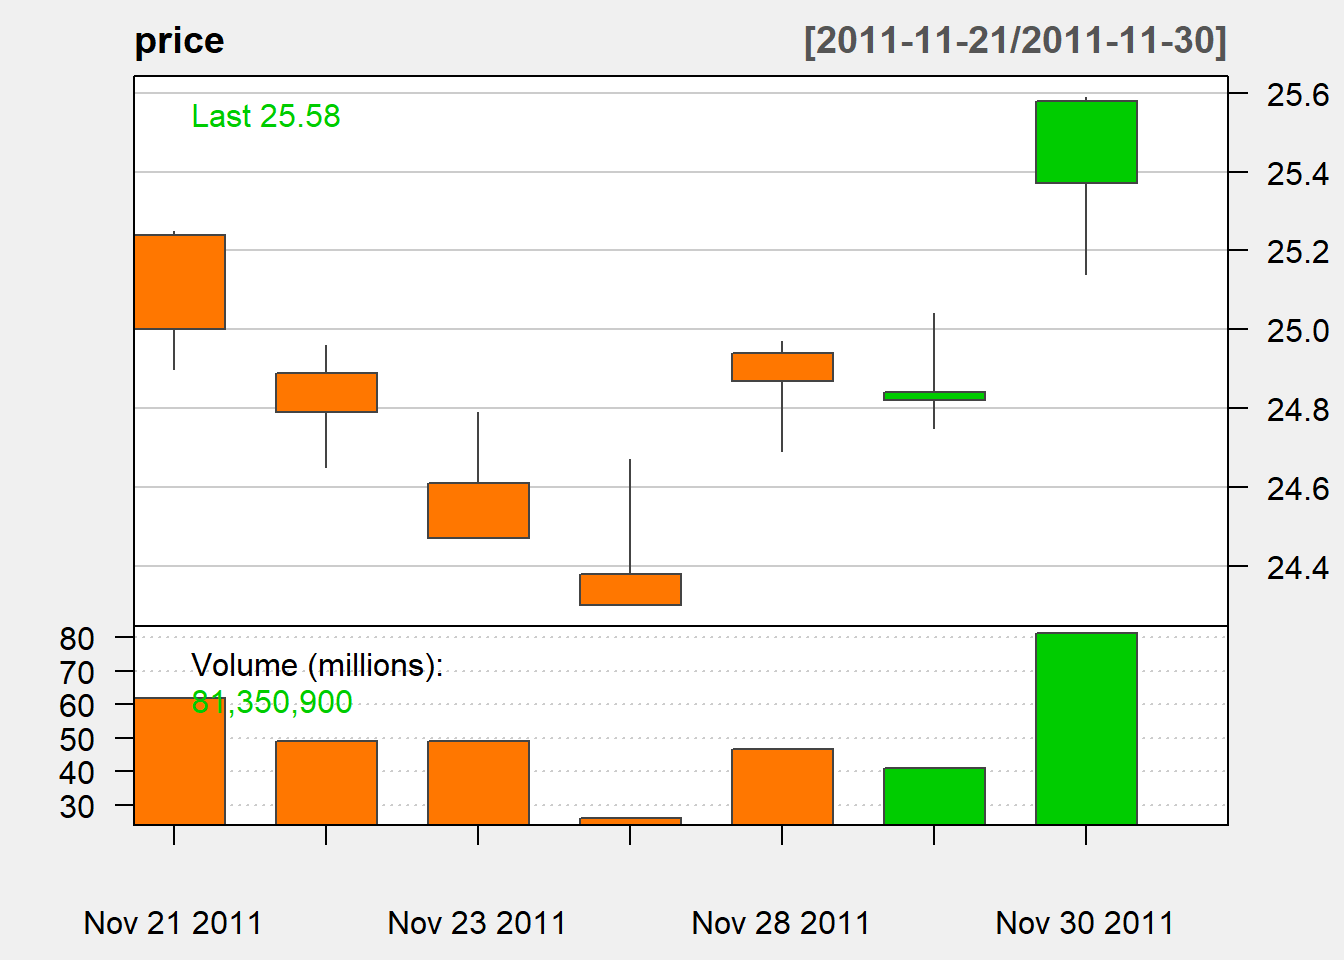
## 2011-10-25 06.4.2 Inverted Harmer and Shooting Stars
It is a gravestone-style hammer:
- Long upper shadow
- Short lower shadow
Reversal signal:
- Inverted Harmer: Bullish signal in a downward trend
- Shooting Stars: Bearish signal in a upward trend
Here is an exmample:
price <- MSFT['2011-11-20/2011-11-30']
candleChart(price, theme='white')