7.7 Combining two indicators: EMA and RSI
Test the following strategy using EMA and RSI based on day trading:
Buy signal based on EMA rule.
Sell signal based on RSI rule.
Tie-breaking: buy-signal has priority
We use 14-day RSI and use 70 as threshold for selling.
We will use MSFT to illustrate. We use the closing price and calculate the daily return.
price <- Cl(MSFT)
returnMSFT <- (Cl(MSFT) - Op(MSFT))/Op(MSFT)
Then we calculate the indicator for filter rule and rsi.
delta<-0.005
r <- price/Lag(price) - 1
n <- 14
rsi <- RSI(price, n)
We calculate the signal based on the trading rule. Note that the trading rule cannot be started until all information is ready. Hence, the first n day have signal value of zero.
signal <-c()
signal[1:n] <-0
for (i in (n+1):length(price)){
    if (r[i] > delta){
         signal[i]<- 1
    } else if (rsi[i] > 70){
         signal[i]<- -1
    } else
         signal[i]<- 0
}
signal<-reclass(signal,price)
Finally, we evaluate trading rule based on day trading.
EMA.RSI.trade <- Lag(signal)
EMA.RSI.ret<- returnMSFT*EMA.RSI.trade
names(EMA.RSI.ret) <- 'Combined'
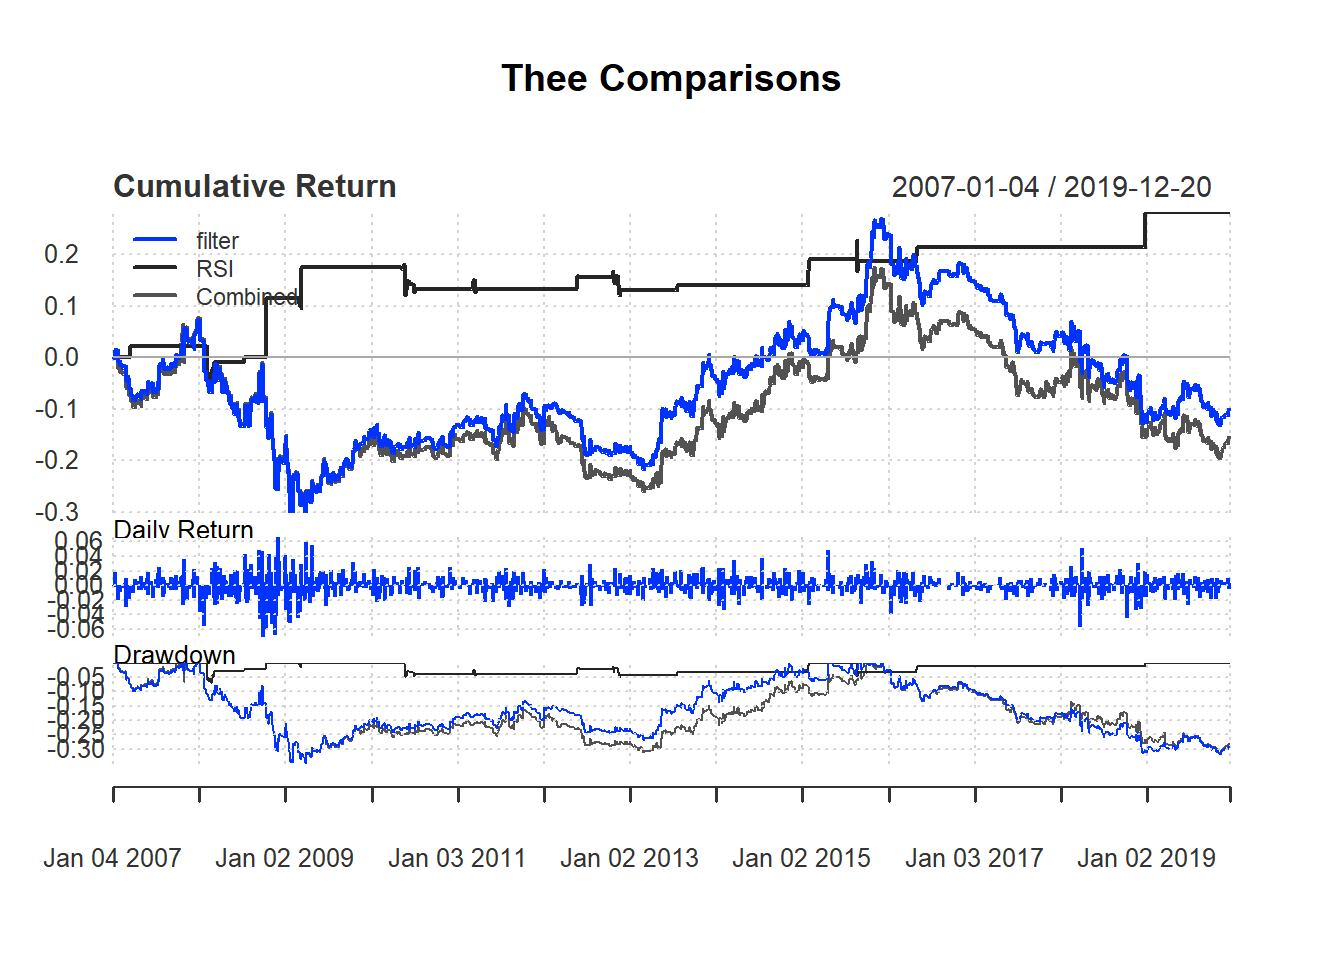
retall <- cbind(filter.ret, RSI.ret, EMA.RSI.ret)To draw trade performance summary with different colors, we use the option colorset. Common options includes redfocus, bluefocus, greenfocus, rainbow4equal andrich12equal.
charts.PerformanceSummary(retall,
                          main="Thee Comparisons",
                          colorset=bluefocus)