3.4 Food and Agricultural Systems
3.4.1 Human waste

Figure 3.11: Artwork on Sustainable Gardening
It is no secret that recycling animal and human waste is the key to sustainable farming.
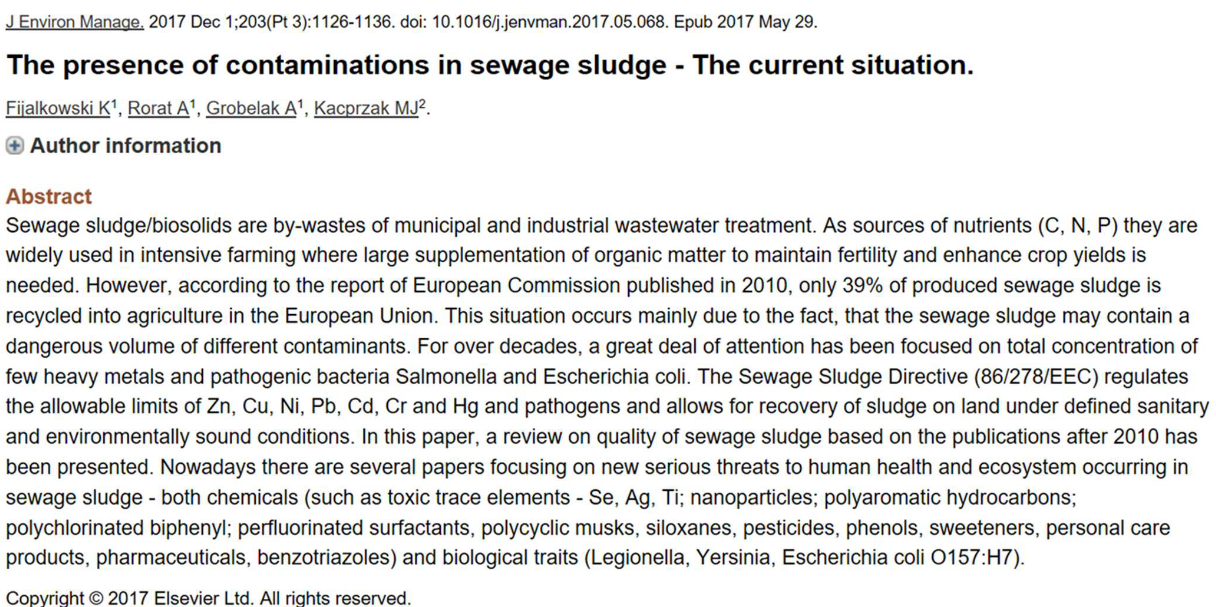
Figure 3.12: Research Abstract on the Safety of Sewage Sludge
Research has also been conducted on the safety of using human waste as fertilizers (i.e., what is inside human fecal content).
3.4.2 Seafood
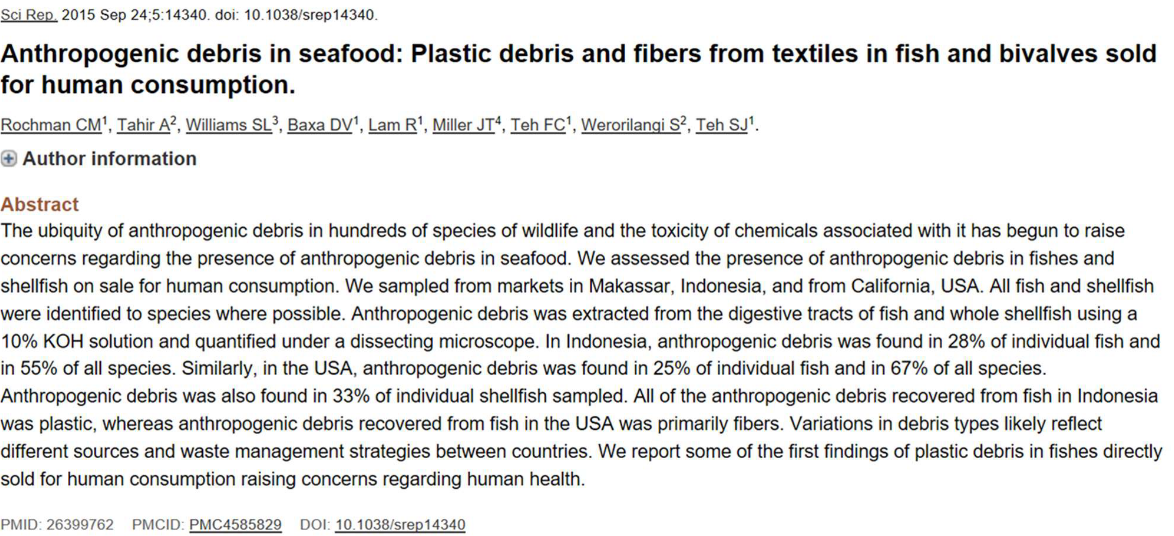
Figure 3.13: Research Abstract on Environmental Pollutants in Seafood
Not only has research been conducted on the pollutants that surround seafood, but a possible diagram has also been created to show the flow of plastics in the environment:
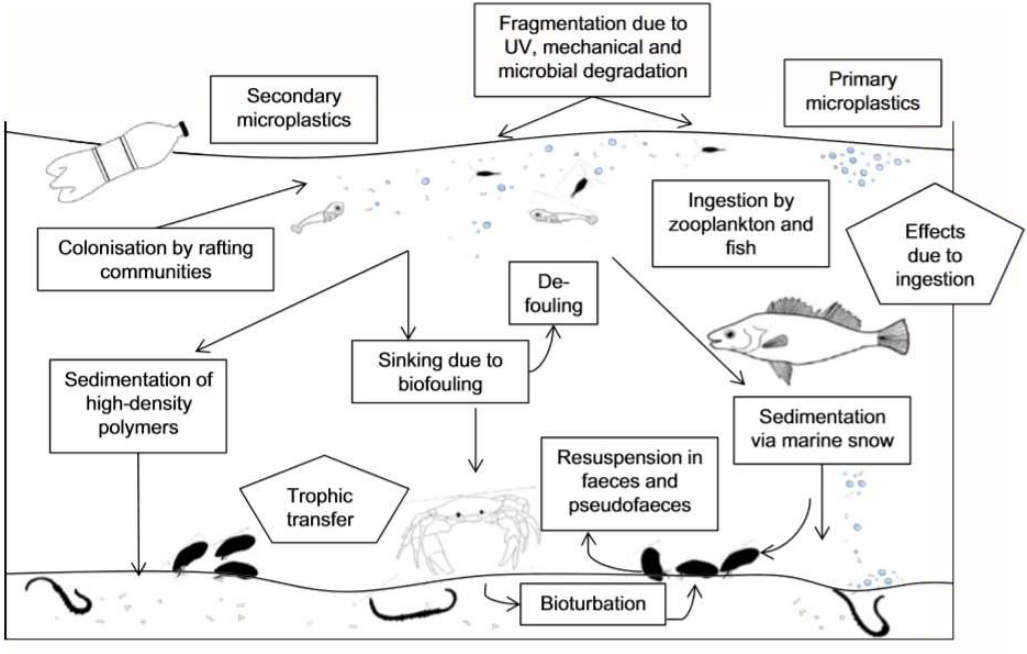
Figure 3.14: Possible Flow of Plastics in the Marine Environment
3.4.3 Antibiotic resistance
Research on antibiotic research have been conducted in the context of farming.
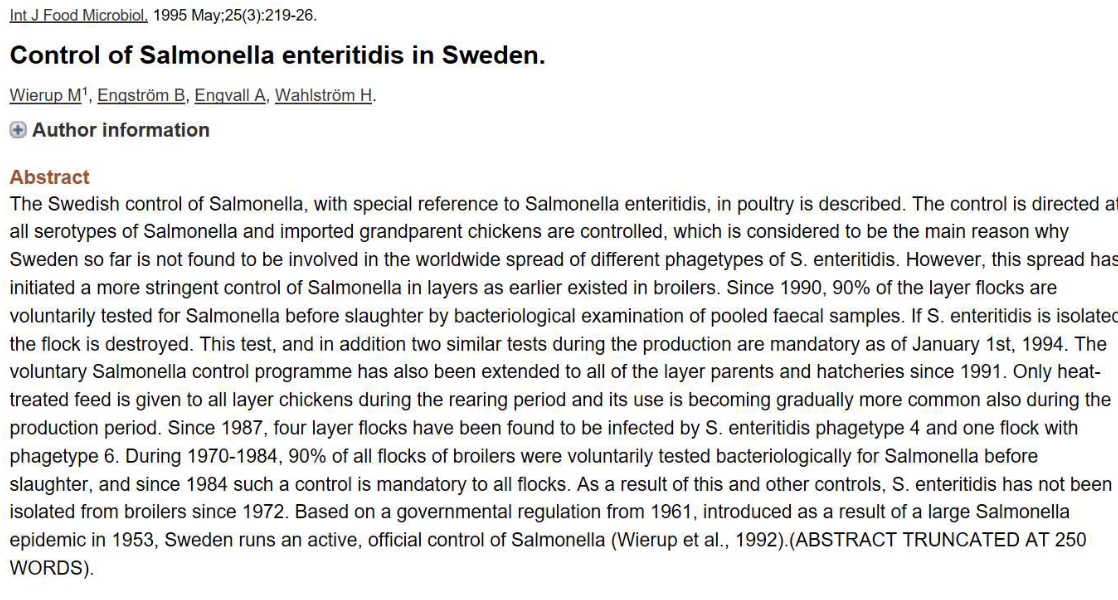
Figure 3.15: Salmonella-Free Chicken?
Interestingly, research has been conducted on whether it is possible to create Salmonella-free chicken.
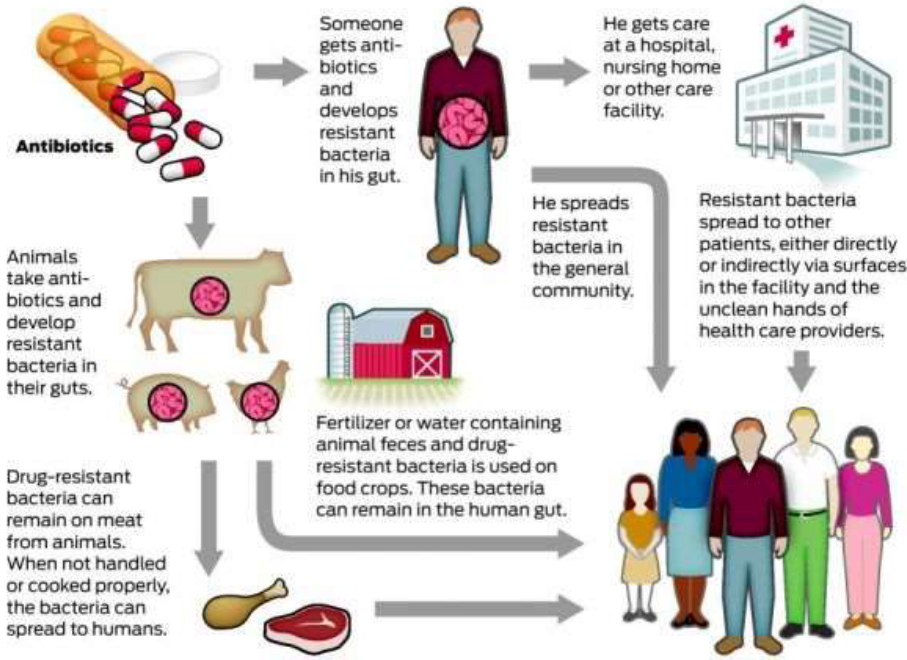
Figure 3.16: Antibiotic Resistance in Foods
Also observe the above graphic.
3.4.3.1 Food-borne illnesses
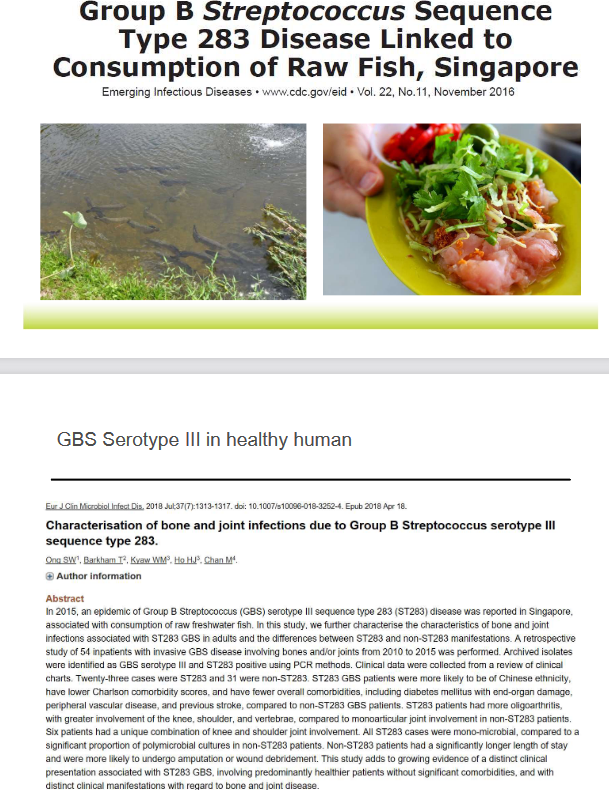
Figure 3.17: Food-Borne Illnesses in Singapore
As seen above, Singapore has its fair share of food-borne illnesses 1.
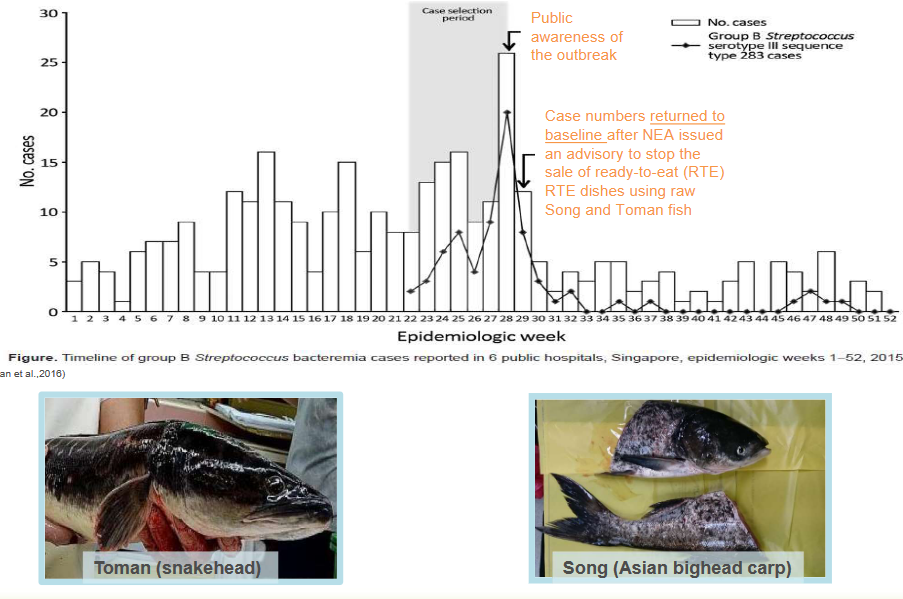
Figure 3.18: Statistics on the 2015 Group B Streptococcus Outbreak in Singapore
As seen above, cases reached a new high before the NEA issued an advisory to stop the preparation of ready-to-eat dishes that contained song and toman fishes.
3.4.3.1.1 Data and paradigm shifts from the understanding of GBS transmissions
This shift can be divided into components:
Conventional Knowledge on the GBS outbreak
A known fish and a known pathogen caused the outbreak; the pathogen then caused disease within the vulnerable. The pathogen is also a part of a human’s commensal gastrointestinal flora - so much so that about 30% of an adult’s microflora has GBS.
Observations during the GBS outbreak
GBS had an unusual route of transmission; in rare cases, the bacterium caused patients to develop septic arthritis, bacteraemia, or even meningoencephalitis!
Furthermore, there was also direct evidence of GBS transmission to humans via genomic analyses.
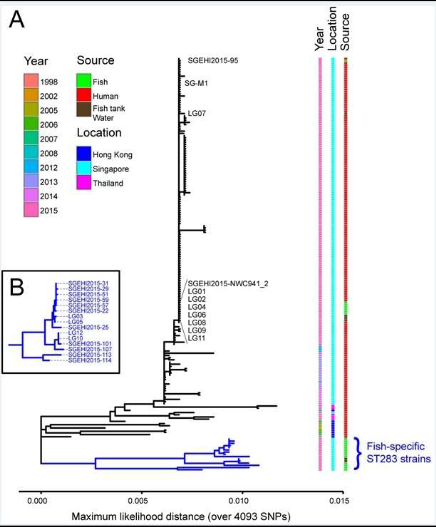
Figure 3.19: Genomic Analyses of ST283
An investigation in the quality of fish sold in the Singaporean market yielded the following results:
- ST283 (i.e., Sequence Type 283) was found in freshwater fish and fish tank water (collected from the ports).
- The presence of ST283 in other countries (e.g., Hong Kong and Thailand) suggested that ST283 was prevalent in the region.
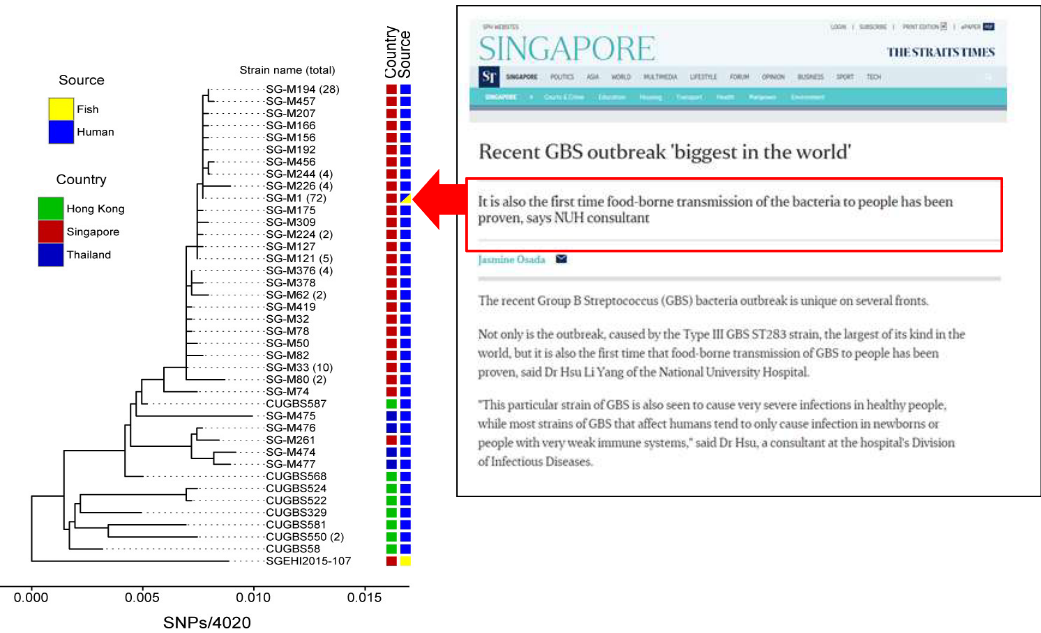
Figure 3.20: Similar Genomes Found Between ST283 Sequences in Fish Samples and Clinical Isolates
Furthermore, the results of the genomic analyses also showed that the genomes between that of ST283 samples in fish and clinical isolates shared a striking similarity.
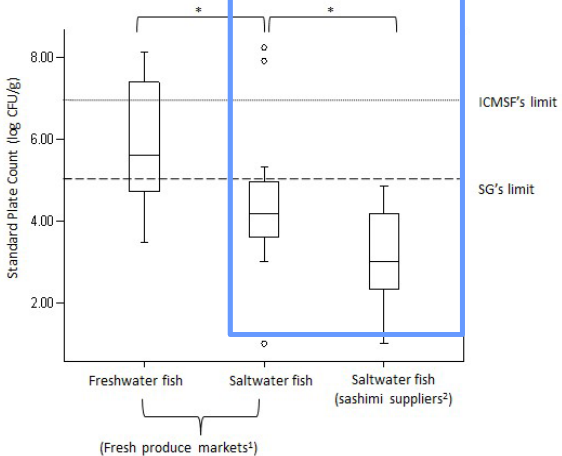
Figure 3.21: Standard Plate Count of Fish Samples From Fresh Proudce Markets
Like the above boxplot suggests, freshwater fish had a higher standard plate count than saltwater fish. Yet, a significantly lower standard plate count was observed in fish from sashimi suppliers among all three fishes.
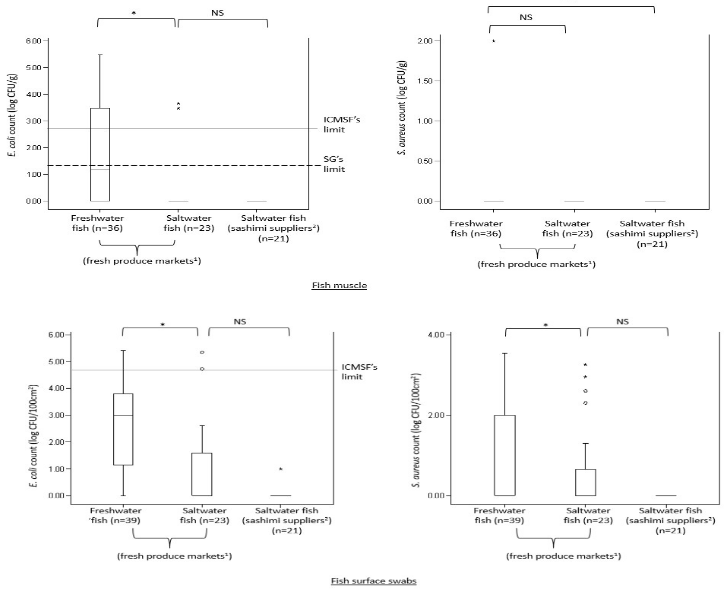
Figure 3.22: Comparison of E. coli and S. aureus Levels in Freshwater and Saltwater Fish
The above graphs also suggest that freshwater fish had significantly higher levels of E. coli and S. aureus compared to their saltwater counterparts.
It was possible that there was cross contamination of saltwater fish in the marketplace or the port.
3.4.3.1.2 Changes in policy following research and data
First, there was a ban on the use of freshwater fish in ready-to-eat dishes. Until food stalls and restaurants were able to comply with the latter, they were not allowed to sell ready-to-eat dishes that has raw fish in them. Furthermore, only saltwater fish from the AVA’s list of approved suppliers could be used!
It is also worth noting that most fish sold in Singapore’s markets and fishery ports are meant for cooking. Hence, saltwater fish meant for raw consumption (e.g., salmon sashimi) should be separately handled from freshwater fish using strict hygiene and cold chain practices.
3.4.3.2 Impact of weather on food-borne illnesses
3.4.3.2.1 GBS ST283
The first detection of GBS in fish was in a golden pomfret - GBS resulted in high mortalities for the fish species. This was reported by farmers one to two days after weather events.
Other species (e.g., Asian seabass, red snapper, etc.) were not affected; however, research did realize that higher temperatures enabled quicker replication and pathogen transmission. Furthermore, higher temperatures and stocking densities lead to lowered immunity in fishes.
In a similar retrospective study on GBS ST283 cases in Hong Kong, scientists realized that cases peaked during the summer months - clinical cases there were same to those described by ST283 patients in Singapore.
3.4.3.2.2 Vibriosis
The Vibrios’ growth patterns are influenced by temperature and salinity. It is also concerning that human vibrio sickness are growing worldwide - there has been a 41% increase in average annual infections between 1996 and 2005 in the US. Furthermore, vibrio infections are being reported in areas with no previous vibrio presence (e.g., Europe)!
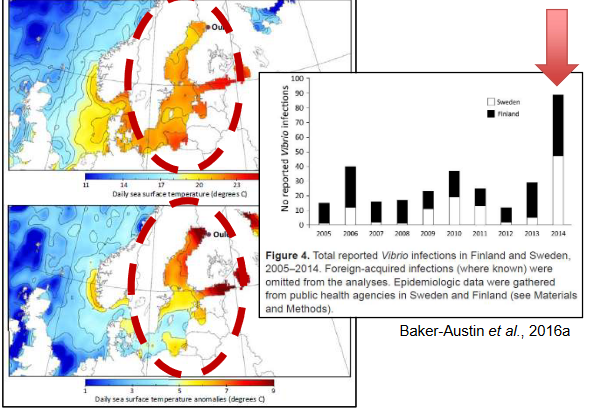
Figure 3.23: Heatwave in the Baltic Sea and Rising Vibrio Infections
An extreme heat wave in the Baltic Sea also lead to a temporal, albeit significant increase in Vibrio wound infections in Sweden and Finland!
3.4.3.2.3 A final note…
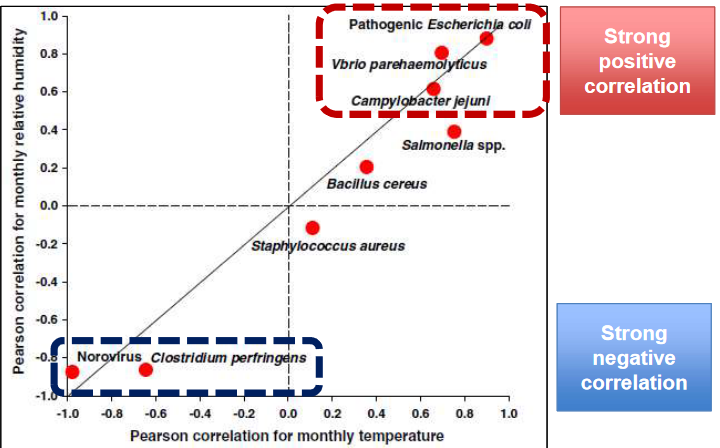
Figure 3.24: Effects of Rising Temperatures on Pathogen Infections
The above scatterplot indicates the association between the incidence of foodborne disease outbreaks and the mean monthly temperature and relative humidity.
GBS = Group B Streptococcus↩︎