9.2 Case Surveillance
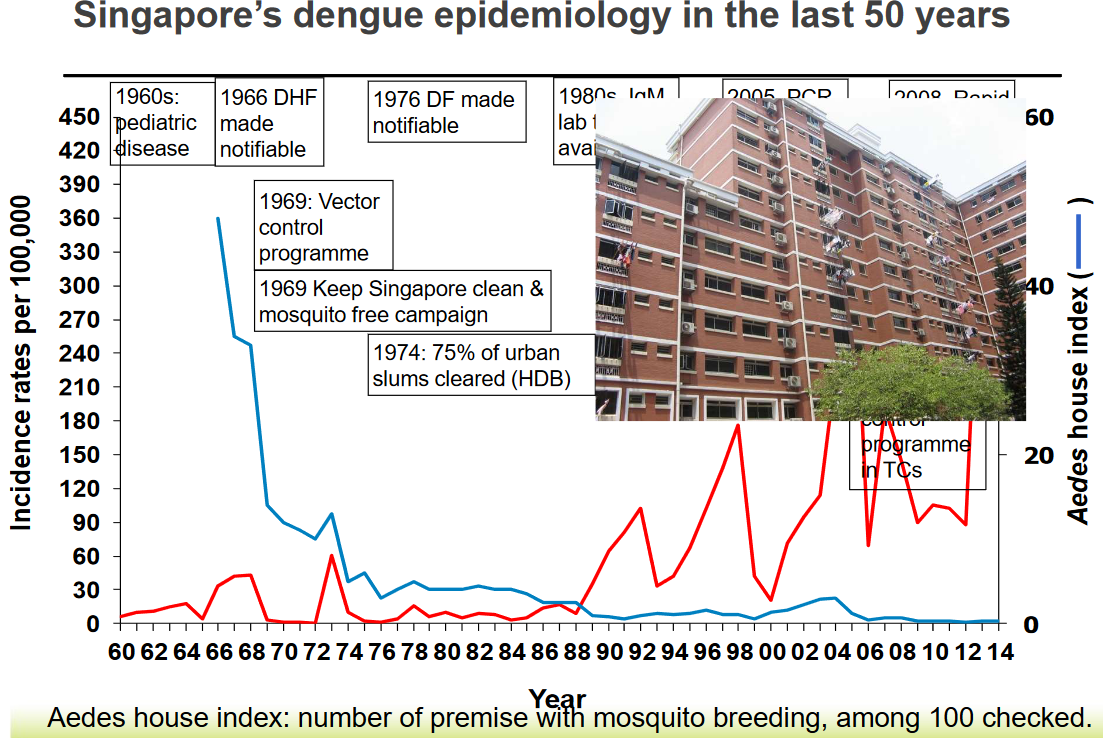
Figure 9.4: Epidemiology History of Singapore’s Past 50 Years
The above figure shows Singapore’s dengue cases over the past 50 years.
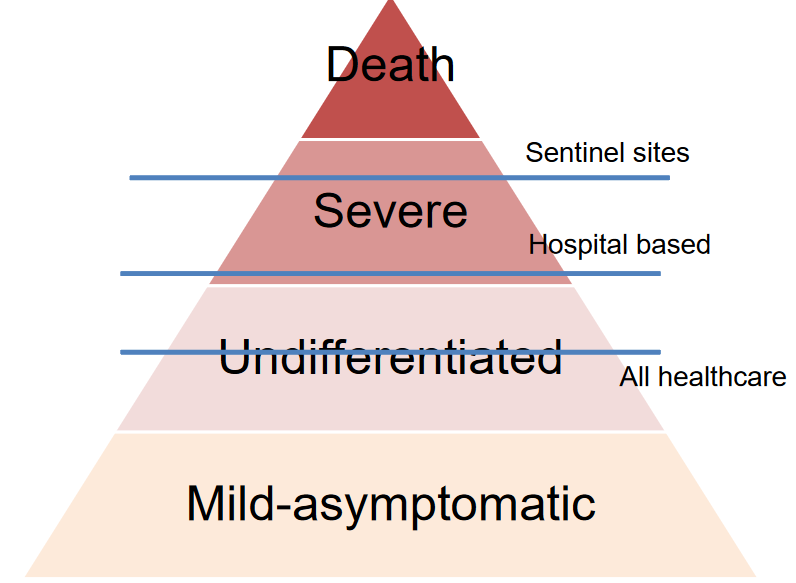
Figure 9.5: Iceberg of Clinical Cases
Yet, when one looks at figure 9.4, one should also realize the above iceberg diagram (i.e., it is possible that a large number of dengue cases are mild-asymptomatic).
9.2.1 Diagnosing dengue fever
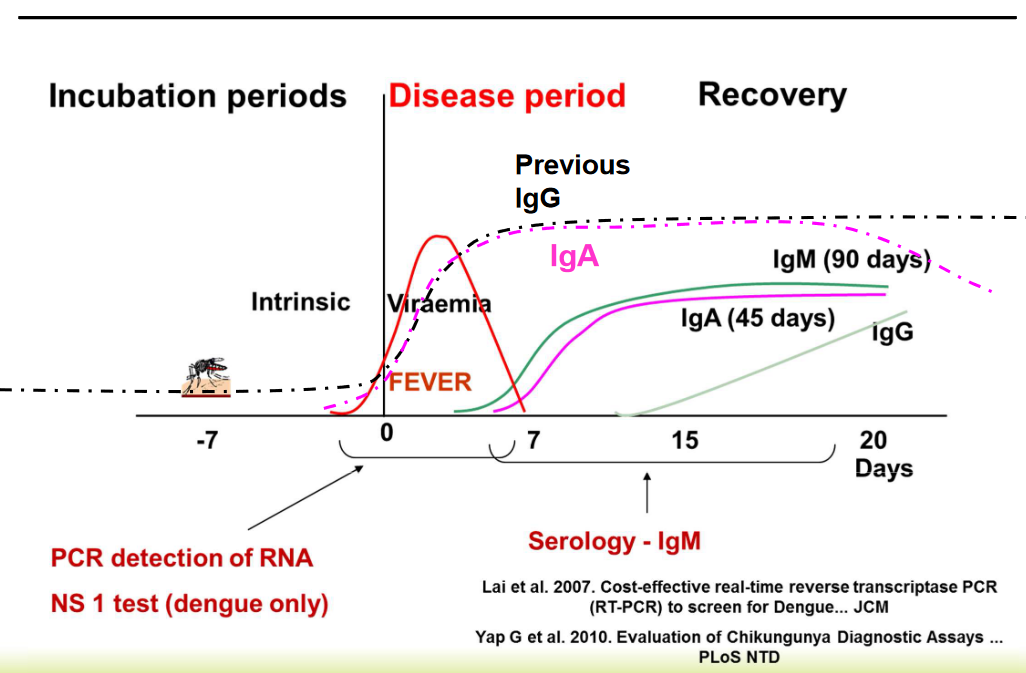
Figure 9.6: Progression of Dengue Fever
Depending on the stage of dengue fever that one is currently in, the appropriate diagnostic tools should be used.
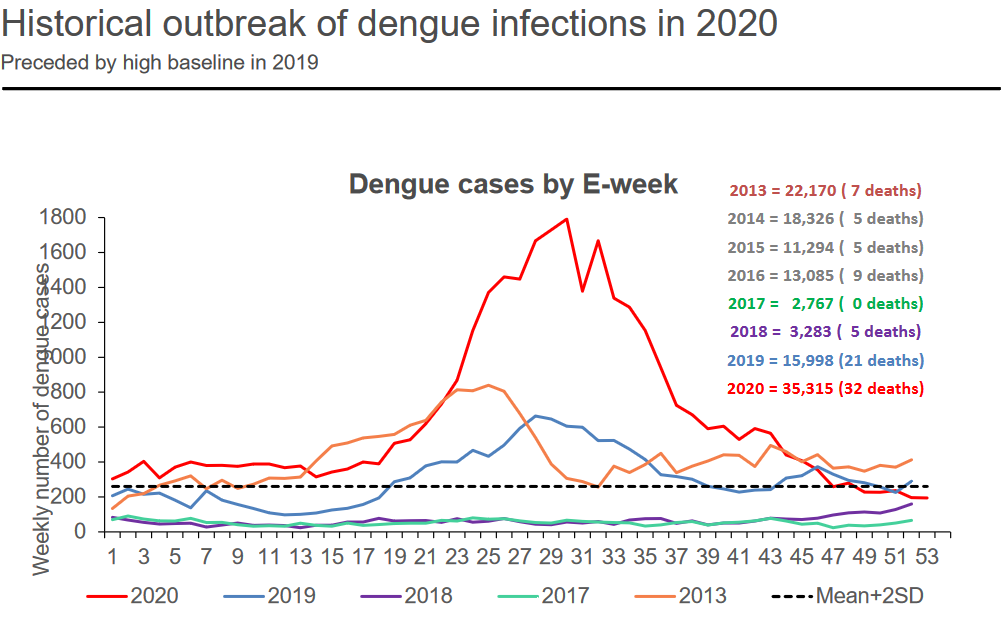
Figure 9.7: Dengue Cases in 2020 and Before
For reference, the above figure also shows dengue cases in 2020 and before.
9.2.2 Effects of COVID-19 on dengue cases in Singapore
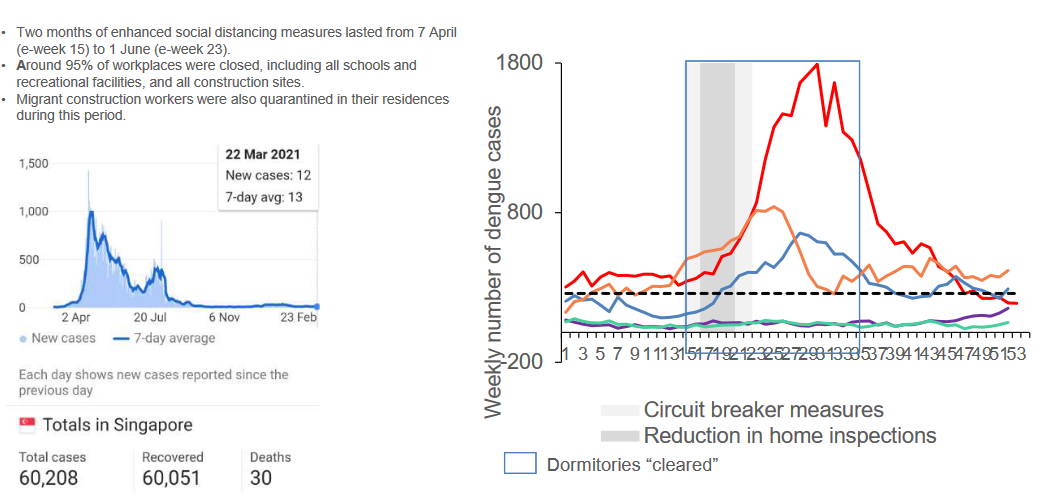
Figure 9.8: COVID-19 Statistics in Singapore
Note the large spike in COVID-19 cases in Singapore in the boxed figure.
A recent study also suggests that there is a 37.2% increase in dengue cases is likely due to social distancing measures. Working from home likely lengthens contact time between people and mosquitoes.
In the general community, there is an excess of 63.5% of dengue cases and a reduction of 68.5% of dengue cases among migrant workers. This was likely because migrant workers were stuck in their dormitories during the circuit breaker period and not at construction sites (where there are more mosquito breeding hazards).