4.1 Demographics of Dengue
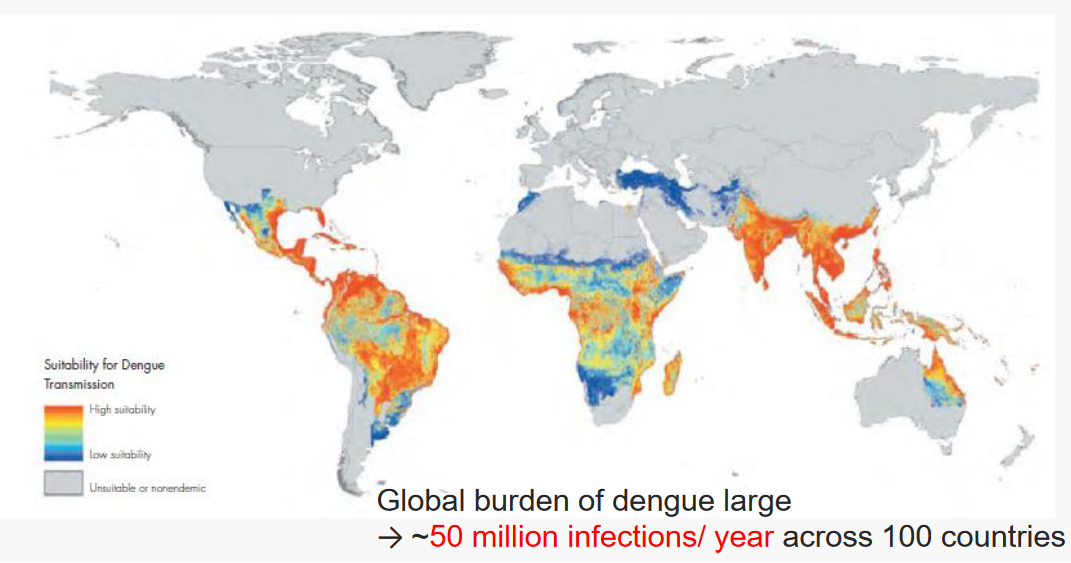
Figure 4.1: Dengue Risk Map in 2012
The above risk map taken from a study conducted by Simmons et al., they surveyed Dengue cases over multiple continents and countries and discovered that there are 50 million infections per year across 100 countries because of Dengue!
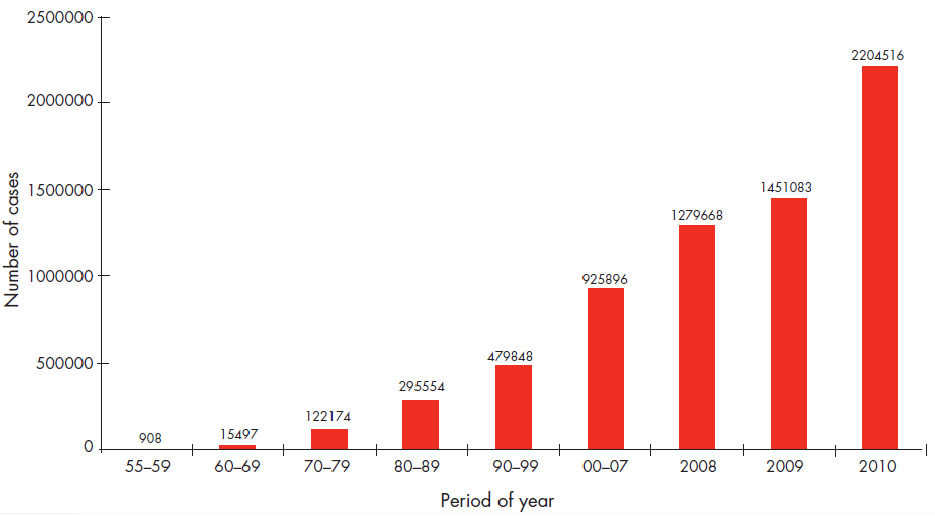
Figure 4.2: Growth in Dengue Cases to 2010
The above bar chart displays the amount of Dengue cases from 1955 to 2010 - the chart came from the WHO’s official website.
Nevertheless, the above bar chart suggests that Dengue cases are on the rise (i.e., a 30-fold increase in the past 50 years), so much so that the WHO themselves “warned that dengue fever was increasing at an alarming rate”! Indeed - two million dengue cases are reported every year by 100 countries, and of those two million cases, 5000 to 6000 cases result in death!
Not only was Dengue fever ranked as the fastest spreading vector-borne viral disease, but it also had pandemic potential.
4.1.1 Dengue Statistics in Singapore
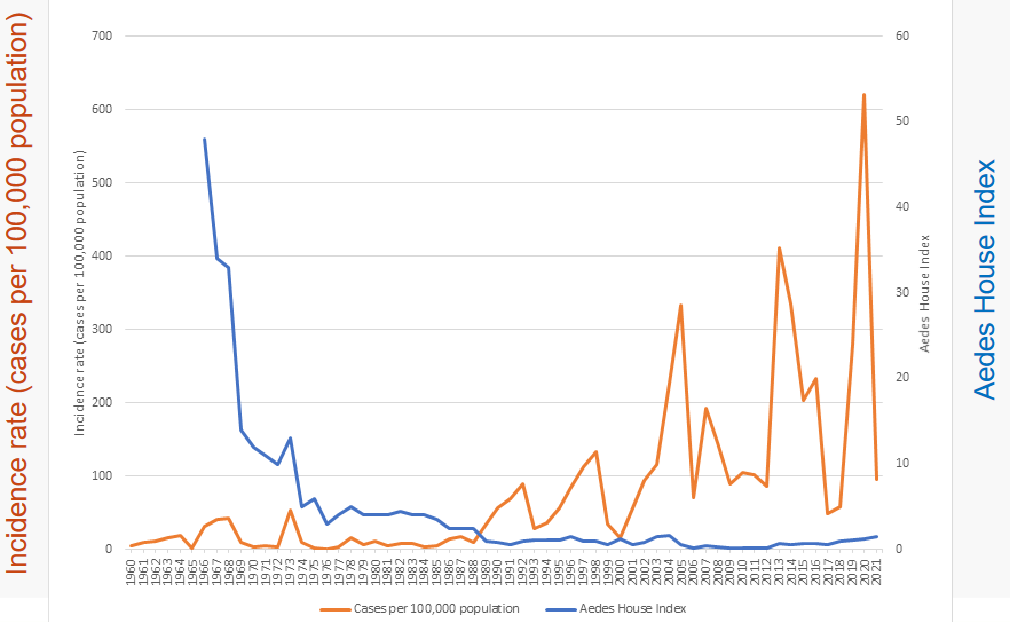
Figure 4.3: Dengue Figures in Singapore From the Past 60 Years
The Aedes House Index (i.e., HI) represents the number of premises inspected that had mosquito breeding activity per 100 households.
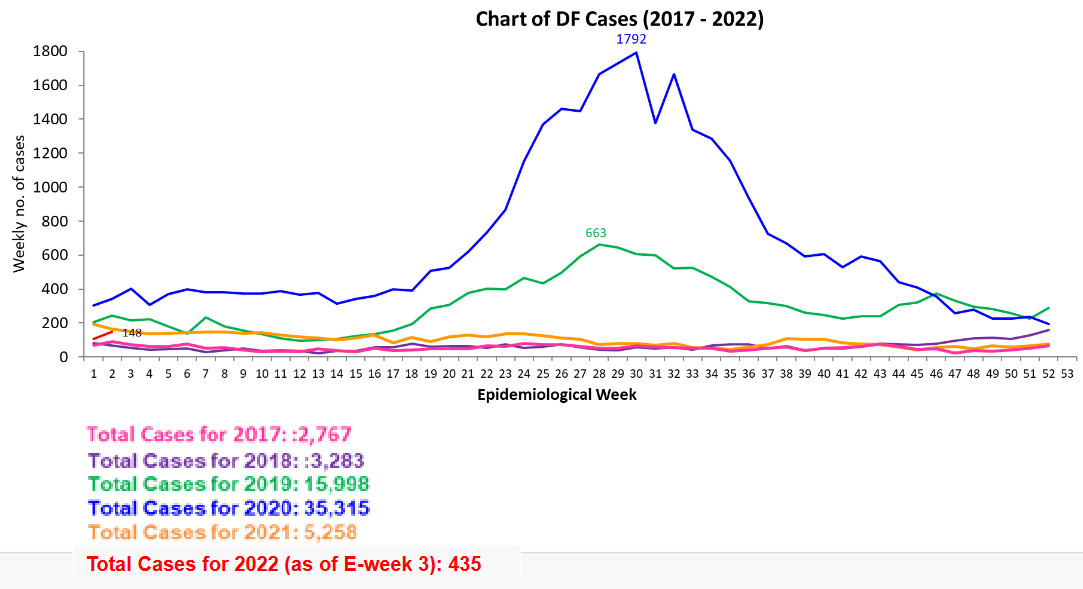
Figure 4.4: Current Status of Dengue (in 2022)
The above graphic (taken directly from the lecture slides) shows Singapore’s current Dengue statistics. As of now, we only have about 435 cases of Dengue!