10.1 Model’s Underfitting and Overfitting
We have experienced problems with both of our decision tree and random forest models. The models have higher estimated accuracy (from the model construction) and much lower accuracy on the test dataset. This Would only mean two things either the prediction model is overfitting or is underfitting.
let us quickly look at a very graphic example of underfitting and overfitting.
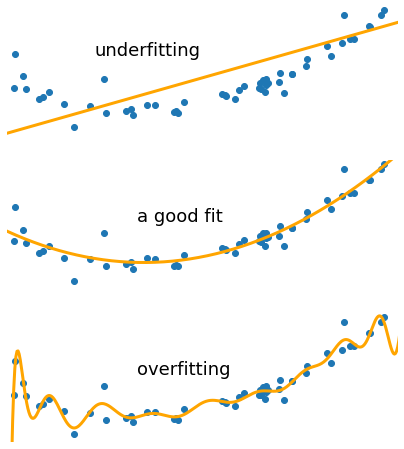
Figure 10.1: Model’s Fitting, Overfitting and Underfitting
We can see in Figure 10.1 where the first model is a straight line (a low variance model: \(y\) = \(m\) * \(x\) + \(c\)) fails to capture the underlying parabolic curve in the dataset, this is underfitting. At the other extreme, the high degree polynomial (a low bias model) captures too much of the noise at the same time as the underlying parabola and is overfitting. Although it is following the data points provided (i.e. the training dataset), this curve is not transferable to new data (i.e. the test dataset).
Among the models we have produced, the decision tree model1 with only attribute Sex as its predictor is an example of the underfitting model. It has 78.68% estimated accuracy on the training dataset but only has 76.56% accuracy on the test dataset. On the contrary, all our random forest Models have an issue of overfitting.