4.2 Assess Data Quantity
After we have load the raw data into our WorkSpace, we can start to explore and exam the raw data.
In R code, the best way to explore a dataset and get the first impression on its size (number of records and numbers of attributes) is using str() function. If you want to know more about it, as I mentioned earlier, using help by typing ?str() in your Console. There is an equivalent R code is called help <statement>, you can try help str().
Now let us run the following code,
## 'data.frame':    891 obs. of  12 variables:
##  $ PassengerId: int  1 2 3 4 5 6 7 8 9 10 ...
##  $ Survived   : int  0 1 1 1 0 0 0 0 1 1 ...
##  $ Pclass     : int  3 1 3 1 3 3 1 3 3 2 ...
##  $ Name       : Factor w/ 891 levels "Abbing, Mr. Anthony",..: 109 191 358 277 16 559 520 629 417 581 ...
##  $ Sex        : Factor w/ 2 levels "female","male": 2 1 1 1 2 2 2 2 1 1 ...
##  $ Age        : num  22 38 26 35 35 NA 54 2 27 14 ...
##  $ SibSp      : int  1 1 0 1 0 0 0 3 0 1 ...
##  $ Parch      : int  0 0 0 0 0 0 0 1 2 0 ...
##  $ Ticket     : Factor w/ 681 levels "110152","110413",..: 524 597 670 50 473 276 86 396 345 133 ...
##  $ Fare       : num  7.25 71.28 7.92 53.1 8.05 ...
##  $ Cabin      : Factor w/ 148 levels "","A10","A14",..: 1 83 1 57 1 1 131 1 1 1 ...
## $ Embarked : Factor w/ 4 levels "","C","Q","S": 4 2 4 4 4 3 4 4 4 2 ...## 'data.frame': 418 obs. of 11 variables:
## $ PassengerId: int 892 893 894 895 896 897 898 899 900 901 ...
## $ Pclass : int 3 3 2 3 3 3 3 2 3 3 ...
## $ Name : Factor w/ 418 levels "Abbott, Master. Eugene Joseph",..: 210 409 273 414 182 370 85 58 5 104 ...
## $ Sex : Factor w/ 2 levels "female","male": 2 1 2 2 1 2 1 2 1 2 ...
## $ Age : num 34.5 47 62 27 22 14 30 26 18 21 ...
## $ SibSp : int 0 1 0 0 1 0 0 1 0 2 ...
## $ Parch : int 0 0 0 0 1 0 0 1 0 0 ...
## $ Ticket : Factor w/ 363 levels "110469","110489",..: 153 222 74 148 139 262 159 85 101 270 ...
## $ Fare : num 7.83 7 9.69 8.66 12.29 ...
## $ Cabin : Factor w/ 77 levels "","A11","A18",..: 1 1 1 1 1 1 1 1 1 1 ...
## $ Embarked : Factor w/ 3 levels "C","Q","S": 2 3 2 3 3 3 2 3 1 3 ...You will see this in your console, Figure 4.4.
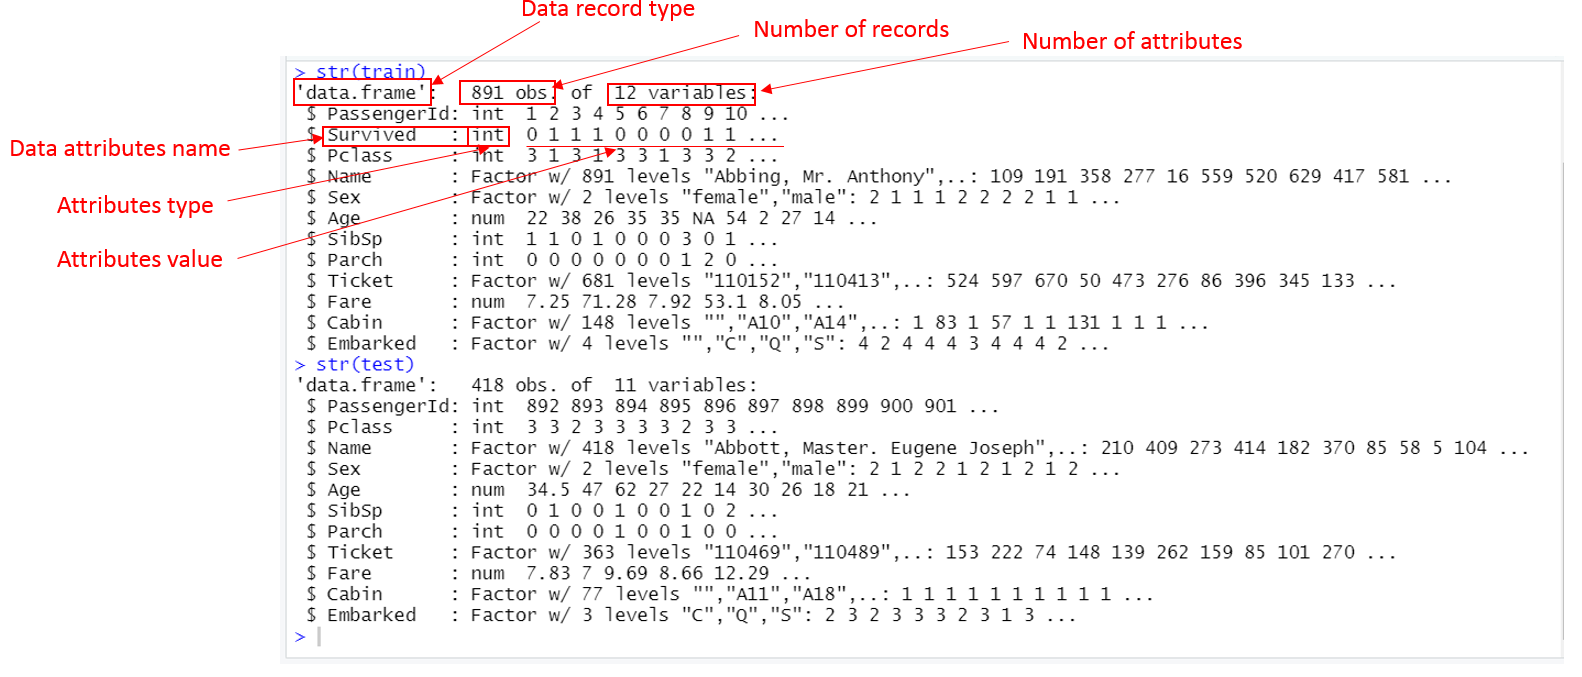
Figure 4.4: Screen capture of str(train) and str(test)
Firstly, you will see the size of the two datasets:
trainhas 891 records and each record has 12 attributes.
Notice that R uses statistics terminology, observation is record in data science term, properties of an observation are attributes of a record2. Notice that train has a type of data.frame. Data.frame is the most used data type in R. Try type ?data.frame to explore more. We will talk about a dataframe, we usually say dataset. So train is called “train dataset” and test is called “test dataset”.
testhas 418 records and each record has 11 attributes, which are less than train’s in both number of records and attributes.
Dataset test has less number of records makes sense because any data model3 generally needs large data to train and less data to test (it will become clear later).
However, why test has one less attribute in comparison with the train dataset? It is also easy to find out that the missing attribute is Survived. The dataset test is supposedly to be used for testing our prediction model (we will build it later) for predicting passengers’ have lived (Survived) and dead (Perished). So, it should not have a value now. The entire problem is for us to come up with a value on the attribute.
RStudio has a conveniently build-in function to explore data size. At the WorkSpace pane, you can see the under Environment tab, the two attributes we have created are listed there. In font of each attribute there is a
![]() sign. click it you can exam its size and structure. It is equivalent to run
sign. click it you can exam its size and structure. It is equivalent to run str() R instruction. You can also lick on the attribute name to explore the entire dataset.
Try yourself:
At RStudio WorkSpace pane,
Click varaible name train and test to explore the contents of datasets.
The same terms have different names in Machine Learning, which we will mention later, but observation is called samples, properties are called variables↩︎
A data model is an abstract model that organizes elements of data and standardizes how they relate to one another and to the properties of real-world entities. ↩︎