4.3 General Data Attributes Assessment
After a brief assessment on the data quantity, we know that the both datasets are not too big in terms of both number records (891 and 418) and number of attributes (12 and 11). We also have an intuitive understanding about the attributes, some obvious names like Name, Sex and Age; and some not so obvious names like SibSp and Parch.
Before we looking into individual attributes (single variate analysis) in our datasets, let us get some general sense of all attributes and make sure we understand each of them.
We knew that dataset test has 11 attributes and train has 12 attributes. The one attribute short is the Survived. The rest are the same. Let us look into those attributes, the following is from the Kaggle web site:
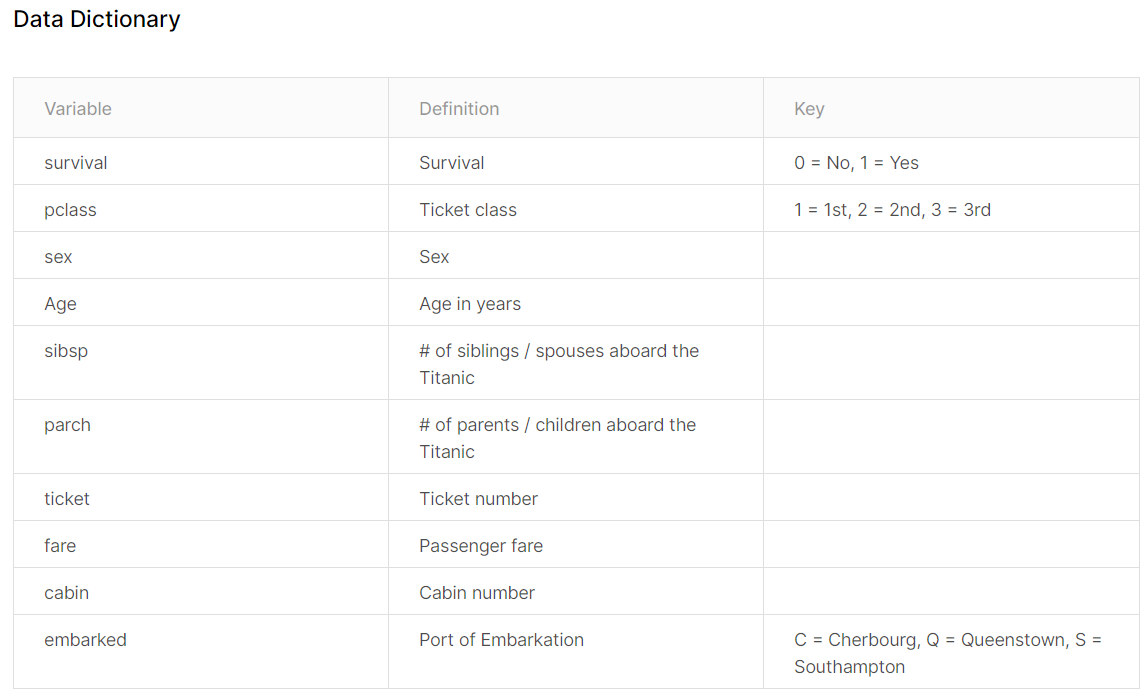
Figure 4.5: Data Dectionary from Kaggle website.
attribute Notes
Pclass: A proxy for socio-economic status (SES)

1st = Upper
2nd = Middle
3rd = Lower

Age: Age is fractional if less than 1. If the age is estimated, is it in the form of xx.5

Sibsp: The dataset defines family relations in this way...

Sibling = brother, sister, stepbrother, stepsister
Spouse = husband, wife (mistresses and fiancés were ignored)

Parch: The dataset defines family relations in this way...

Parent = mother, father
Child = daughter, son, stepdaughter, stepson
Some children travelled only with a nanny, therefore parch=0 for them.
Just looking into these attributes’ description, a few thoughts are occurred:
1. Attribute types
There are attributes should be categorical types. The values of those attributes can be any types but the importance is that they can classify the records into sets of similar groups and this grouping make sense to the problem to be solved. In Titanic datasets, attributes should have categorical type are: Survived, Sex, Embarked, and Pclass.
Other attribute perhaps should have numerical type. Thsi is because these attributes values change from record to record. They can be the values of discrete, continuous, or time series. One thing in common is that these values can be manipulated and applied with many math functions and plotting tools for visualization. In Titanic datasets, attributes should have numerical type are: Age, Fare, SibSp, Parch.
2. Contribution to Survive
The final goal is to predict passenger’s survived or not. It makes sense to assess the prediction power of each attribute, which is the contribution of an attribute to attribute Survived. In other words, the potential relationships among these attributes and with the attribute Survived need to be assessed. Here are some thoughts:
Pclass should somehow linked with Fare and Cabin. Generally, the higher the class is and the more expensive of the fare will be and the better cabin locations are. So those should have some sort of correlations among them. they together should have some affect on survive. You would think that the expensive ticket, means better cabin location and has privilege to escape first in the disaster.
What is the ticket number to do with survive? Is it just a random number? Or is associated with cabin? Or anything else like Port of embarkation? ticket number in some other systems could have more information rather than just an unique number.
Is the Fair in some ways associated with journey length, which means the Port of embarkation and the port of disembarkation? Or cabin location and condition?
You may have other thoughts too. To prove or disprove these assumptions and thoughts, we need to look into the actual datasets at least to see:
- What are the data types for various attributes?
- Which attributes are available in the dataset?
- Which attributes are categorical?
- Which attributes are numerical?
- Which attributes are mixed data types?
- Any errors in the attributes values?
- Which features may contain errors or typos?
- Which features contain blank, null or empty values?
These questions will be answered in the following two sections.