3.5 Removing the More bar of the Histogram
- If you chose
New Worksheet Plyin Step 4 above, select the Worksheet that contains the graph. Otherwise, go to next Step 2 below. - You may resize the graph by clicking anywhere within the figure. Handles appear along the perimeter of the graph. You can change the shape of the figure by clicking on a handle and dragging it. Make your graph to be displayed in an appropriate size.
- A frequency table was created with the graph in the process. That table controls some aspects of the graph. Select the cells in the last row of the frequency table, the one that contains the word More.
- Select
>Home>Delete(you can also do this byRIGHT-clickingon the selected cells and then the optionDelete).
Note: If you do not delete the row in the table, the graph will contain an extra bar on the right of the graph with a frequency equal to zero. Be sure to delete the cells and not just delete the contents in those cells.
- If the graph doesn’t update automatically, select
Formulas>Calculate Now.
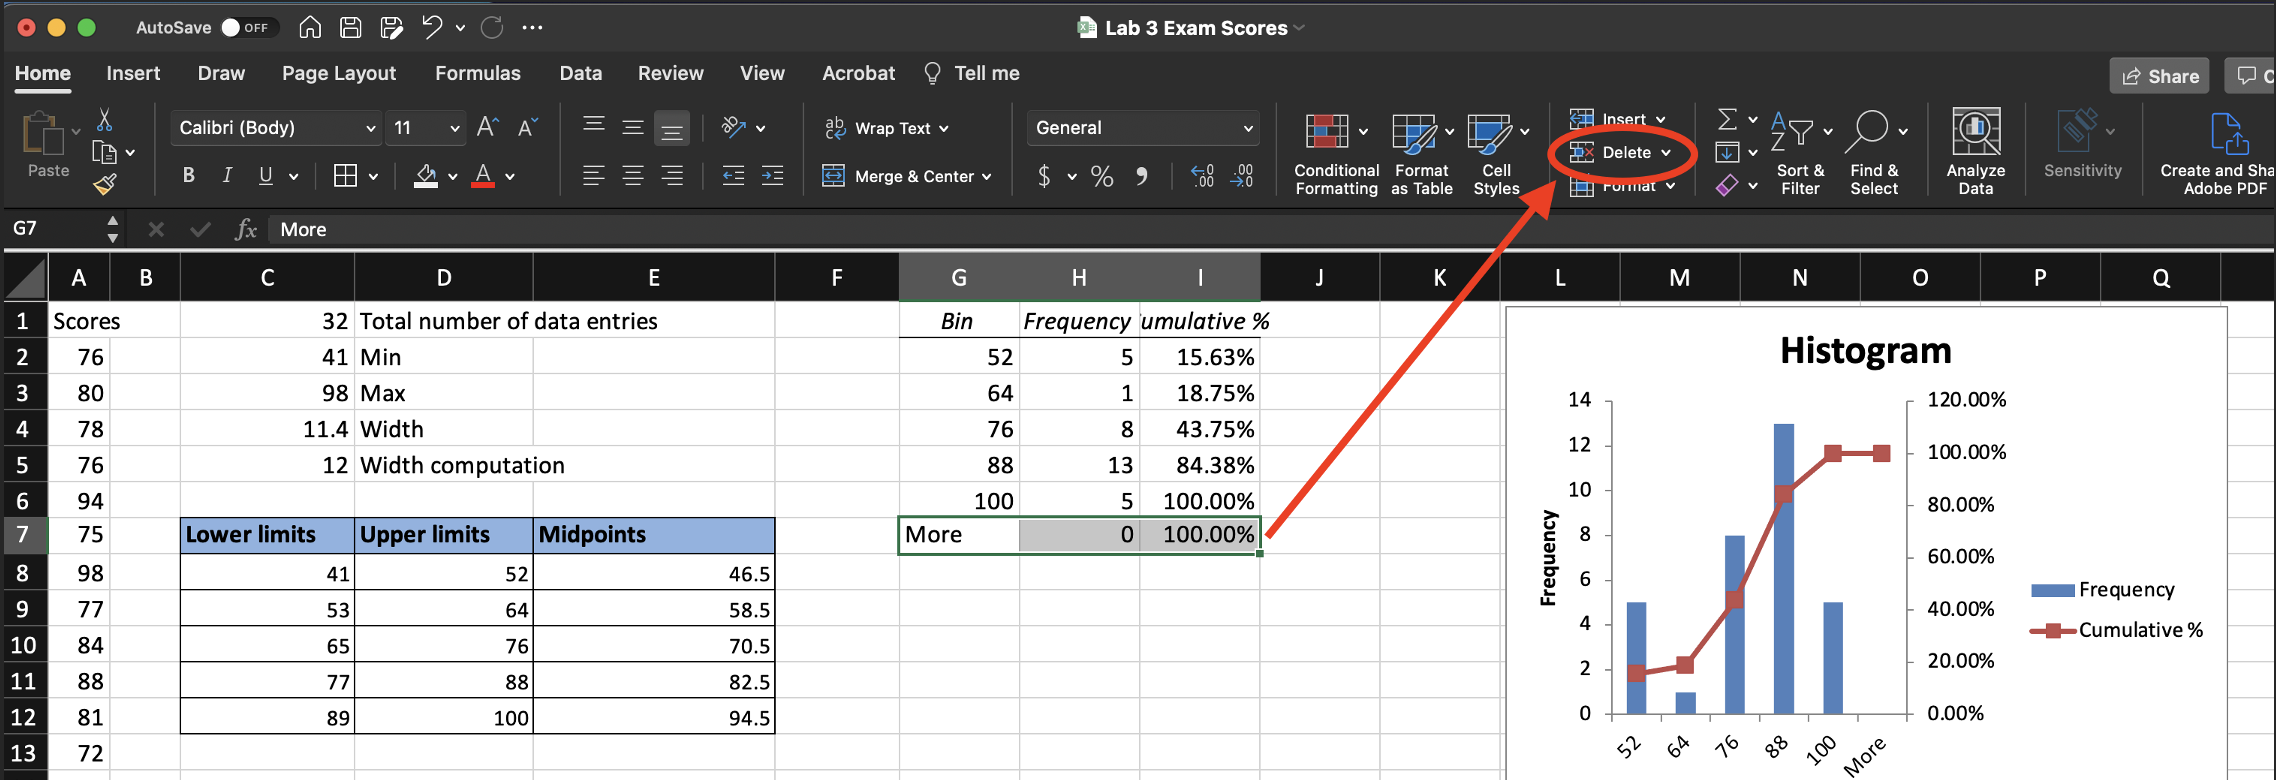
Figure 3.5: Deleting the More row from the frequency table of the histogram.
After Steps 4-5, the last column in the graph, labeled More will no longer be displayed in the graph.
RIGHT-clickon any one of the vertical bars of the graph and then selectFormat Data Point(orFormat Data Series). Alternatively, you can also double-click with your mouse on a vertical for that.- Move
Gap Widthto position0%(this makes the bars of the graph touch).