Chapter 8 Reproducible Reports with R Markdown
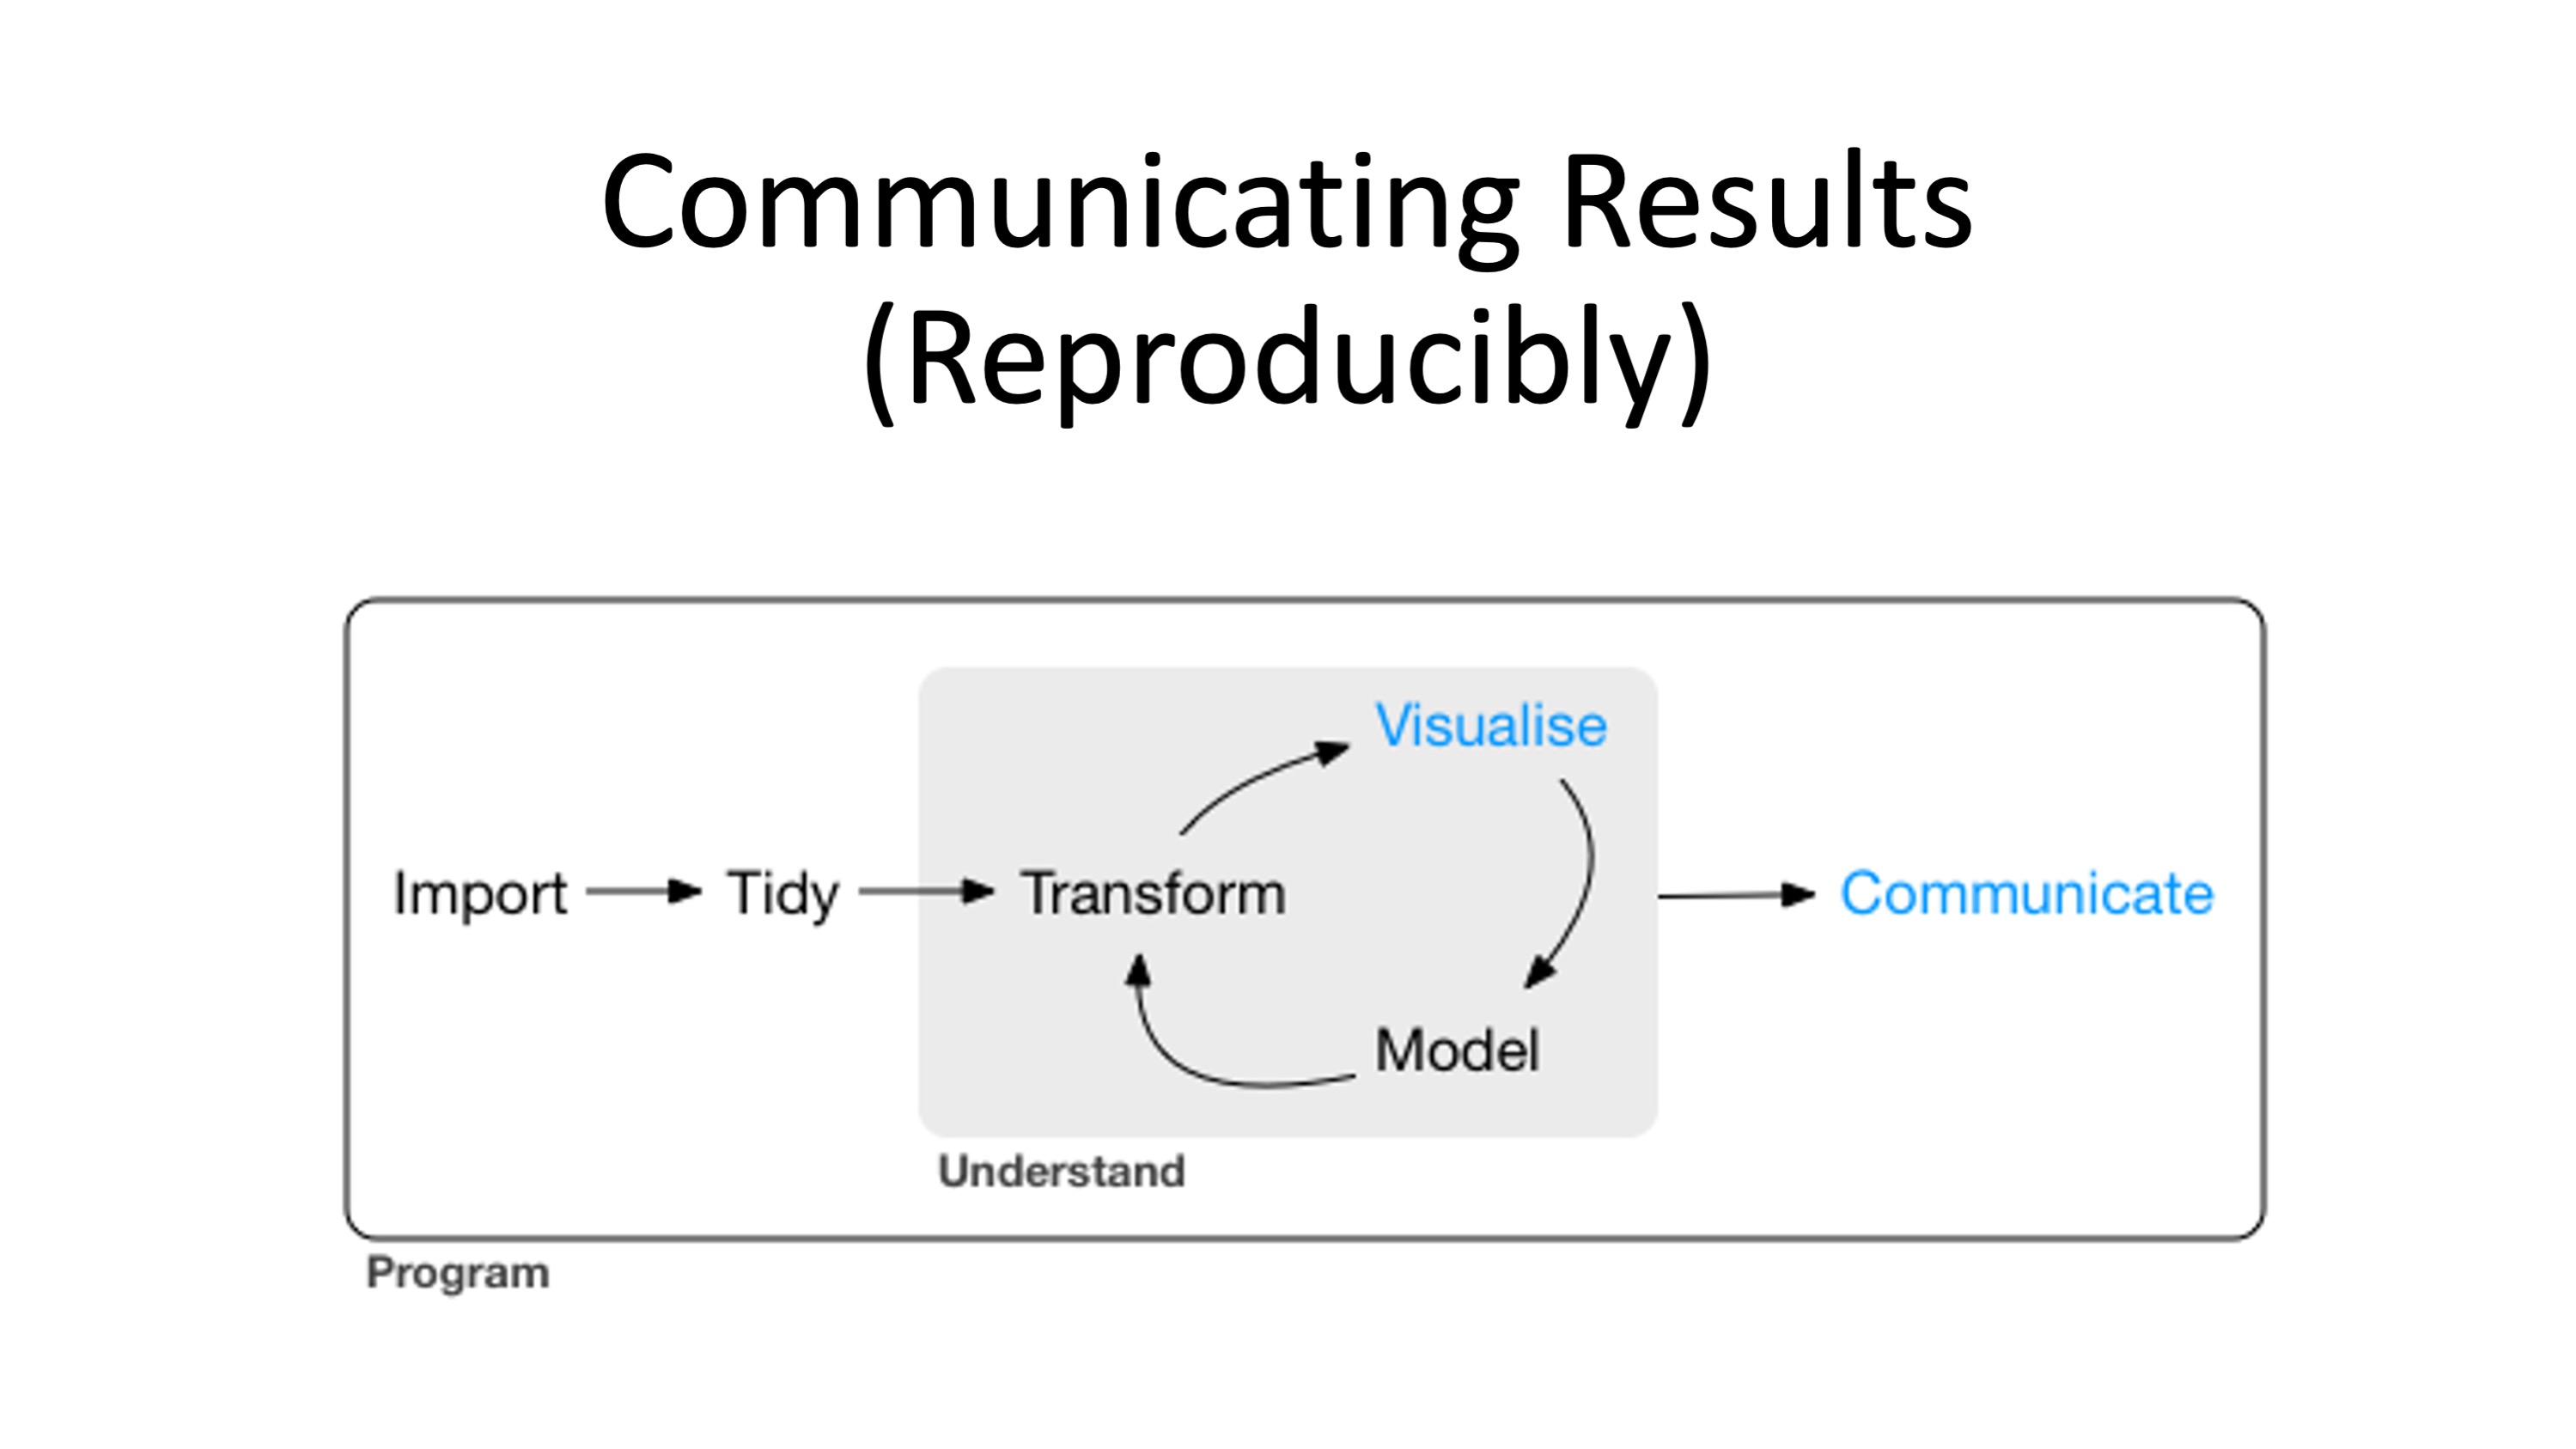
So far, you’ve learned the tools to get your data into R, tidy it into a form convenient for analysis, and then understand your data through transformation and visualization. We have not covered modeling (The goal of a model is to provide a simple low-dimensional summary of a dataset.) It doesn’t matter how great your analysis is unless you can explain it to others and provide your analysis in a way that is reproducibly by others: you need to communicate your results.
Many new users begin by first writing a single R script containing all of their work, and then share the analysis by emailing the script and various graphs as attachments. But this can be cumbersome, requiring a lengthy discussion to explain which attachment was which result.
Writing formal reports with Word can simplify this process by incorporating both the analysis report and output graphs into a single document. But tweaking formatting to make figures look correct and fixing obnoxious page breaks can be tedious and lead to a lengthy “whack-a-mole” game of fixing new mistakes resulting from a single formatting change.