5.3 Importing data
Now let’s import the data we’ll be working with. You can import data with code, or you can use RStudio’s GUI. Let’s look at both.
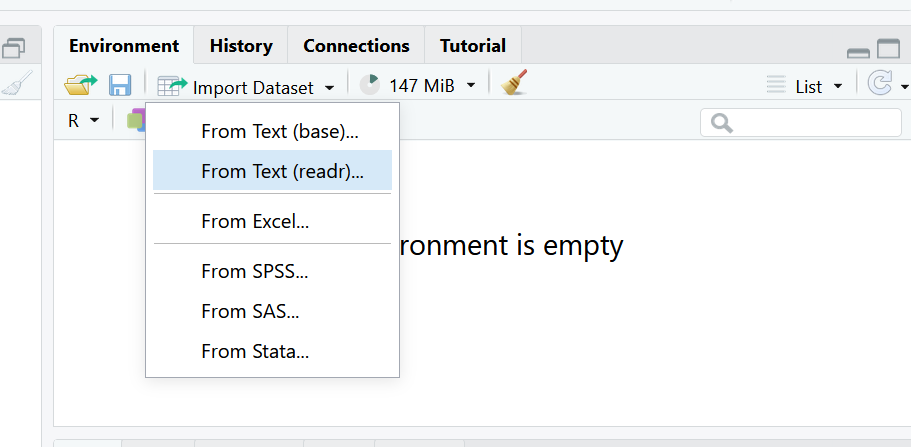
In the environment pane, select the button that says Import Dataset and choose the option From text (readr). This means we are going to be using the reader package, which is part of the tidyverse to read a file.
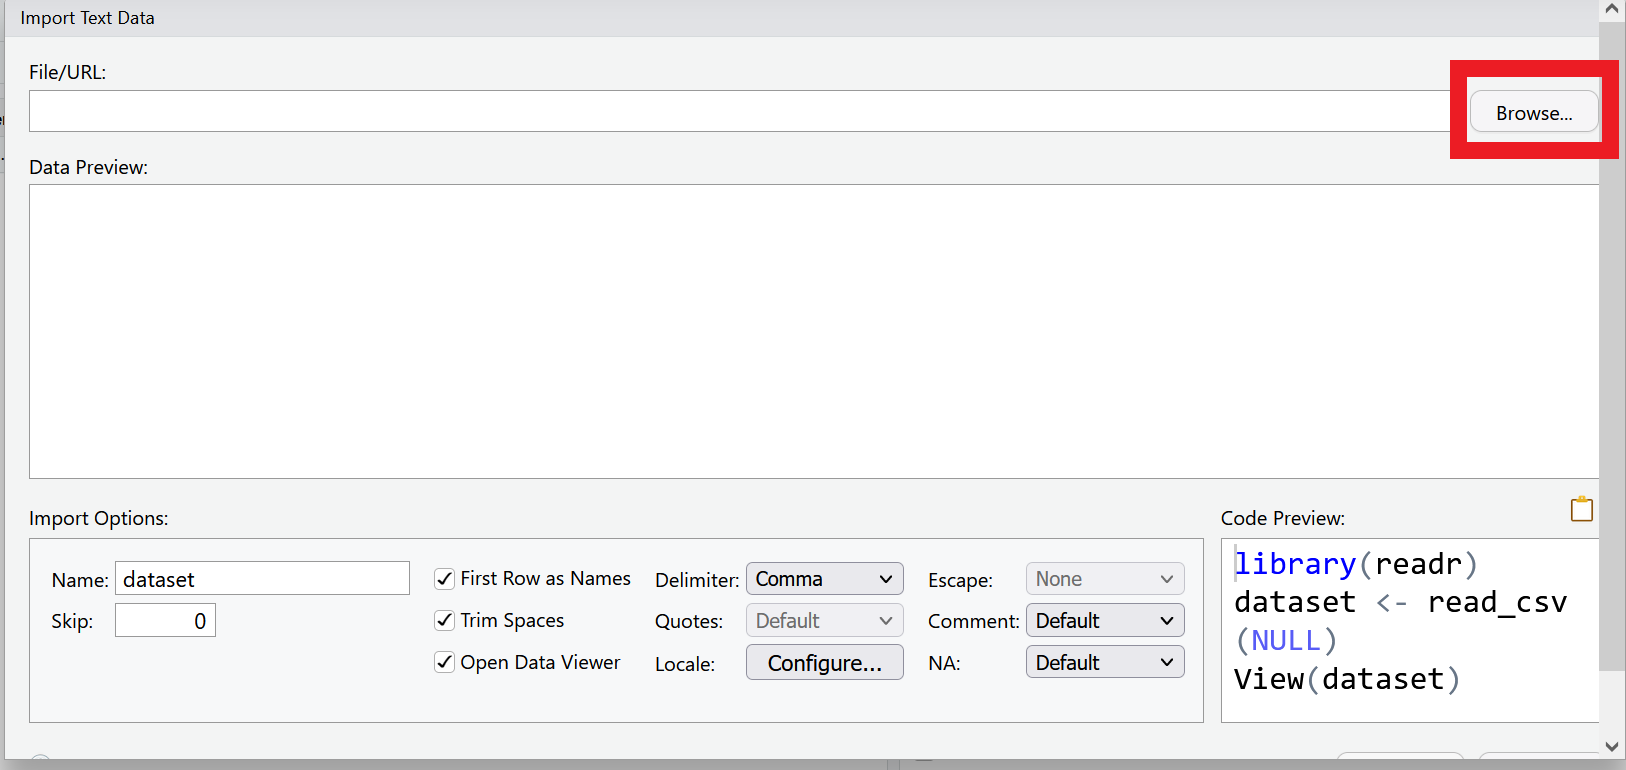
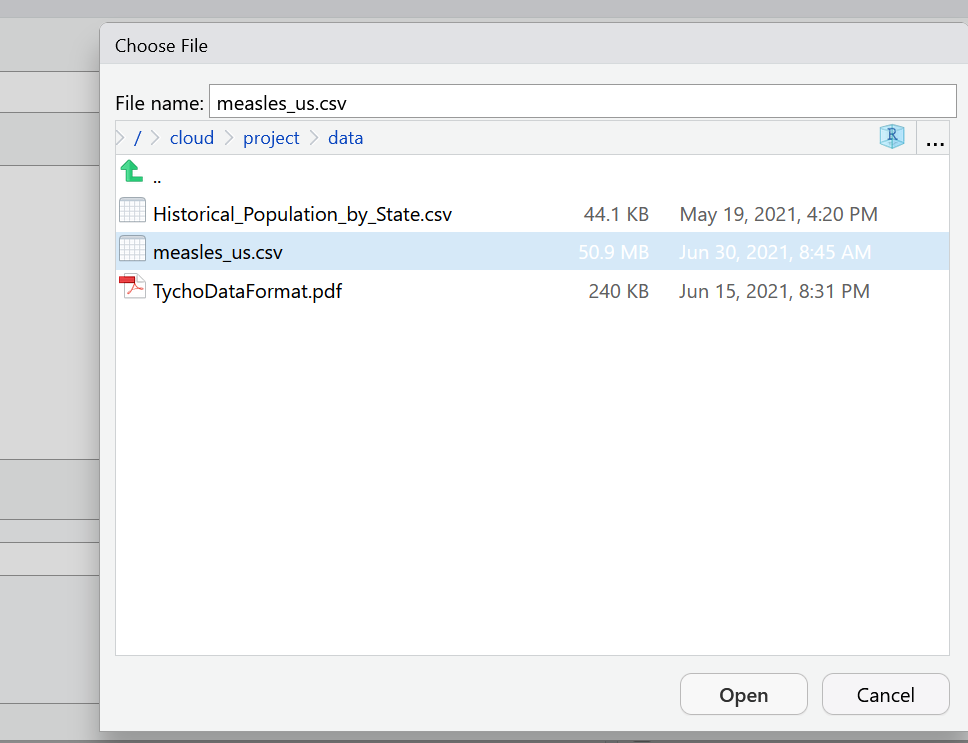
Select Browse in the dialog box that opens, and navigate to your data folder and choose the file called measles_us.csv
A new window will open with a spreadsheet view of the data. We can use this window to make some choices about how the data is imported.
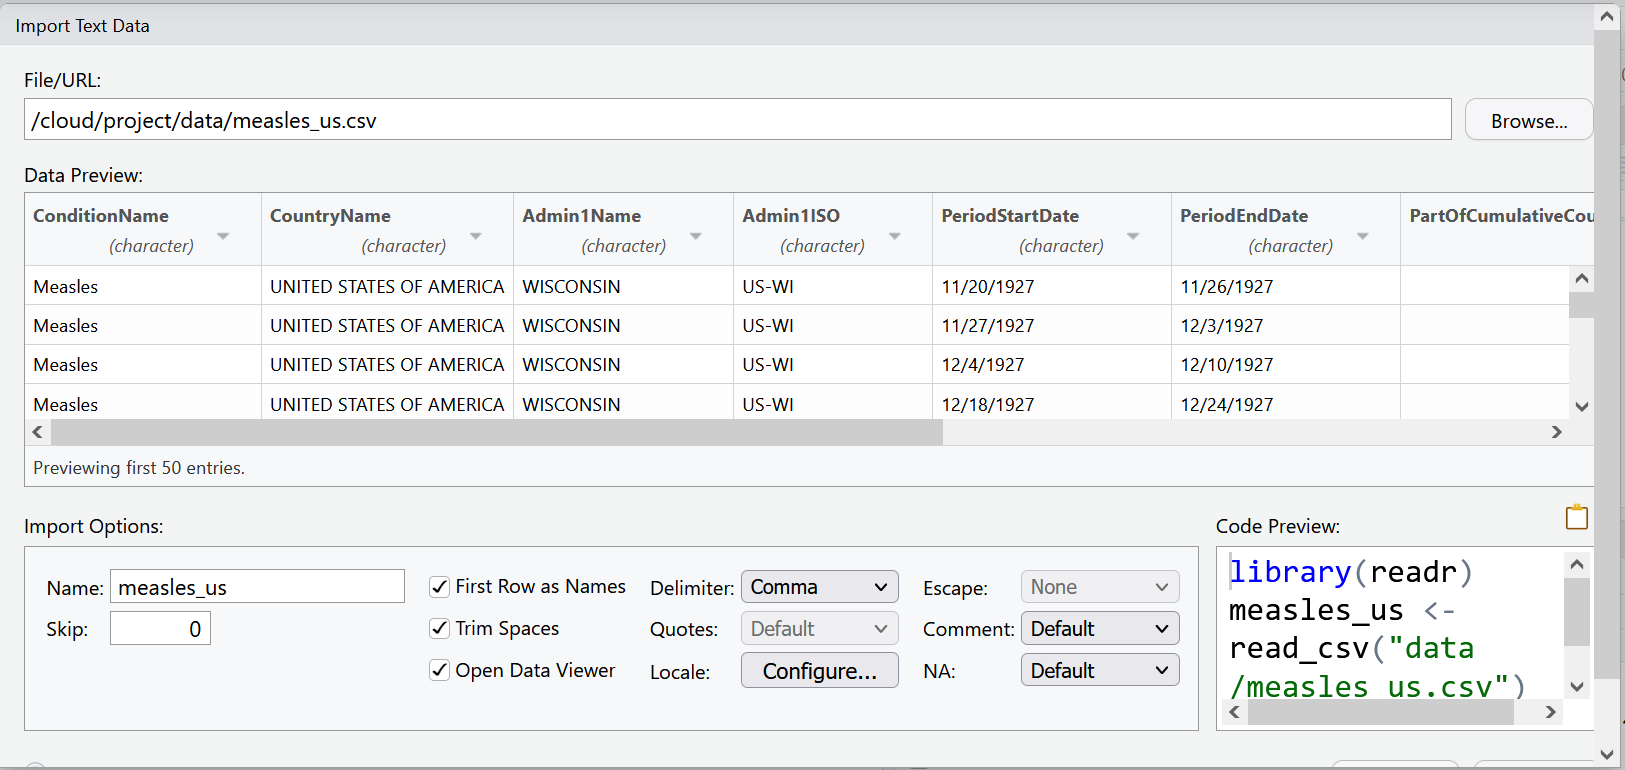
RStudio will use the file name as the default name for your dataset, but you could change it to whatever you want. In this case measles_us works pretty well.
RStudio will also try to guess the data type of your columns. It will mostly get it right, but it is not unusual that you will manually need to tell it what data type certain columns are.
For example, let’s look at the columns PeriodStartDate and PeriodEndDate. These columns contain dates, but RStudio wants to read them as character data. This is very common when importing data. Let’s change these columns to the date data type, by using the drop down menu to select date data.
You will be asked to confirm that the input format of the date is %m/%d/%Y which is like writing mm/dd/YYYY. The program needs to know what the correct input date is so it can return the right output date YYYY-mm-dd, the international standard date format.
Now our data is ready to import. Your import screen should look like:
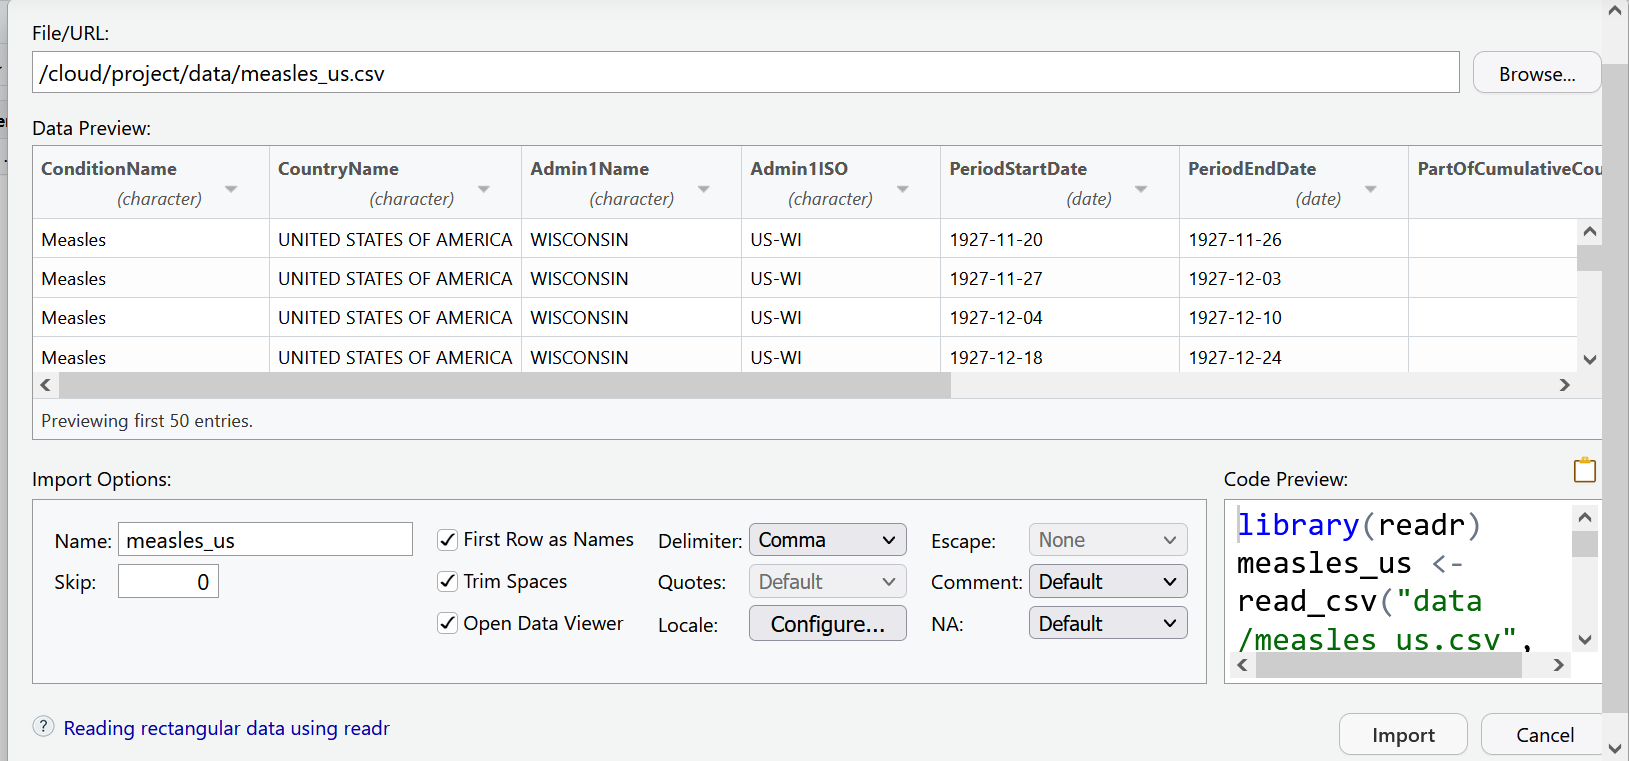
We can select the import button. But as you may have noticed, the code behind this import dialog box is also being generated. Use the clipboard icon to copy the code.
Let’s paste that into our script.R file.
So what does all this code actually mean?
We are using a function from the readr package called read_csv(). This function takes as an argument the path to where the file is located. This can take the form of an absolute path, a relative path to the working directory, or a url. The col_types argument lets you specify the data type by column name, and the na argument lets you specify the value that should be read as NA in your data set.
Remember to make sure you set your working directory before trying to import data!
library(readr)
measles_us <- read_csv(
  "data/measles_us.csv",
  col_types = cols(
    PeriodStartDate = col_date(format = "%m/%d/%Y"),
    PeriodEndDate = col_date(format = "%m/%d/%Y")),
    na = "NA"
)
View(measles_us)
After reading the data, you will typically want to inspect it and make sure everything looks okay. There are several ways of doing this. In your script above, View() opens the data as a file in your documents pane.
The most basic way is to call the name of the object as we did in the last lesson with vectors. Since we used read_csv(), the object will print as a tibble. The problem with this, is that it will only show as many columns as can fit in your window. So it’s good to know a few other ways to look at your data.
measles_us## # A tibble: 422,051 x 9
## ConditionName CountryName Admin1Name Admin1ISO PeriodStartDate PeriodEndDate
## <chr> <chr> <chr> <chr> <date> <date>
## 1 Measles UNITED STAT~ WISCONSIN US-WI 1927-11-20 1927-11-26
## 2 Measles UNITED STAT~ WISCONSIN US-WI 1927-11-27 1927-12-03
## 3 Measles UNITED STAT~ WISCONSIN US-WI 1927-12-04 1927-12-10
## 4 Measles UNITED STAT~ WISCONSIN US-WI 1927-12-18 1927-12-24
## 5 Measles UNITED STAT~ WISCONSIN US-WI 1927-12-25 1927-12-31
## 6 Measles UNITED STAT~ WISCONSIN US-WI 1928-01-01 1928-01-07
## 7 Measles UNITED STAT~ WISCONSIN US-WI 1928-01-08 1928-01-14
## 8 Measles UNITED STAT~ WISCONSIN US-WI 1928-01-15 1928-01-21
## 9 Measles UNITED STAT~ WISCONSIN US-WI 1928-01-22 1928-01-28
## 10 Measles UNITED STAT~ WISCONSIN US-WI 1928-01-29 1928-02-04
## # ... with 422,041 more rows, and 3 more variables:
## # PartOfCumulativeCountSeries <dbl>, SourceName <chr>, CountValue <dbl>The glimpse() function lets you see the column names and data types clearly. This function is part of the tibble package which is loaded with the core tidyverse.
#summary of columns and first few entries
glimpse(measles_us)
## Rows: 422,051
## Columns: 9
## $ ConditionName <chr> "Measles", "Measles", "Measles", "Measles"~
## $ CountryName <chr> "UNITED STATES OF AMERICA", "UNITED STATES~
## $ Admin1Name <chr> "WISCONSIN", "WISCONSIN", "WISCONSIN", "WI~
## $ Admin1ISO <chr> "US-WI", "US-WI", "US-WI", "US-WI", "US-WI~
## $ PeriodStartDate <date> 1927-11-20, 1927-11-27, 1927-12-04, 1927-~
## $ PeriodEndDate <date> 1927-11-26, 1927-12-03, 1927-12-10, 1927-~
## $ PartOfCumulativeCountSeries <dbl> 0, 0, 0, 0, 0, 0, 0, 0, 0, 0, 0, 0, 0, 0, ~
## $ SourceName <chr> "US Nationally Notifiable Disease Surveill~
## $ CountValue <dbl> 85, 120, 84, 106, 39, 45, 28, 140, 48, 85,~You can also use the head() function to view the first n rows. The function defaults to 6 rows, but you can specify the number you want with an argument. Below we ask to see just the first 5 rows.
#first n rows (defaults to 6)
head(measles_us, n = 5)
## # A tibble: 5 x 9
## ConditionName CountryName Admin1Name Admin1ISO PeriodStartDate PeriodEndDate
## <chr> <chr> <chr> <chr> <date> <date>
## 1 Measles UNITED STATE~ WISCONSIN US-WI 1927-11-20 1927-11-26
## 2 Measles UNITED STATE~ WISCONSIN US-WI 1927-11-27 1927-12-03
## 3 Measles UNITED STATE~ WISCONSIN US-WI 1927-12-04 1927-12-10
## 4 Measles UNITED STATE~ WISCONSIN US-WI 1927-12-18 1927-12-24
## 5 Measles UNITED STATE~ WISCONSIN US-WI 1927-12-25 1927-12-31
## # ... with 3 more variables: PartOfCumulativeCountSeries <dbl>,
## # SourceName <chr>, CountValue <dbl>