3 Day 2
Hello!
My Office: Dickens 009C
Office Hours: 3-4 PM Monday/Wednesday
“Open Door” Policy
Zoom Office Hours
On-request, I won’t sit in a Zoom room by default every week
Email me: rmsholl@ksu.edu
These notes are always available
Burning questions/emergencies and couldn’t catch me in my office
Just email me, \(\approx\) 72-business-hour response time
If I’m past that window, I’m either dead or on-vacation
I will follow up when/if I return
The speech I wish I could have given Monday:
- I was once, literally, right where you are
Review
Two general forms of statistics:
Descriptive
- Quarterback Passer Rating
Inferential
- Unemployment negatively effects GDP (Okun’s Law)
Population
- Entire collection of individuals we’re seeking information on
Sample
A subset of that population
The actual observed group
How often do K-State students attend home football games?
- Randomly survey 100 students that walk into the library on a random Monday
Why do we sample?
I want to determine which gas station in Manhattan, KS is the least popular
- Do I ask every person in town?
Simple Random Sampling
- A sample chosen by a method where every selection from the population made is equally likely to make up the sample
Stratified Sampling
Divide the population into similar groups (i.e., group students by college)
Randomly sample from those groups (strata)
Cluster Sampling
Divide the population into clusters (i.e., split Manhattan, KS by street block)
Randomly sample from the clusters
Systematic Sampling
Randomly choose a start point in a “lined-up” population
Sample every \(k^{th}\) item
i.e., Starting from the \(4^{th}\) batch of ice cream produced on a given day, Call Hall will check the quality of every \(4^{th}\) batch that comes off the production line
Sample of Convenience
- Class height
Voluntary Response Samples
- Customer support reviews
Parameter
- Describes an entire population
Statistic
- Describes a sample
Types of Data
Data set
- Collected information
Individuals
Something the information is collected on
People/Places/Things/etc.
Variables
- Characteristics about the individuals we collected information from
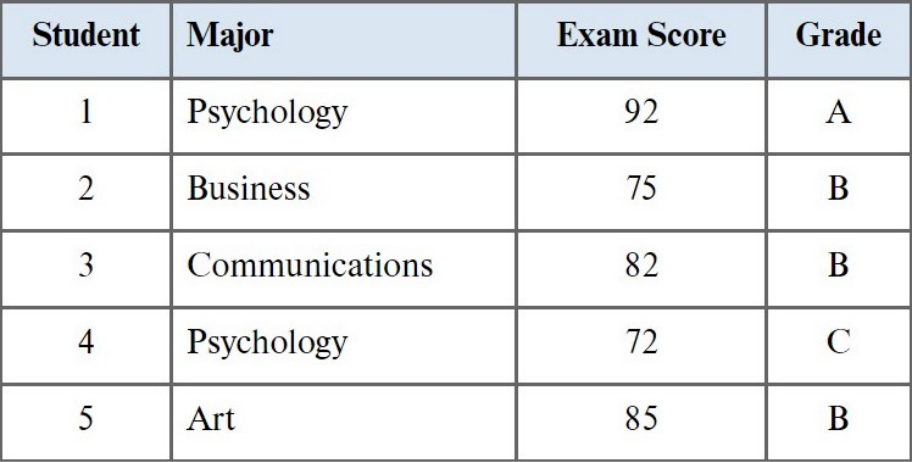
We collected information on students
The variables are major, exam score, and grade
The values of those variables are called data
How many individuals?
What are the variables?
What are the data for individual 3
Variables
Qualitative (Categorical) variable
Values represent categories
Identifying labels/names
Can’t really do math with a label or name
We code these into numbers to fix that
- i.e., Cat-owners = 0 | Dog-owners = 1 | Both = 2
Quantitative variable
Values represent meaningful numbers
Height of a person, sales of a product
We can do math with these
A lot of how we do statistics depends on what data we have
Qualitative variables can be ordinal or nominal
Ordinal variables
Categories/values of the variable have a natural ordering
Letter grade: A, B, C, D
Clothing size: S, M, L
Nominal variable
Categories/values of the variable cannot be ordered
State of residence
Gender
Quantitative variables can be discrete or continuous
Discrete variable
A countable number of values (0, 1, 2, 3, 4, …)
Number of students in a classroom
Population size of fish in a pond
How many times a coin flip was successfully called
Continous variable
A continuous range of numbers (0, 0.1, 0.11, 0.111, …)
Temperature
Volume of liquid in a glass
Height/Weight
Quantitative variables can be categorized by level of measurement used for obtaining data values:
Interval level
Numerical measurement
Differences between values make sense
Ratios don’t make sense because zero has no meaning
Temperature in Celsius/Fahrenheit (Does 0 mean there’s no heat?)
Dates (Is there a meaningful ratio you can make out of 1997 and 2020?)
Ratio level
Numerical measurement
Differences between values make sense
Ratios also make sense
Zero has meaning, it represents absence of the quantity
Height (If you’re 0 inches tall, do you have height? Is there a meaningful percentage difference in height between 64 and 67 inches?)
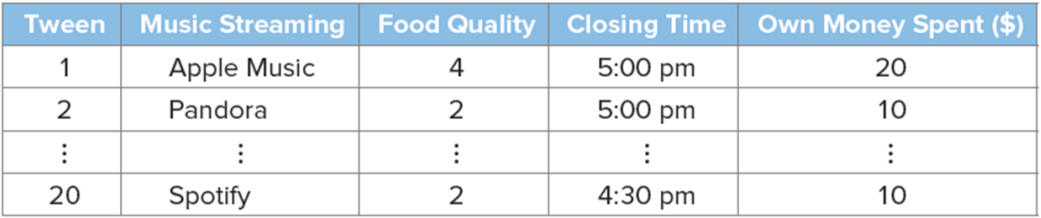
Categorize the variables:
Music
- Qualitative
Food quality
- Qualitative
Closing time
- Quantitative
Own money spent
- Quantitative
Communicating with Data
- Raw data isn’t entirely useful
Statistics is really good at summarizing and visualizing data
This is the primary focus of the next chapter
Choosing the “best” graph for displaying our data depends on our data
What kind of data do we have?
Categorical?
Numerical?
What are we trying to do?
Look at the distribution of our data?
See how two or more variables are related?
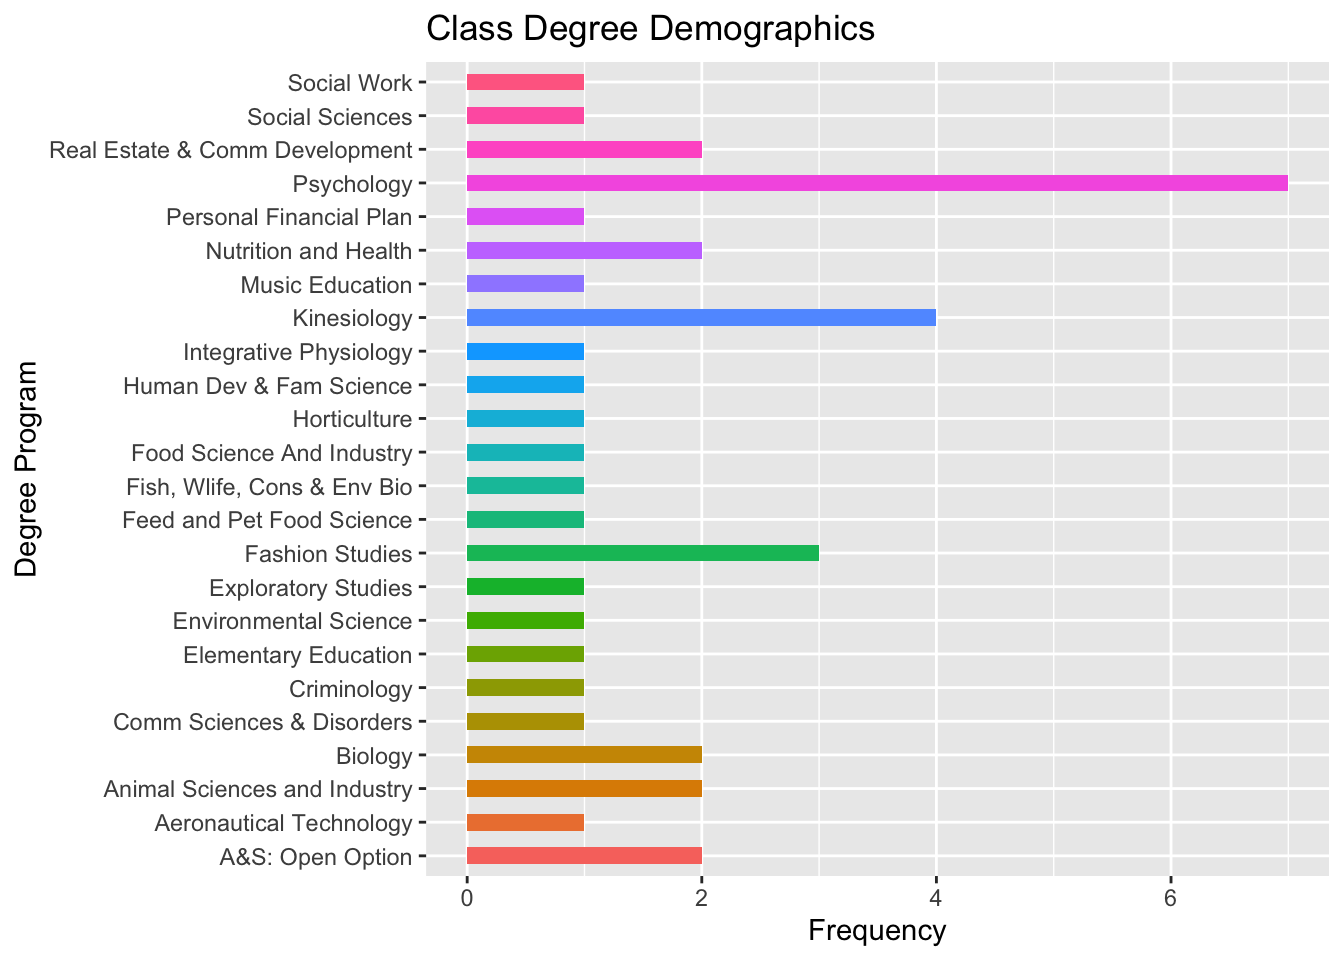
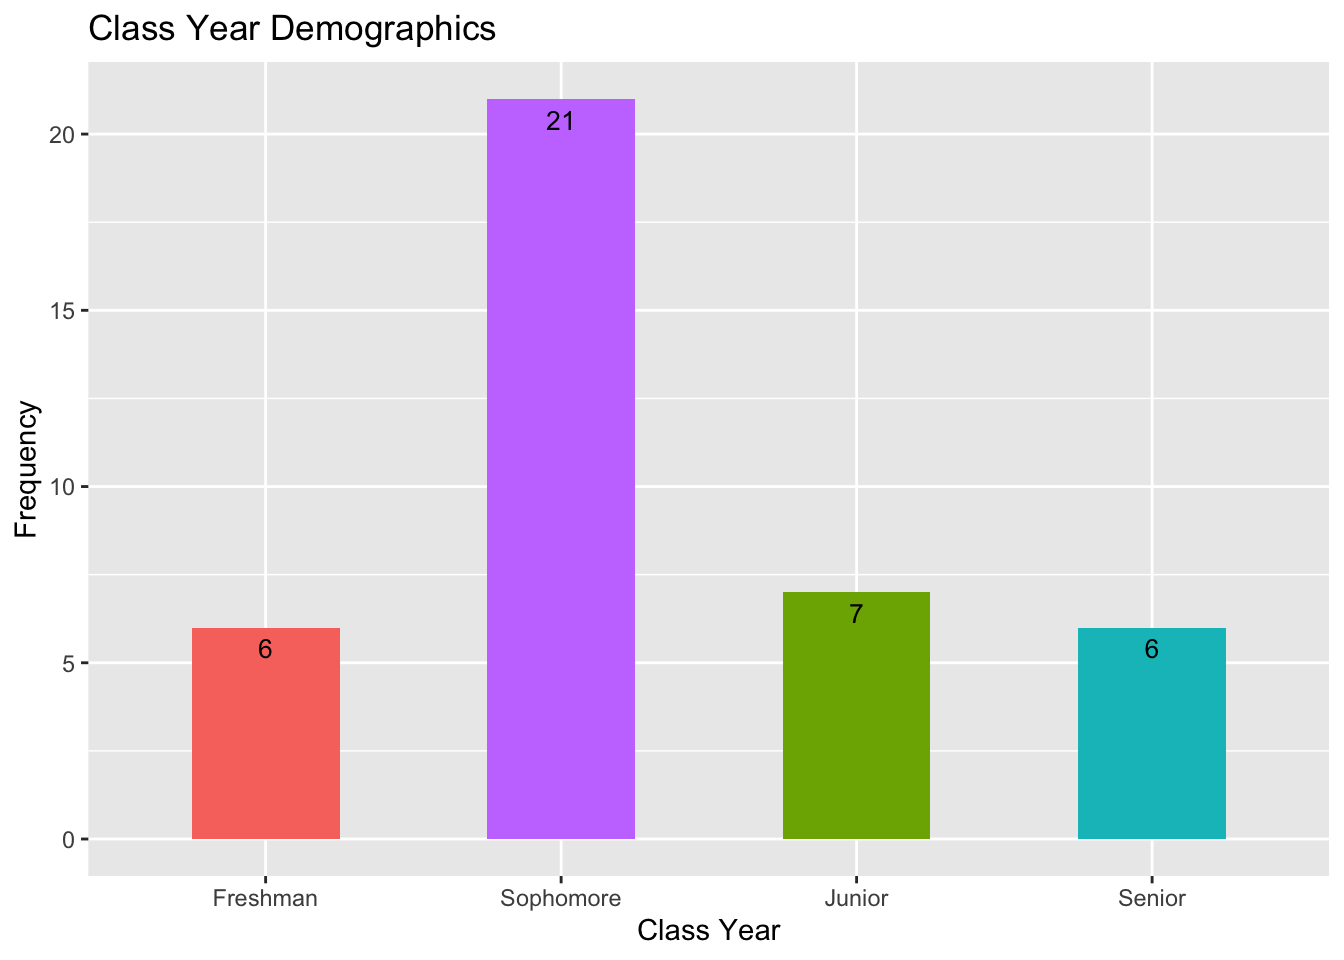
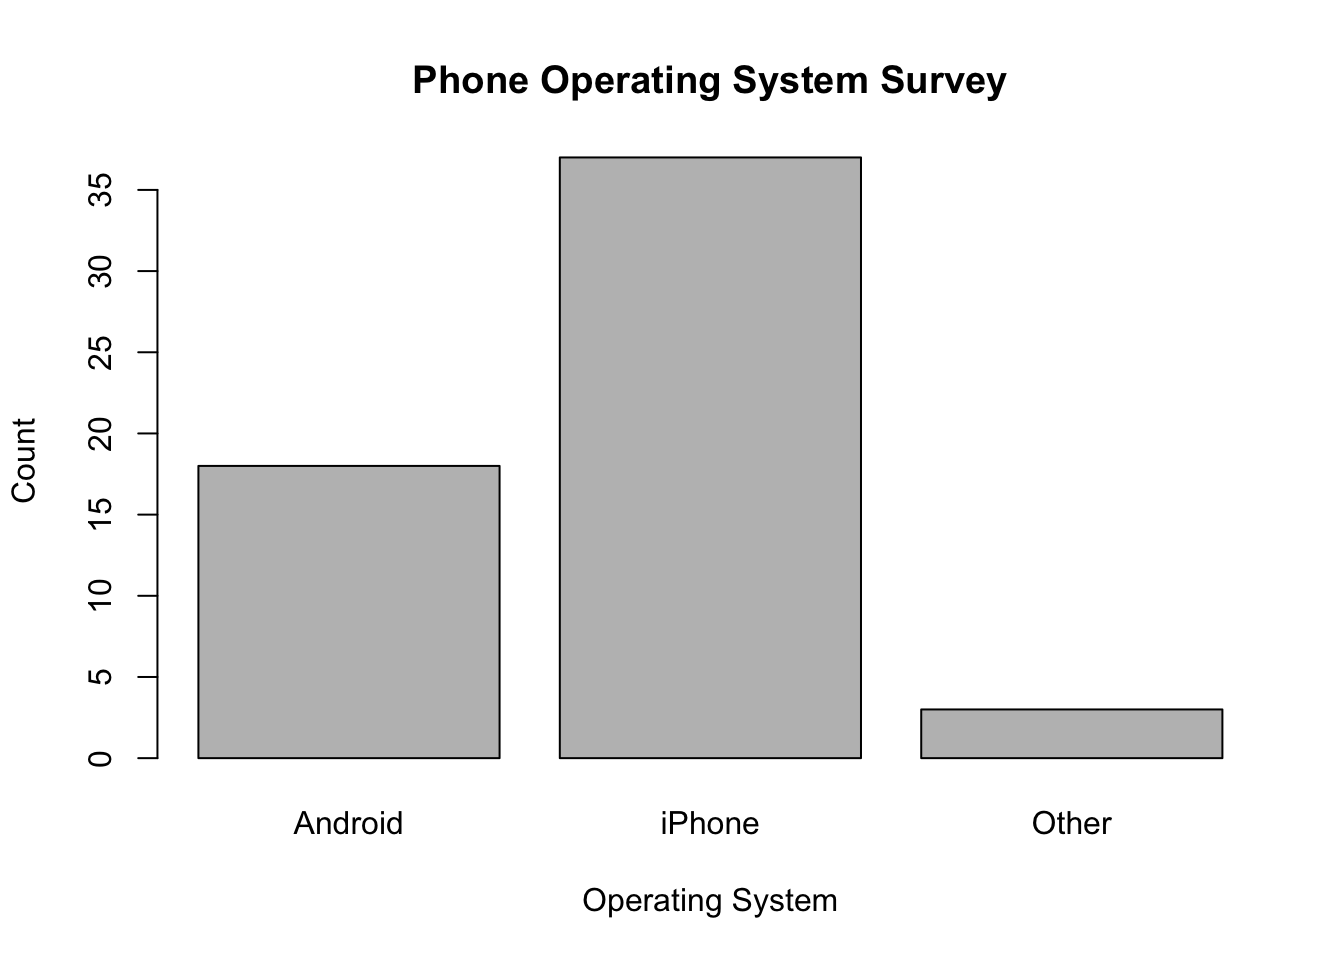
Bar graph: One or more categorical variable
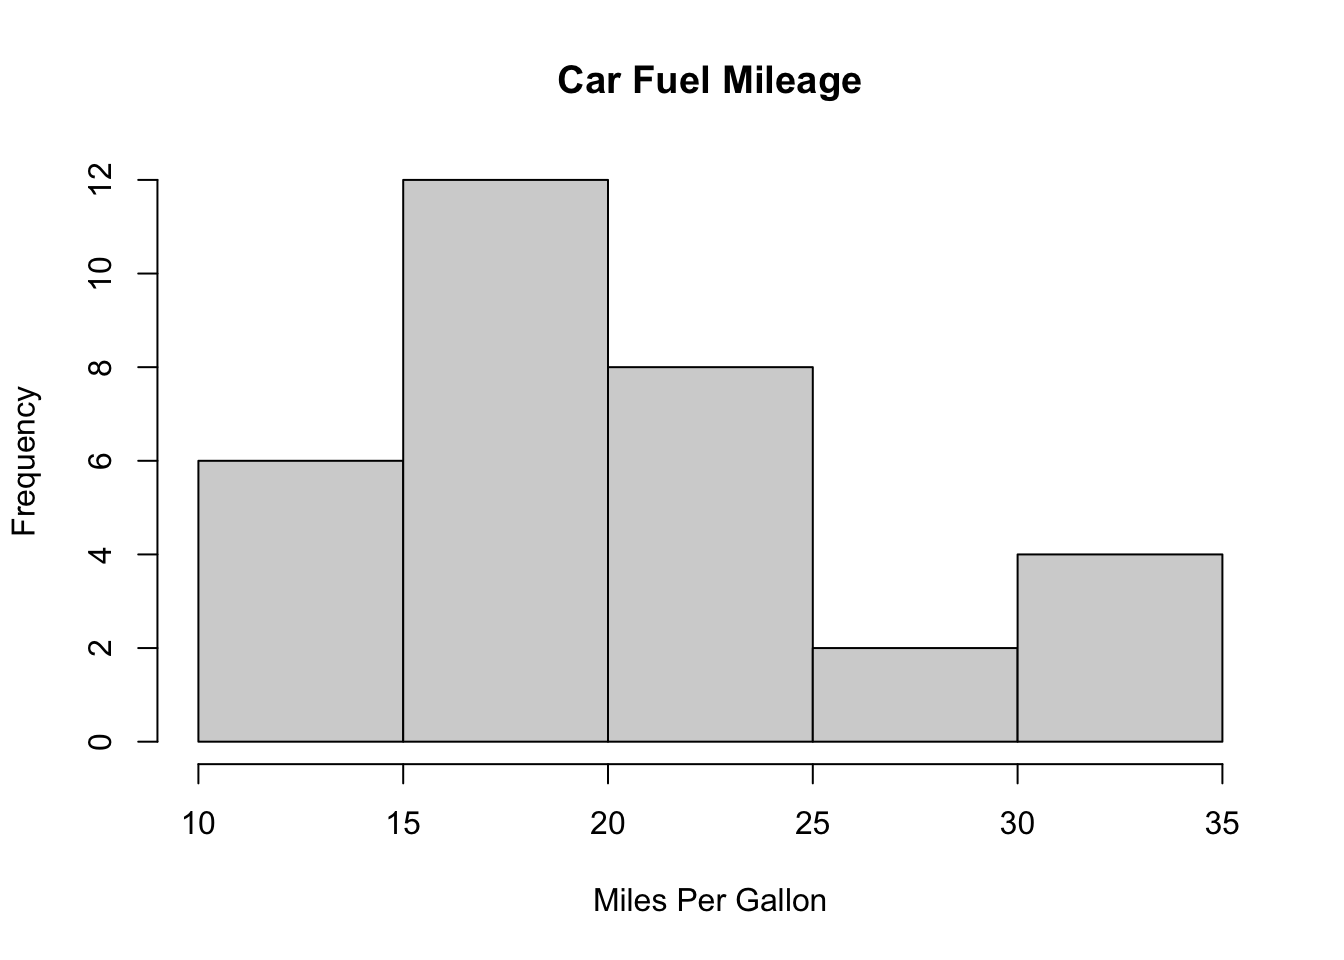
- Histogram: One numerical variable
- Scatterplot: More than one numerical variable
Summarizing Data
Even when clean, data is messy
Interpreting information is how we make decisions
Every decision we make is data driven
- Even when it’s “emotional data”
Statistics gives us tools to summarize and interpret data rapidly
Frequency Distribution

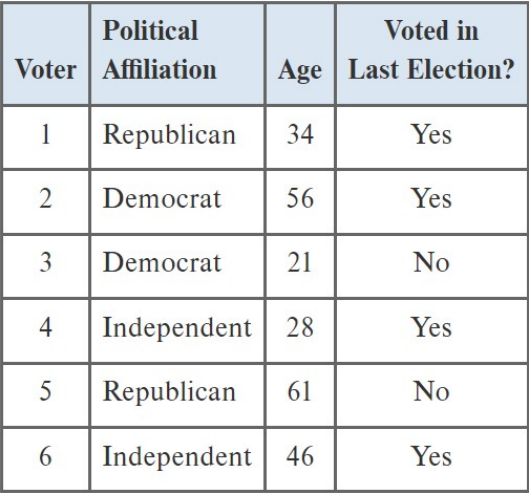
Credit cards used by the last 10 customers at a store
Population?
Sample?
How many variables?
What type of variable?
Frequency distribution
Groups data into categories
Records the number of observations that fall into each category
“How frequently do these variables occur in my sample?”
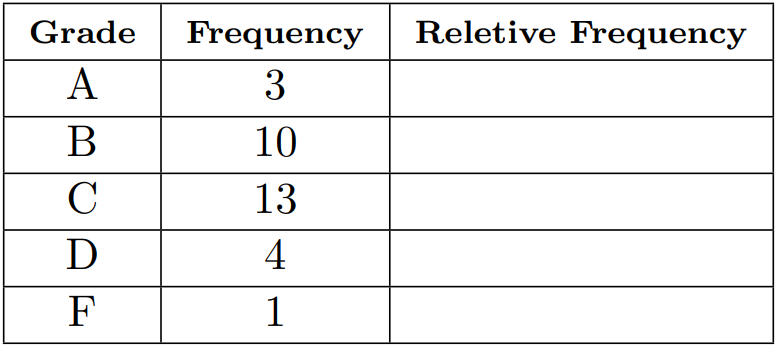
Relative frequency distribution
Divide the number in each category by the total number of observations
This gives us the proportion of units in each category
“What percentage of my sample is represented by this variable?”
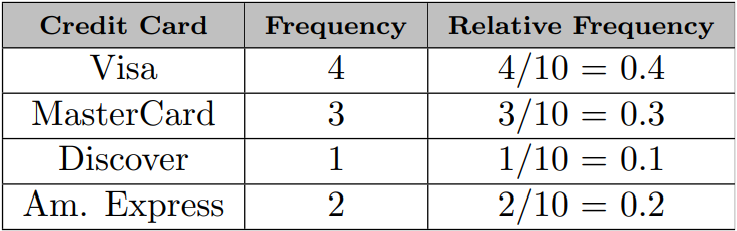
Count up how many times each variable occurs in the sample
For each variable, divide the occurrences of the variable by the sample total
\(4\) customers use Visa
\(10\) customers total in the sample
\({4 \over 10}=0.4\)
\(0.4*100\%=40\%\)
How is this useful?
What percentage of the class drinks coffee?
What percentage of the class drinks tea?
Whats our sample?
Population?
What are the variables and variable types?
Bar Graphs
Graphs are prettier than tables
- Barely a subjective statement
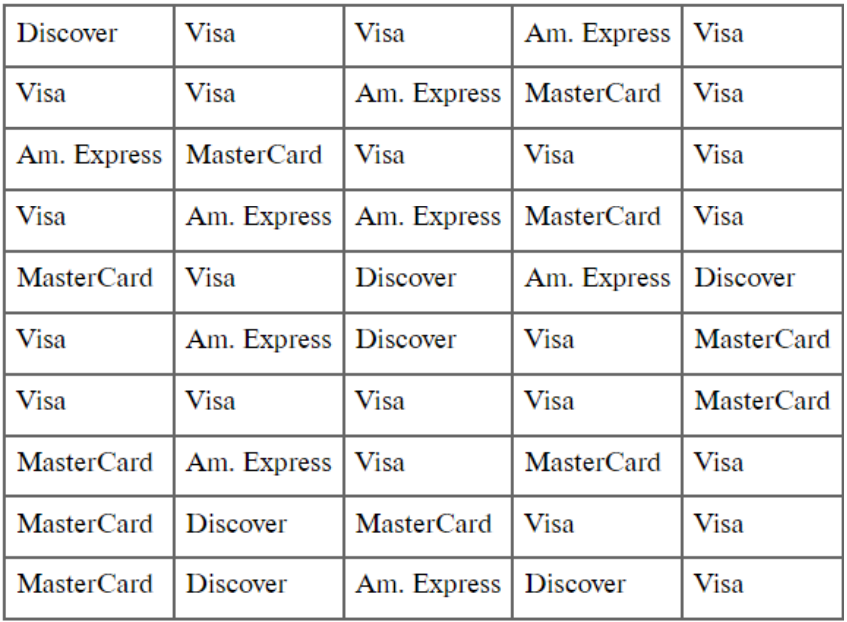
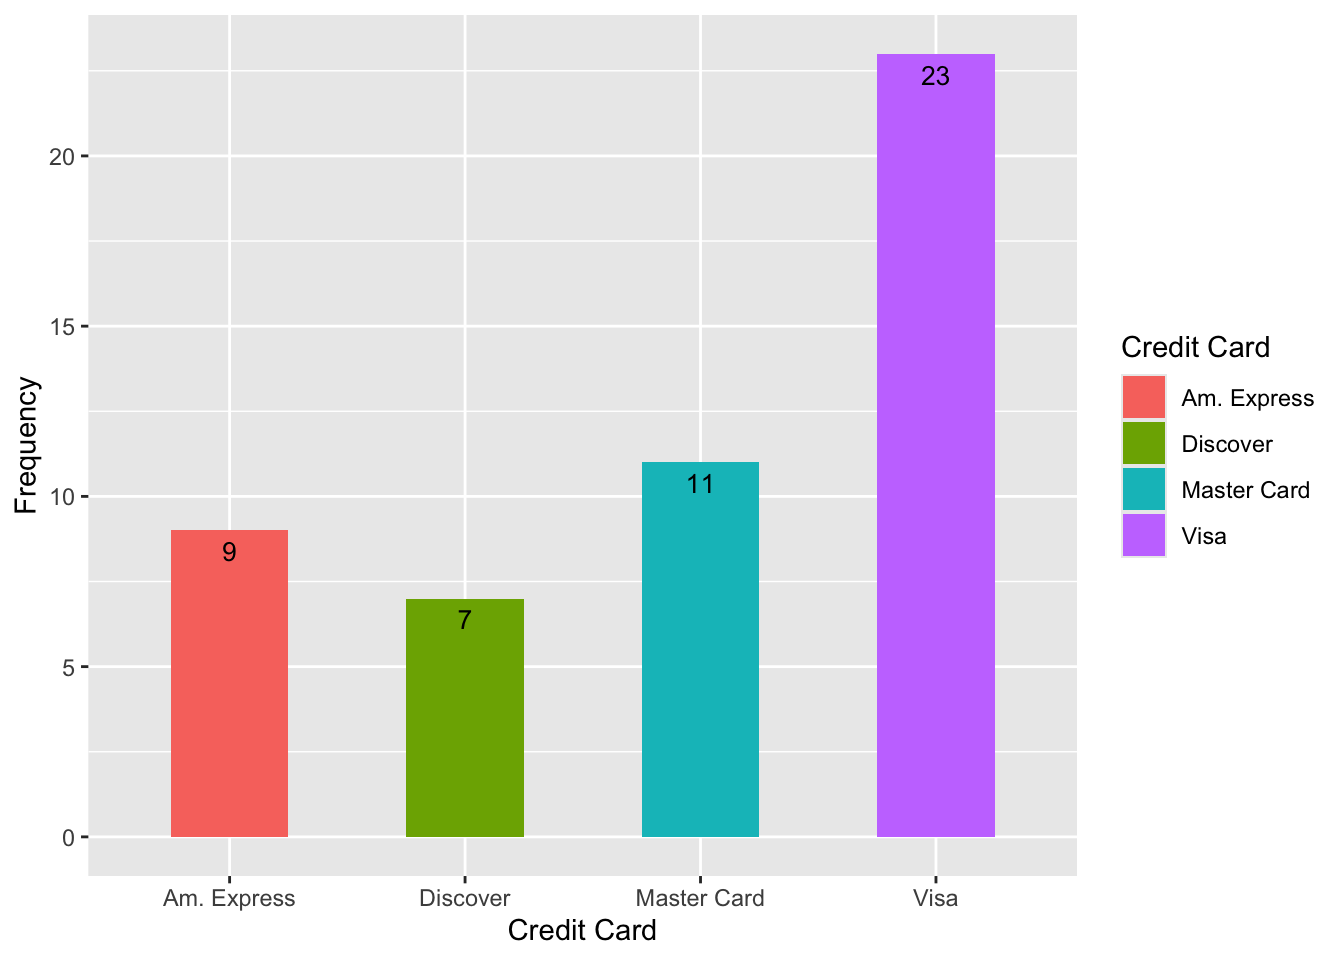
How many customers does this business lose if they stop taking Discover?
Take the frequency and relative frequency distributions:
| Credit Card | Frequency | Relative Frequency |
|---|---|---|
| Master Card | 11 | 0.22 |
| Visa | 23 | 0.46 |
| Am. Express | 9 | 0.18 |
| Discover | 7 | 0.14 |
One or more categorical variables
- So we use a bar graph

- We can make a bar graph using relative frequency too
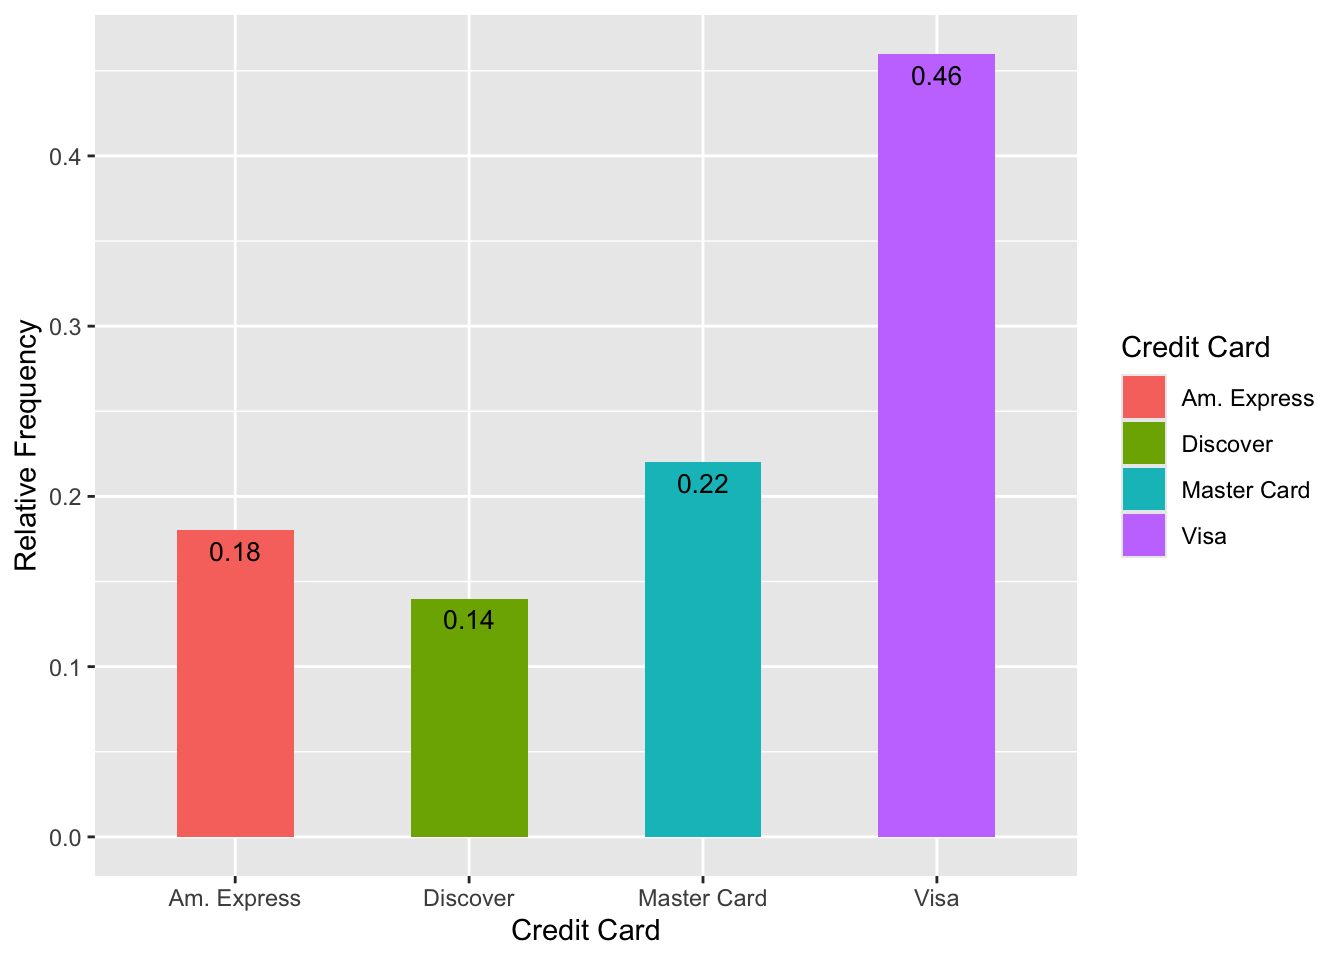
- We can also just flip this horizontal
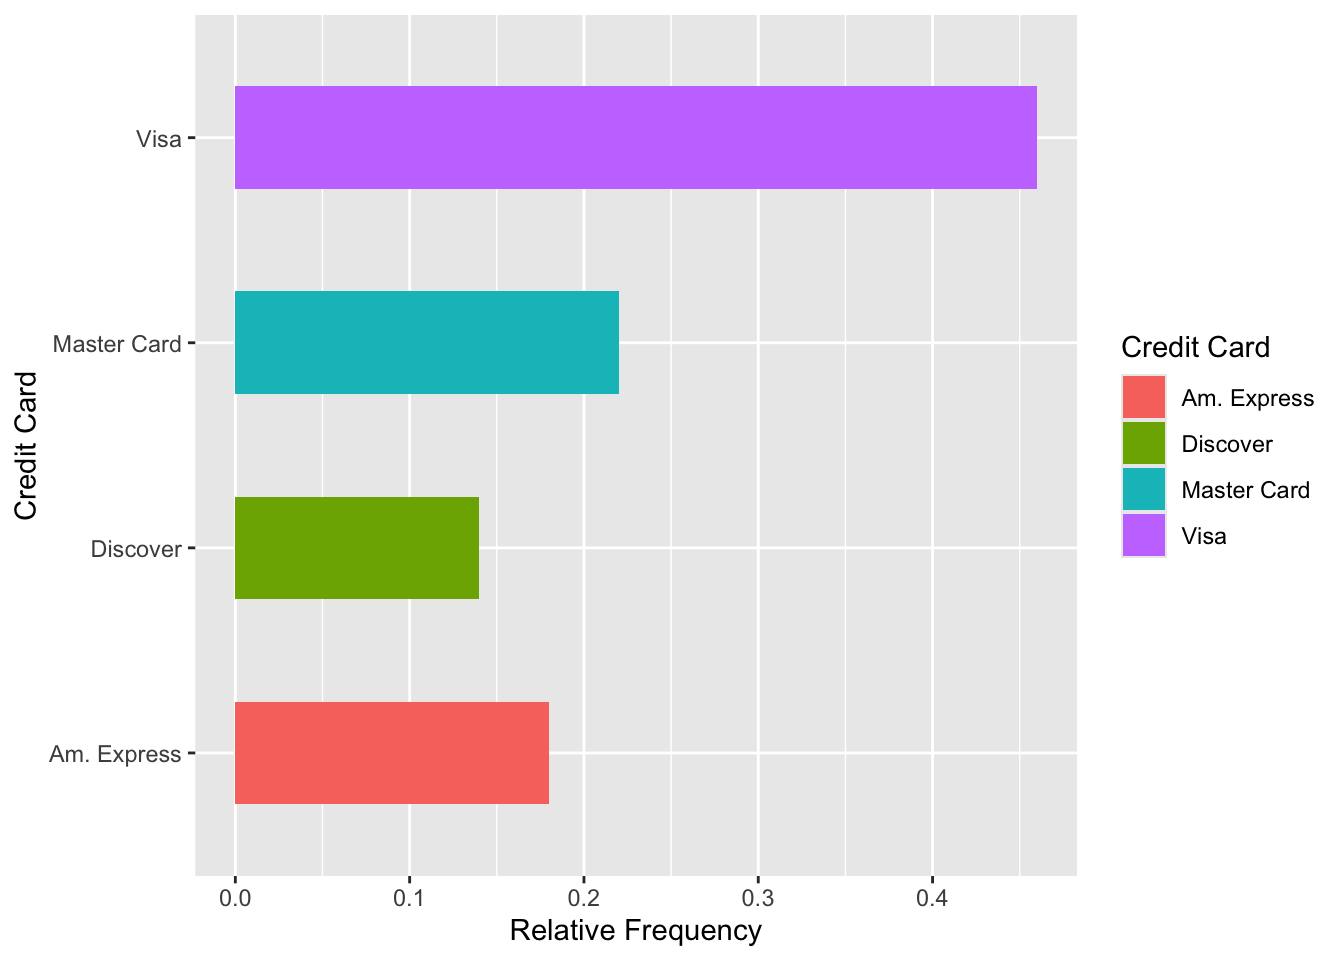
This is useful for when you have longer category names
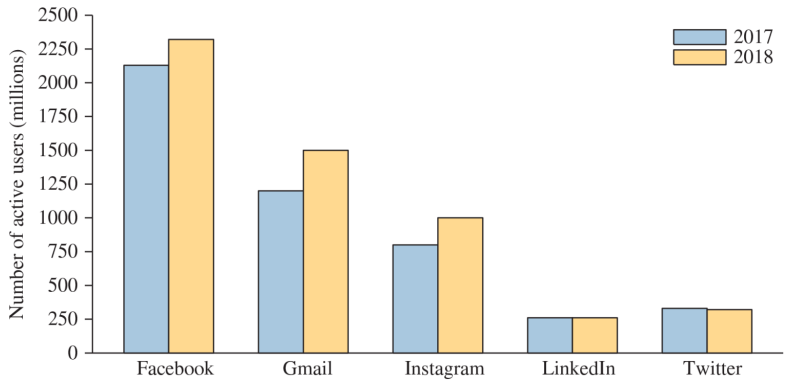
Side-by-side bar graphs can be used to compare two or more categorical variables with the same categories
Pie Charts
- Bar graphs showing frequency can be converted into pie charts
Generally a pie chart will show relative frequency
- “What’s my piece of the pie?”
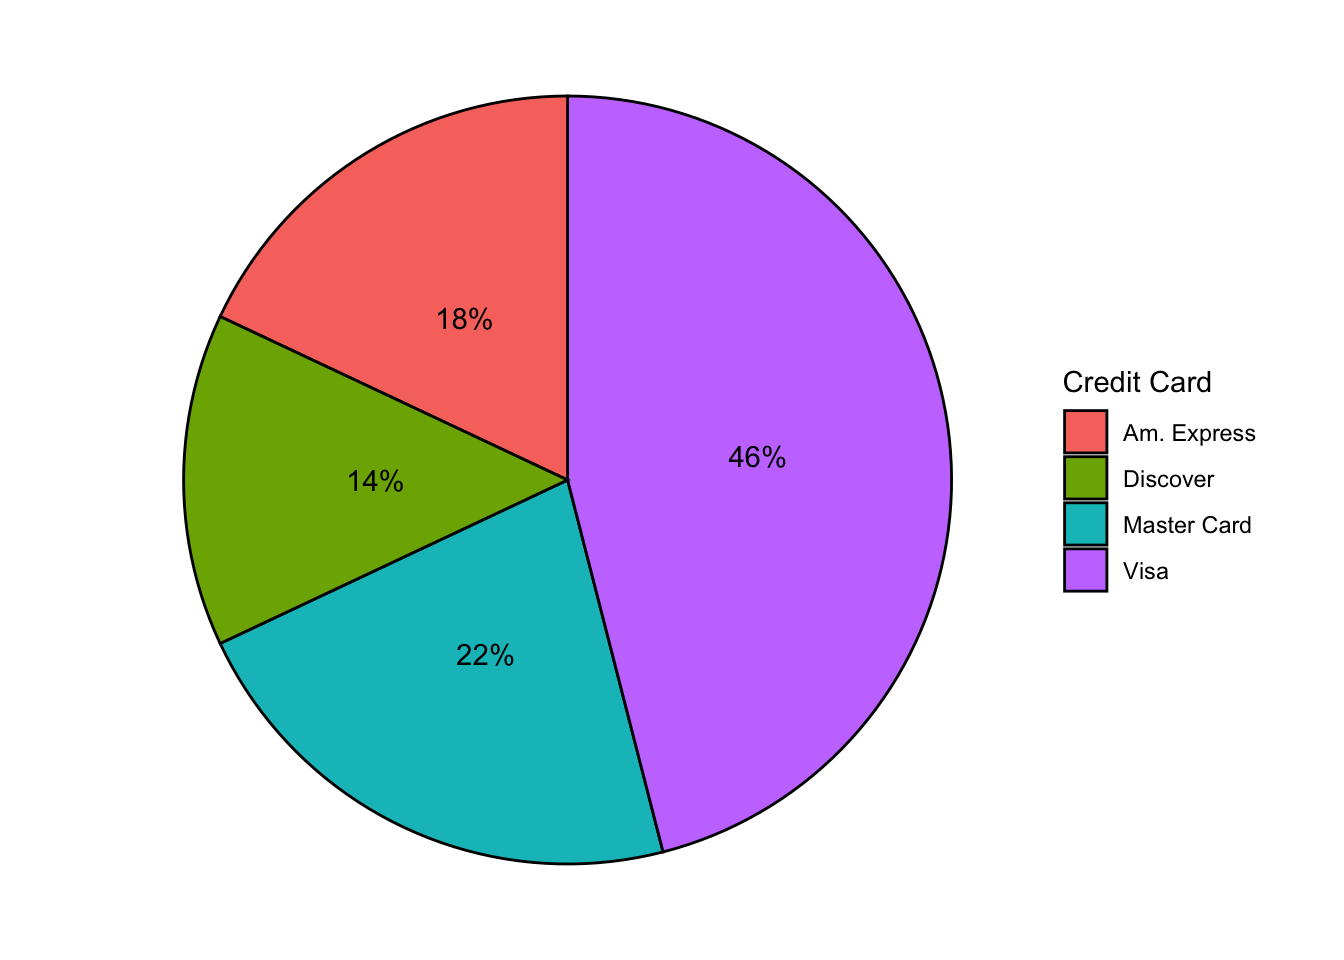
They’re very pretty
Not very useful
Interpretability is everything
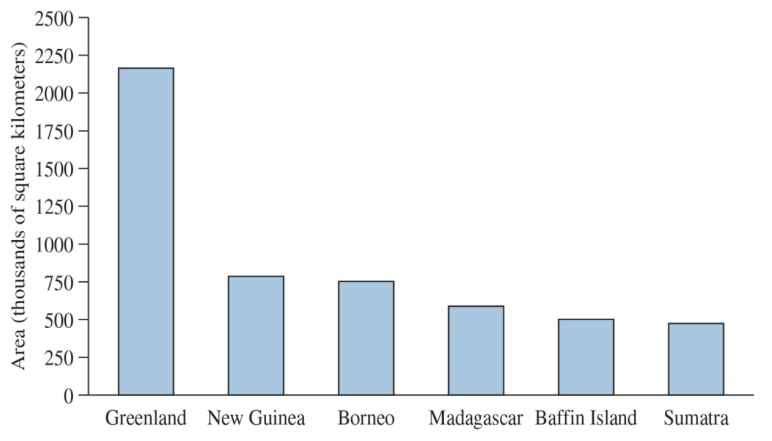
Approximately how large is Borneo?
Approximately how much larger is New Guinea than Sumatra
Someone says that Madagascar and Baffin Island together are larger than New Guinea:
- Is this correct?