Chapter 5 練就基礎統計數感續談分配二部曲
5.1 盒型圖
盒型圖的原文是「box and whiskers plot」,原作者是John Tukey。請看作者摘錄自維基百科的這一段歷史紀錄:
The range-bar was introduced by Mary Eleanor Spear in 1952 and again in 1969. The box and whiskers plot was first introduced in 1970 by John Tukey, who later published on the subject in 1977.
1977年,John Tukey出版了一本巨著Exploratory Data Analysis,他在書上介紹了不少幫助我們了解數據集(dataset)的工具,包括作者串起這一套微微書的「莖葉圖」。在正式介紹「盒型圖」之前,作者想先回答這一個問題:
為什麼把「盒型圖」放在「數感」而不是「圖感」呢?
因為基本上,「盒型圖」用幾何的基本元素「點、線、面」示意幾個重要統計量的關係,也因此推估出分配的其他特徵,跟其他「統計圖」比起來,較特別的是「盒型圖」在圖形的上下端,或是左右端清楚表達「可能的離群值」。這是市面上唯一這麼做的「統計圖」。經過超過40年的演進、演化,「盒型圖」有許多變種,請讀者諸君不要轉台繼續看下去。
…
5.1.1 認識盒型圖
5.1.1.1 準備數字
5.1.1.1.1 第一個數字:第一個四分位數或是比第一個四分位數小的最大值
Q1 <- quantile(0:9, probs = 0.25)
Q1
## 25%
## 2.25LOWfence <- max((0:9)[Q1 - (0:9) >= 0])
LOWfence## [1] 25.1.1.1.3 第三個數字:第三個四分位數或是比第三個四分位數大的最小值
Q3 <- quantile(0:9, probs = 0.75)
Q3
## 75%
## 6.75UPfence <- min((0:9)[(0:9) - Q3 >= 0])
UPfence## [1] 75.1.1.1.5 第五個數字:比第一個四分位數減去1.5倍的IQR大的最小值
Q1 <- quantile(0:9, probs = 0.25)
LOWcut <- Q1 - 1.5 * IQR(0:9)
LOWwhisker <- min((0:9)[(0:9) - LOWcut >= 0])
LOWwhisker
## [1] 05.1.1.2 作圖
有了數字,就可以開始畫圖了。
p <- boxplot(0:9)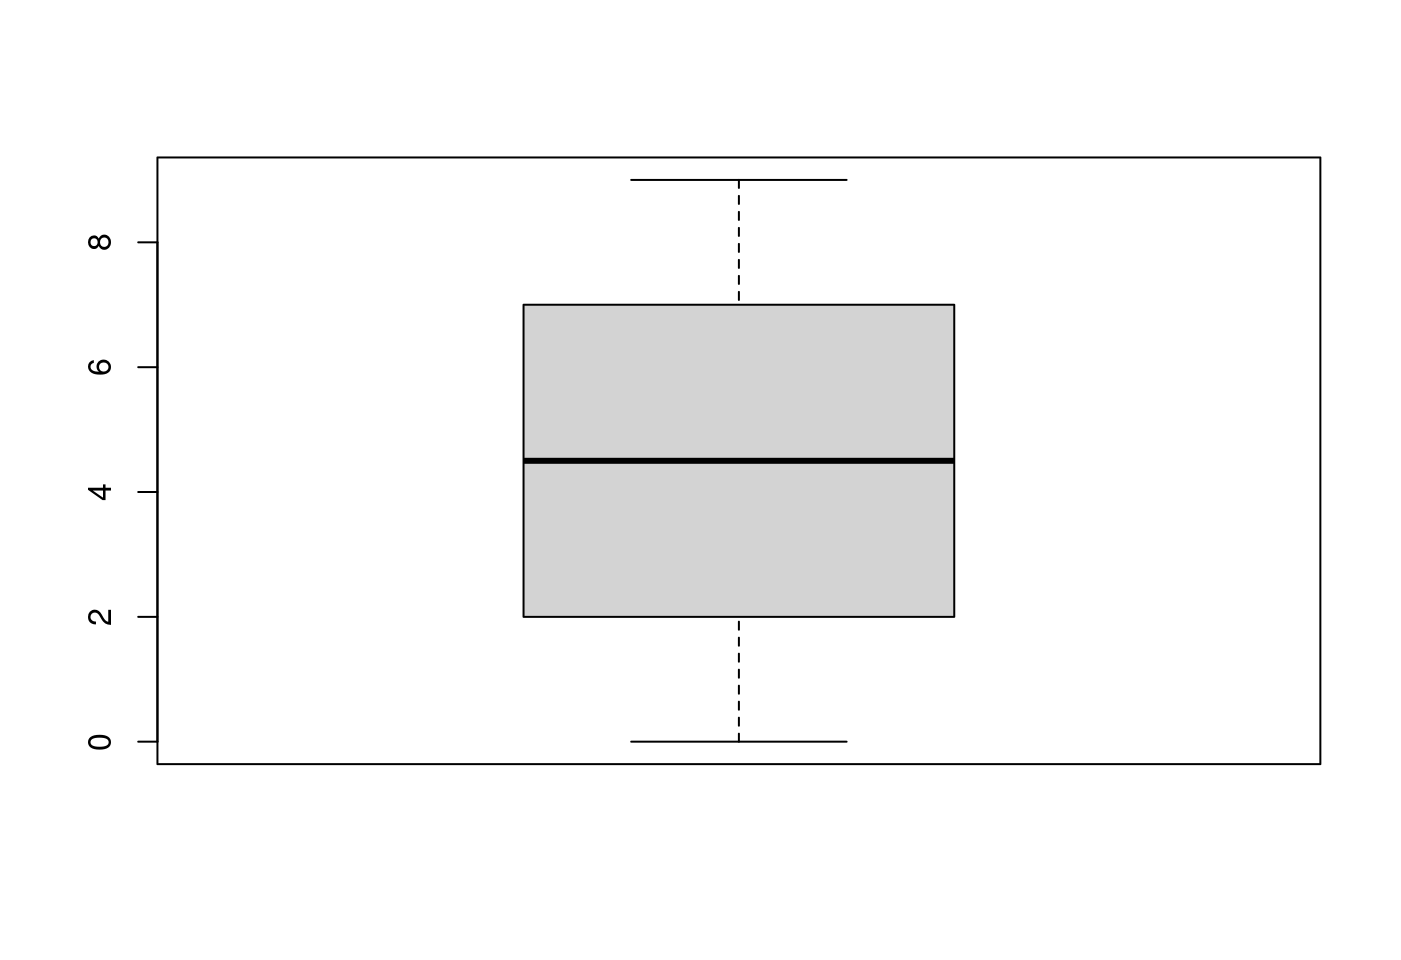
p$stats## [,1]
## [1,] 0.0
## [2,] 2.0
## [3,] 4.5
## [4,] 7.0
## [5,] 9.05.1.1.2.1 p$stats到底是什麼意思?
BOXstats <- data.frame(p$stats)
BOXstats
## p.stats
## 1 0.0
## 2 2.0
## 3 4.5
## 4 7.0
## 5 9.0rownames(BOXstats) <- c("下鬚","下牆","中位數","上牆","上鬚")
BOXstats## p.stats
## 下鬚 0.0
## 下牆 2.0
## 中位數 4.5
## 上牆 7.0
## 上鬚 9.05.1.1.2.2 來自boxplot.stats的stats
boxplot.stats(0:9)$stats## [1] 0.0 2.0 4.5 7.0 9.0c(LOWwhisker, LOWfence, Q2, UPfence, UPwhisker)## 50%
## 0.0 2.0 4.5 7.0 9.0c(LOWwhisker, Q1, Q2, Q3, UPwhisker)## 25% 50% 75%
## 0.00 2.25 4.50 6.75 9.00看起來,R官方函式,boxplot跟boxplot.stats提供的stats跟作者的第一版程式碼的結果「不謀而合」,但真的是這樣嗎?作者有這麼幸運嗎?無論如何,作者都想再試過一次,看看是不是真的這麼幸運?
5.1.1.3 測試作者提供的程式碼看看是否可以得到boxplot.stats提供的stats
首次嘗試,發現錯了一個,應該說有一個跟boxplot.stats的答案不一樣,「上牆」不一樣,而且是兩個版本都不一樣,不論是「四分位數版」還是「非四分位數版」。所以,決定還是細看一次,甚至多次官方使用手冊。記住,每一次遇到困難,查遍網路就是「無人解答」,那就是要走最後一條路:官方使用手冊。
knitr::include_url("https://www.rdocumentation.org/packages/grDevices/versions/3.6.2/topics/boxplot.stats")請看「Details」。當作者看到
The two ‘hinges’ are versions of the first and third quartile, i.e., close to
quantile(x, c(1,3)/4). The hinges equal the quartiles for odd (wheren <- length(x)) and differ for even. Whereas the quartiles only equal observations forn %% 4 == 1, the hinges do so additionally forn %% 4 == 2, and are in the middle of two observations otherwise.
再加上,
x <- airquality$Ozone
x <- x[!is.na(x)]
sort(x)
## [1] 1 4 6 7 7 7 8 9 9 9 10 11 11 11 12 12 13 13
## [19] 13 13 14 14 14 14 16 16 16 16 18 18 18 18 19 20 20 20
## [37] 20 21 21 21 21 22 23 23 23 23 23 23 24 24 27 28 28 28
## [55] 29 30 30 31 32 32 32 34 35 35 36 36 37 37 39 39 40 41
## [73] 44 44 44 45 45 46 47 48 49 50 52 59 59 61 63 64 64 65
## [91] 66 71 73 73 76 77 78 78 79 80 82 84 85 85 89 91 96 97
## [109] 97 108 110 115 118 122 135 168看到數據集裡出現「63 64 64」,作者意識到,也想起來,計算「四分位數」的方法不只一種。請看以下網頁的「Types」橋段:
knitr::include_url("https://www.rdocumentation.org/packages/stats/versions/3.6.2/topics/quantile")比如說,這一組數據集「airquality$Ozone」的第三個四分位數位在「63 64」之間,但是實際上數據集有兩個「64」,也就是「63 64 64」,所以「Q3」至少有兩種算法:
(63 + 64)/2## [1] 63.563 + (64 - 63) * (1/(3+1))## [1] 63.25作者細看幾次「Types」橋段,決定用「第二種Type」試試。請看計算各個數字的修正程式碼:
5.1.1.3.1 計算必要的數字
- 計算「第一個四分位數」跟「最靠近第一個四分位數的觀察值」
Q1 <- quantile(x, probs = 0.25, na.rm = TRUE, type = 2)
Q1
## 25%
## 18LOWfence <- max(x[Q1 - x >= 0])
LOWfence## [1] 18- 計算「第二個四分位數」也就是「中位數」
Q2 <- quantile(x, probs = 0.50, na.rm = TRUE, type = 2)
Q2
## 50%
## 31.5- 計算「第三個四分位數」跟「最靠近第三個四分位數的觀察值」
Q3 <- quantile(x, probs = 0.75, na.rm = TRUE, type = 2)
Q3
## 75%
## 63.5UPfence <- min(x[x - Q3 >= 0])
UPfence## [1] 64- 計算下鬚末端
LOWcut <- Q1 - 1.5 * IQR(x, na.rm = TRUE)
LOWwhisker <- min(x[x - LOWcut >= 0])
LOWwhisker
## [1] 1- 計算上鬚末端
UPcut <- Q3 + 1.5 * IQR(x, na.rm = TRUE)
UPwhisker <- max(x[UPcut - x >= 0])
UPwhisker
## [1] 122- 整理第一版的
FiveNumbers:非四分位數版
unname(c(LOWwhisker, LOWfence, Q2, UPfence, UPwhisker))## [1] 1.0 18.0 31.5 64.0 122.0- 整理第二版的
FiveNumbers:四分位數版
unname(c(LOWwhisker, Q1, Q2, Q3, UPwhisker))## [1] 1.0 18.0 31.5 63.5 122.0boxplot.stats給的FiveNumbers:R官方版
boxplot.stats(x)$stats## [1] 1.0 18.0 31.5 63.5 122.05.1.1.3.3 畫圖了
boxplot(x,
        horizontal = TRUE,
        axes = FALSE,
        staplewex = 1)
text(x = unname(c(LOWwhisker, Q1, Q2, Q3, UPwhisker)),
     labels = unname(c(LOWwhisker, Q1, Q2, Q3, UPwhisker)),
     y = 1.25)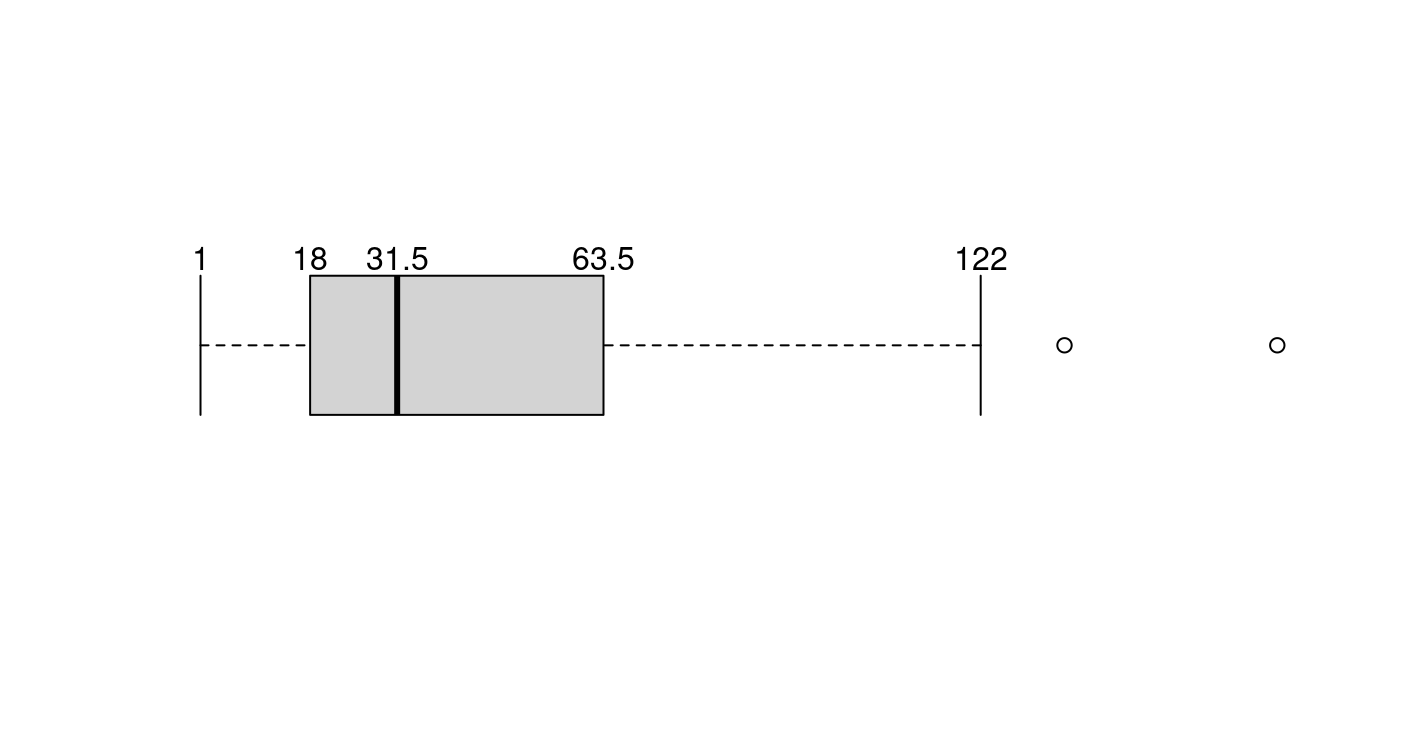
5.1.1.3.4 再加上離群值
boxplot(x,
        horizontal = TRUE,
        axes = FALSE,
        staplewex = 1)
text(x = unname(c(LOWwhisker, Q1, Q2, Q3, UPwhisker)),
     labels = unname(c(LOWwhisker, Q1, Q2, Q3, UPwhisker)),
     y = 1.25,
     col = "blue")
text(x = x[which(x > UPwhisker)],
     labels = x[which(x > UPwhisker)],
     y = 1.25,
     col = "red")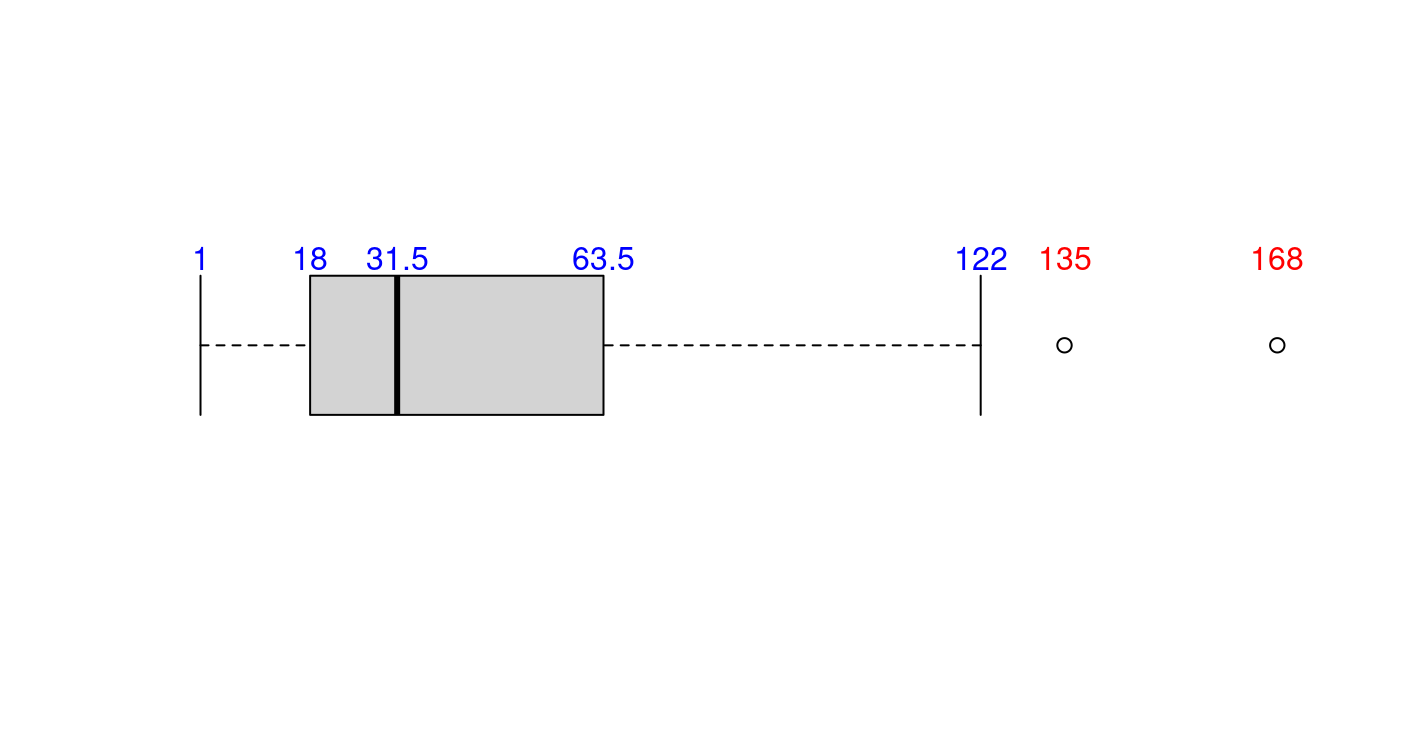
5.1.2 盒型圖的官方案例
5.1.2.1 第一爆
## boxplot on a formula:
boxplot(count ~ spray,
        data = InsectSprays,
        col = "lightgray")
# *add* notches (somewhat funny here <--> warning "notches .. outside hinges"):
boxplot(count ~ spray,
        data = InsectSprays,
        notch = TRUE,
        add = TRUE,
        col = "blue")
## Warning in (function (z, notch = FALSE, width = NULL, varwidth = FALSE, :
## 一些槽在折葉點外('box'): 可能是因為 notch=FALSE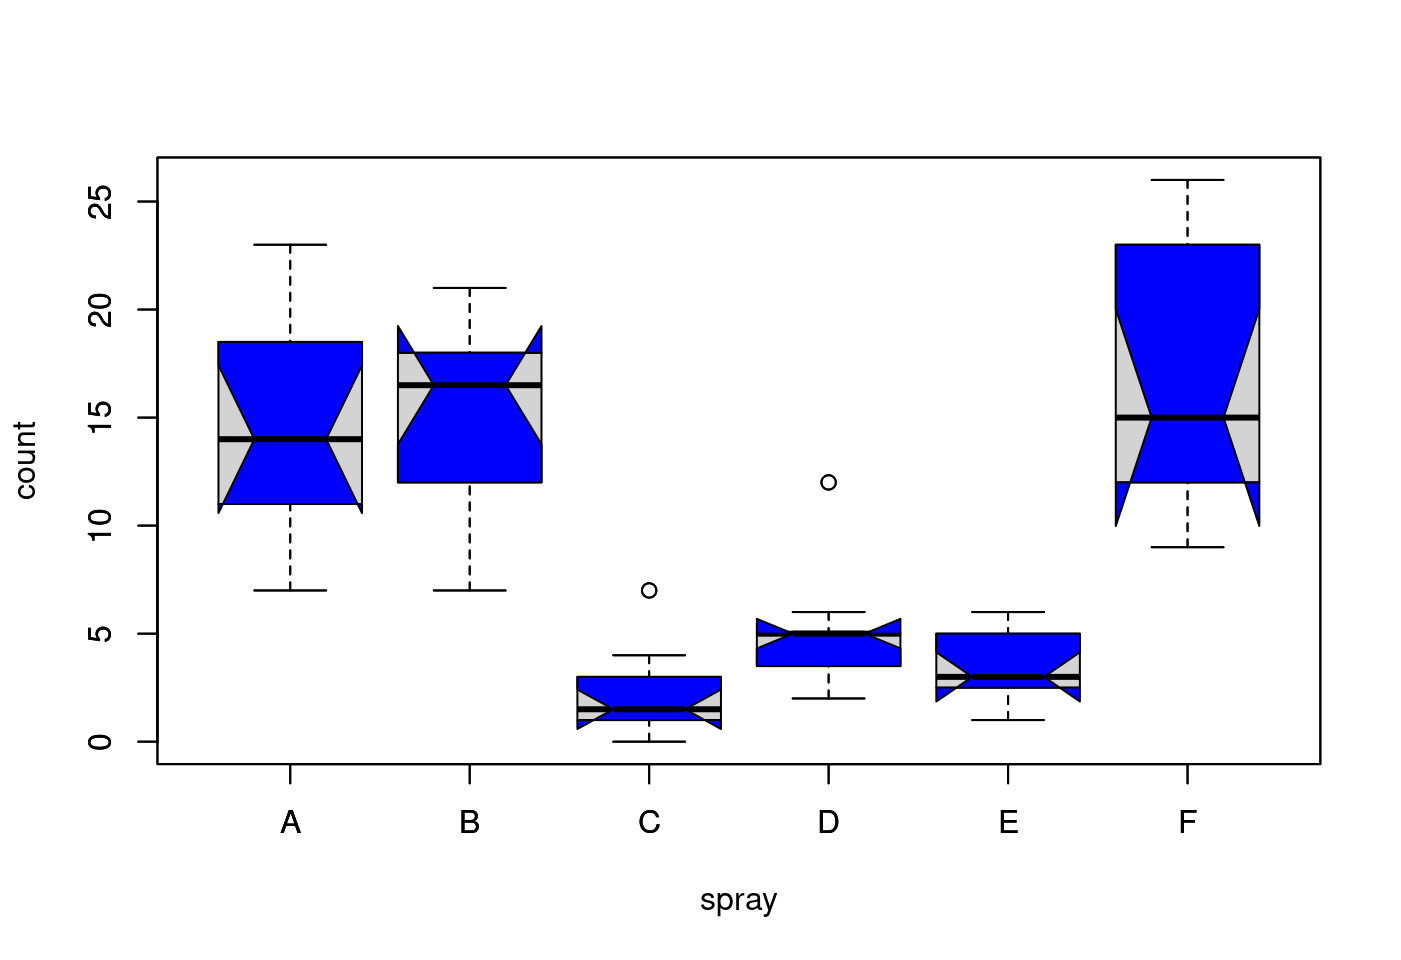
5.1.2.2 第二爆
boxplot(decrease ~ treatment,
        data = OrchardSprays,
        col = "bisque",
        log = "y",
        xlab = "treatment",
        ylab = "decrease")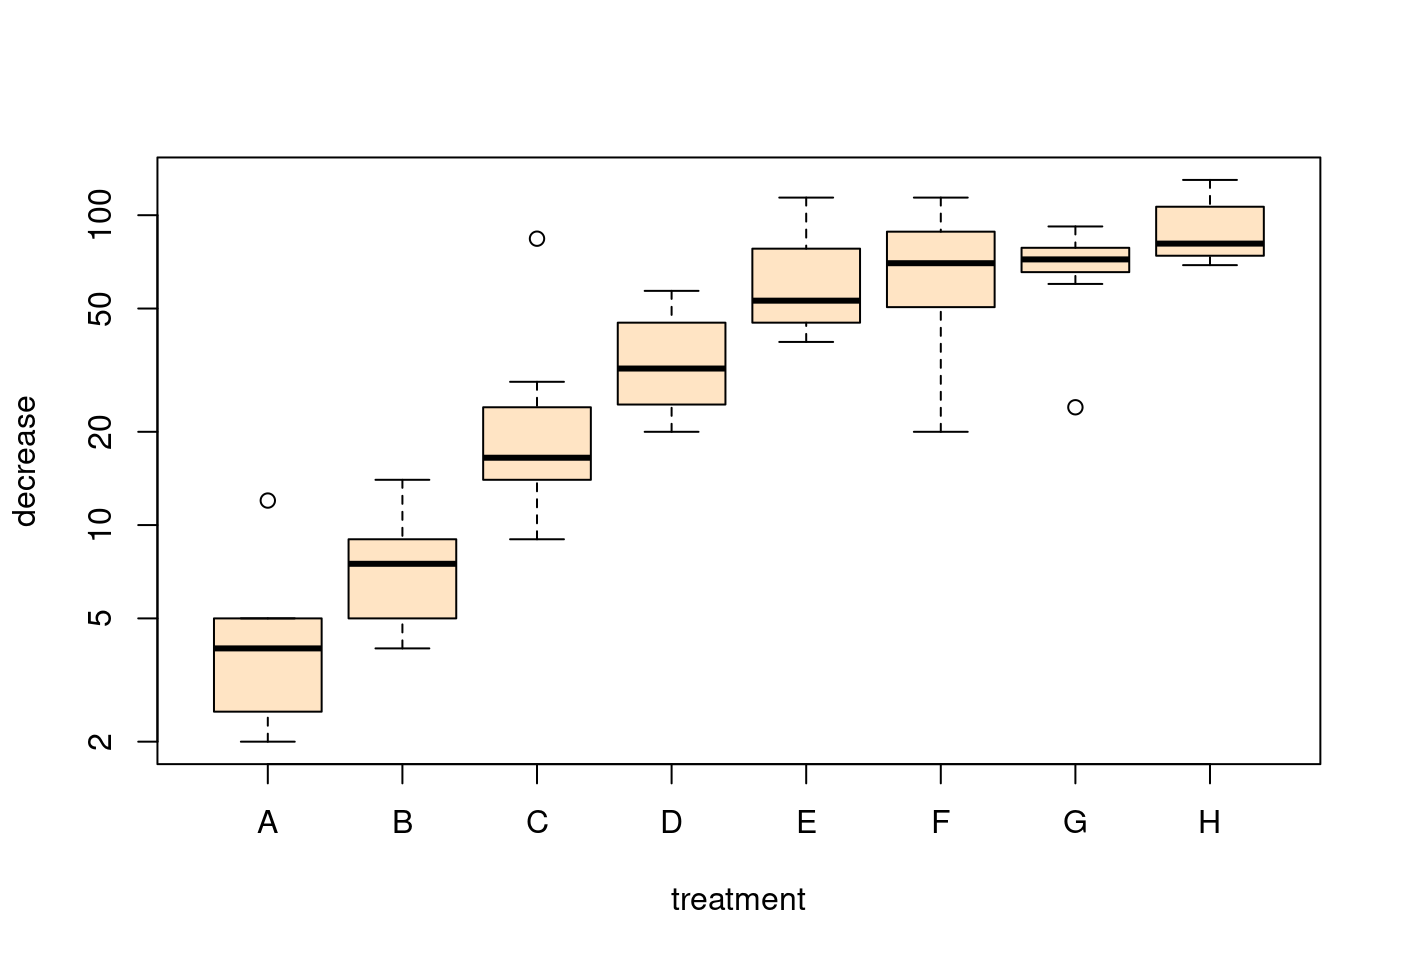
## horizontal=TRUE, switching  y <--> x :
boxplot(decrease ~ treatment,
        data = OrchardSprays,
        col = "bisque",
        log = "x",
        horizontal=TRUE,
        xlab = "decrease",
        ylab = "treatment")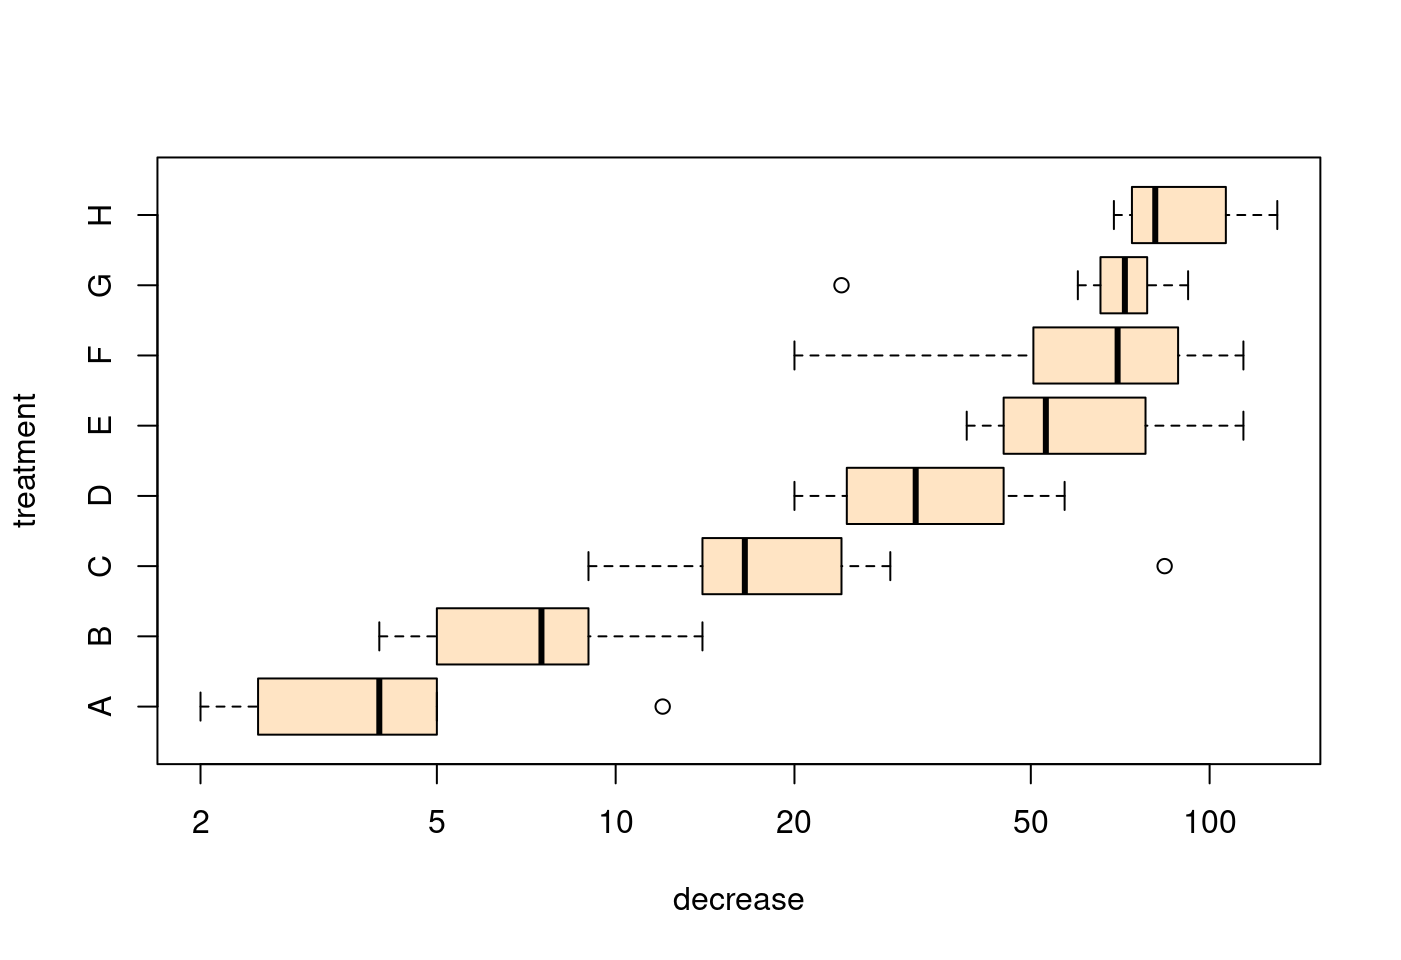
5.1.2.3 第三爆
rb <- boxplot(decrease ~ treatment,
              data = OrchardSprays,
              col = "bisque")
title("Comparing boxplot()s and non-robust mean +/- SD")
mn.t <- tapply(OrchardSprays$decrease, OrchardSprays$treatment, mean)
sd.t <- tapply(OrchardSprays$decrease, OrchardSprays$treatment, sd)
xi <- 0.3 + seq(rb$n)
points(xi, mn.t,
       col = "orange",
       pch = 18)
arrows(xi, mn.t - sd.t, xi, mn.t + sd.t,
       code = 3,
       col = "blue",
       angle = 75,
       length = .1)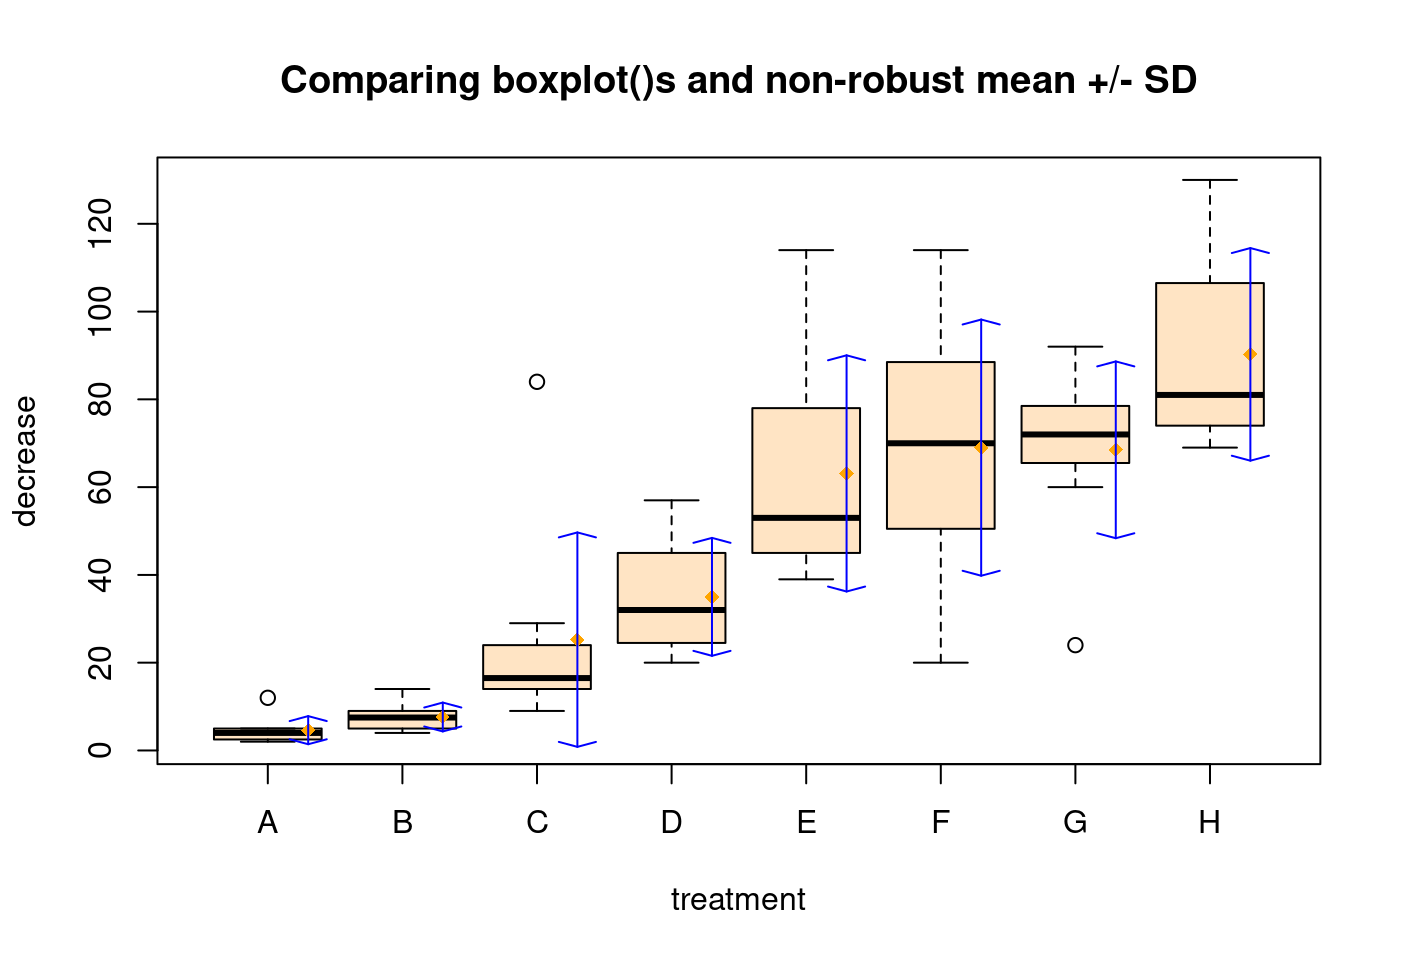
5.1.2.4 第四爆
## boxplot on a matrix:
mat <- cbind(Uni05 = (1:100)/21,
             Norm = rnorm(100),
             `5T` = rt(100, df = 5),
             Gam2 = rgamma(100, shape = 2))
boxplot(mat) # directly, calling boxplot.matrix()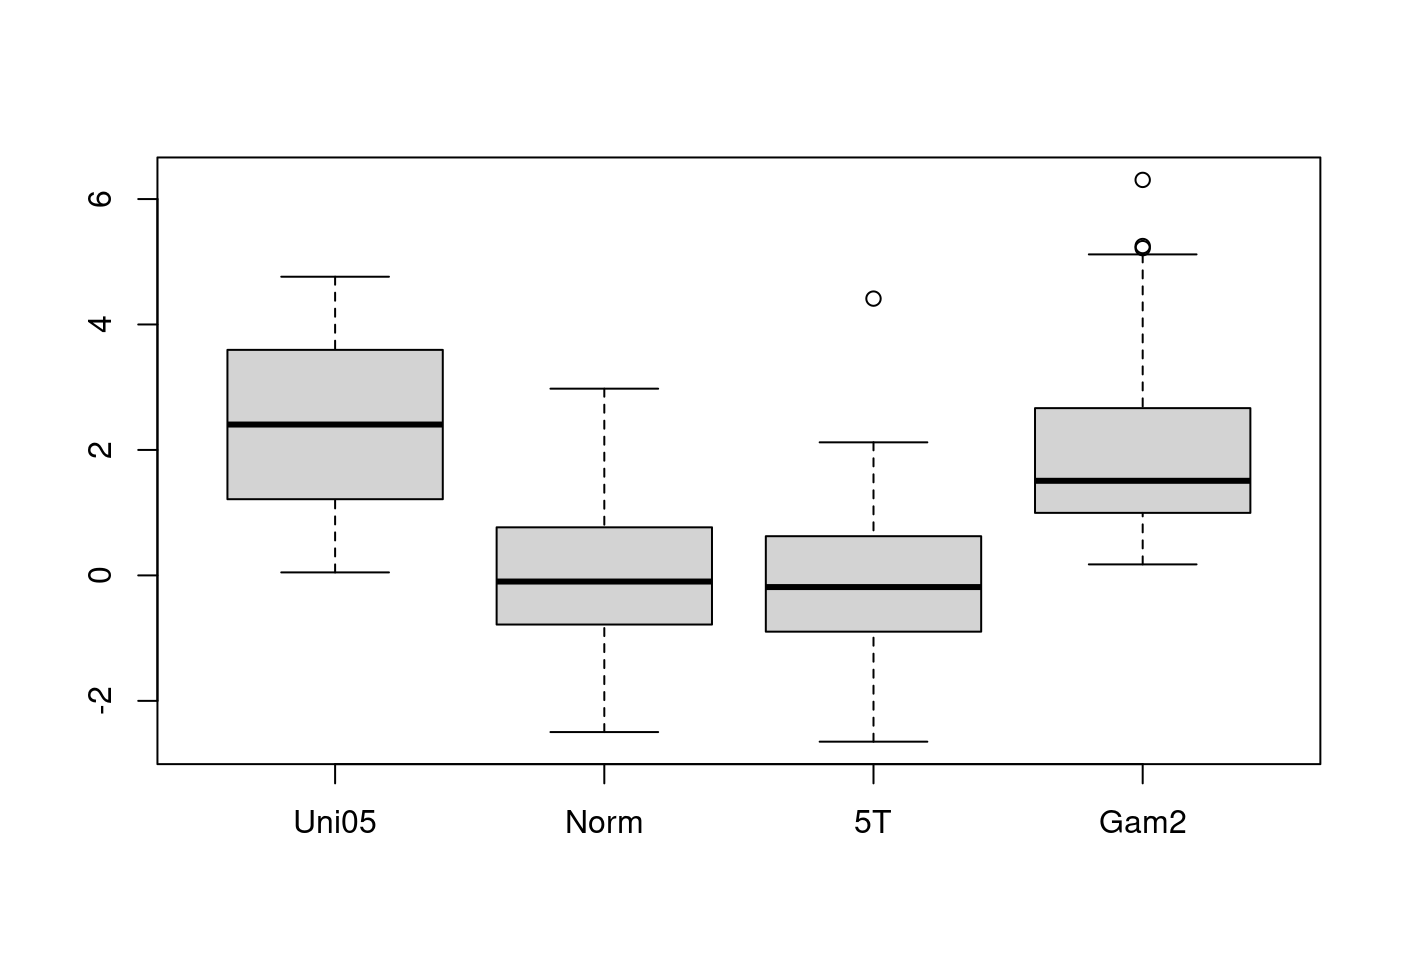
5.1.2.5 第五爆
## boxplot on a data frame:
df. <- as.data.frame(mat)
par(las = 1) # all axis labels horizontal
boxplot(df.,
        main = "boxplot(*, horizontal = TRUE)",
        horizontal = TRUE)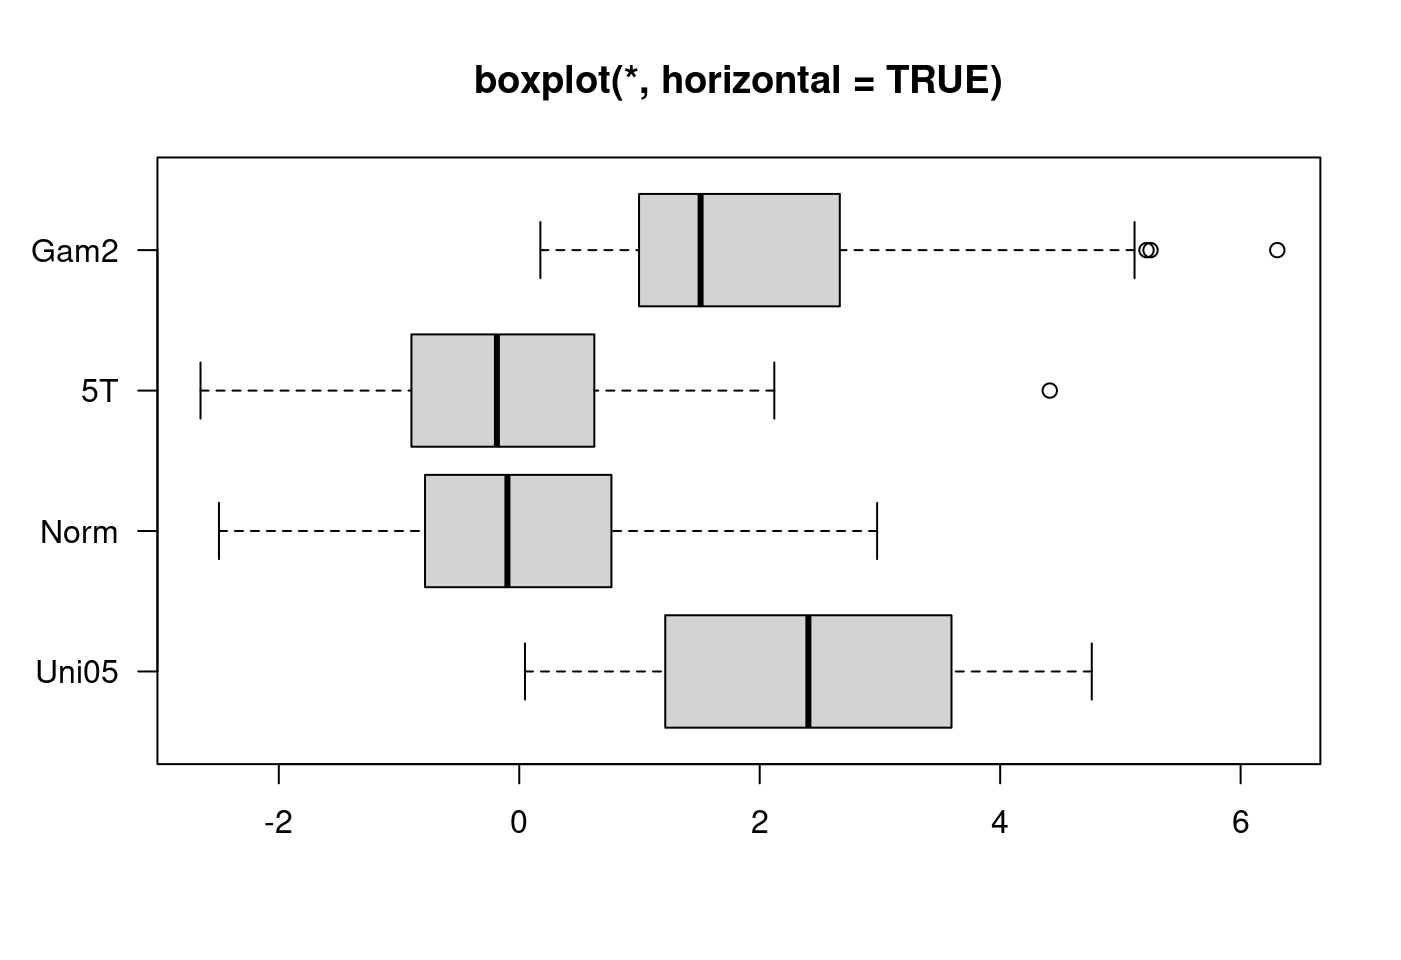
5.1.2.6 第六爆
## Using 'at = ' and adding boxplots -- example idea by Roger Bivand :
boxplot(len ~ dose,
        data = ToothGrowth,
        boxwex = 0.25,
        at = 1:3 - 0.2,
        subset = supp == "VC",
        col = "yellow",
        main = "Guinea Pigs' Tooth Growth",
        xlab = "Vitamin C dose mg",
        ylab = "tooth length",
        xlim = c(0.5, 3.5),
        ylim = c(0, 35),
        yaxs = "i")
boxplot(len ~ dose,
        data = ToothGrowth,
        add = TRUE,
        boxwex = 0.25,
        at = 1:3 + 0.2,
        subset = supp == "OJ",
        col = "orange")
legend(2, 9,
       c("Ascorbic acid", "Orange juice"),
       fill = c("yellow", "orange"))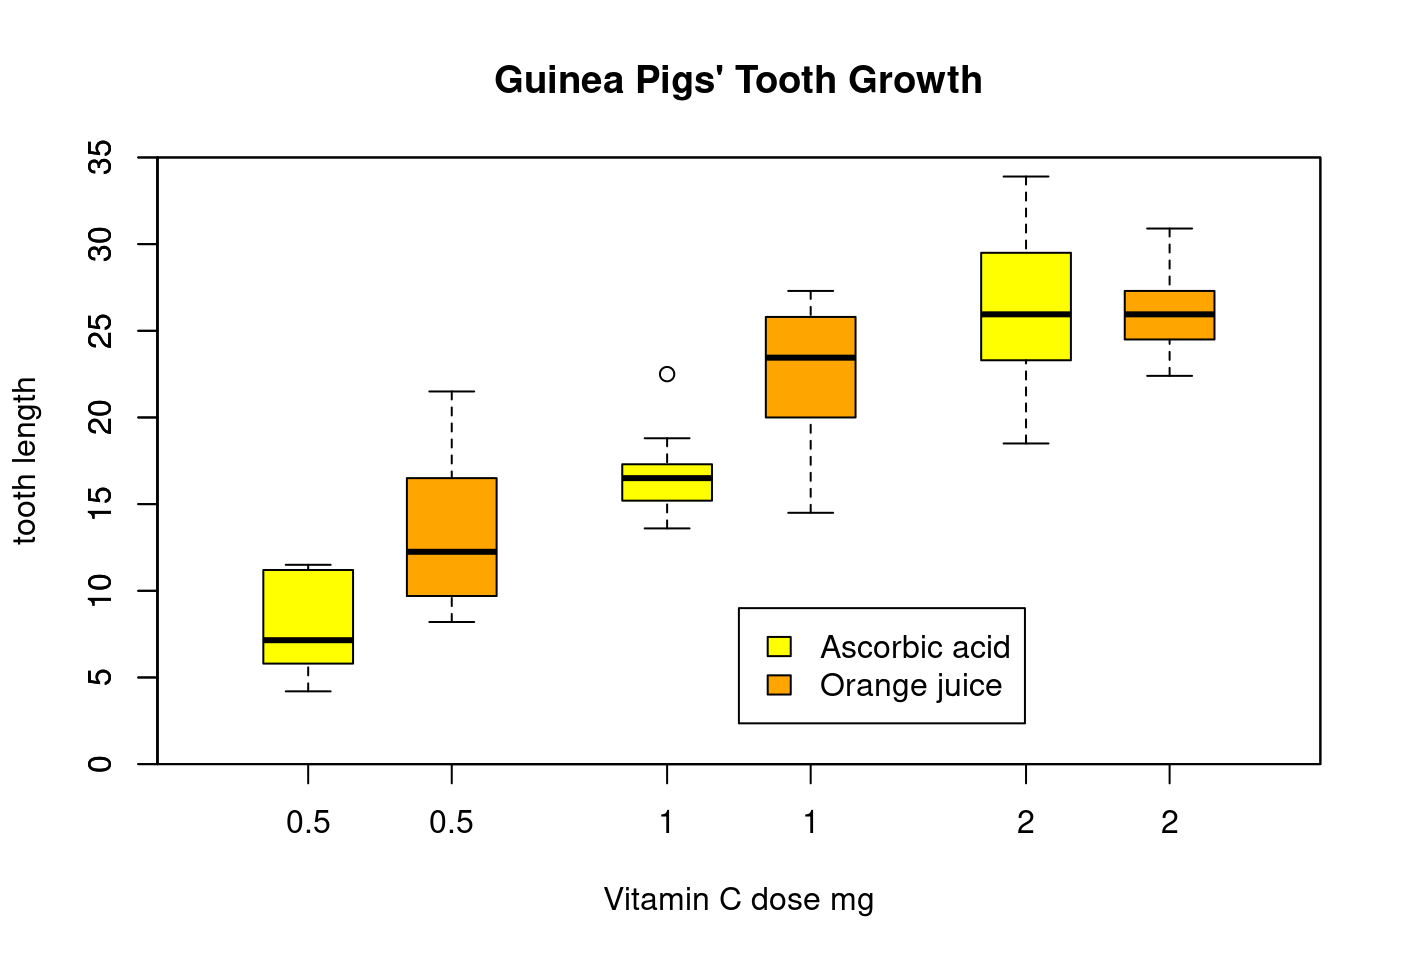
5.1.2.7 第七爆
## With less effort (slightly different) using factor *interaction*:
boxplot(len ~ dose:supp,
        data = ToothGrowth,
        boxwex = 0.5,
        col = c("orange", "yellow"),
        main = "Guinea Pigs' Tooth Growth",
        xlab = "Vitamin C dose mg",
        ylab = "tooth length",
        sep = ":",
        lex.order = TRUE,
        ylim = c(0, 35),
        yaxs = "i")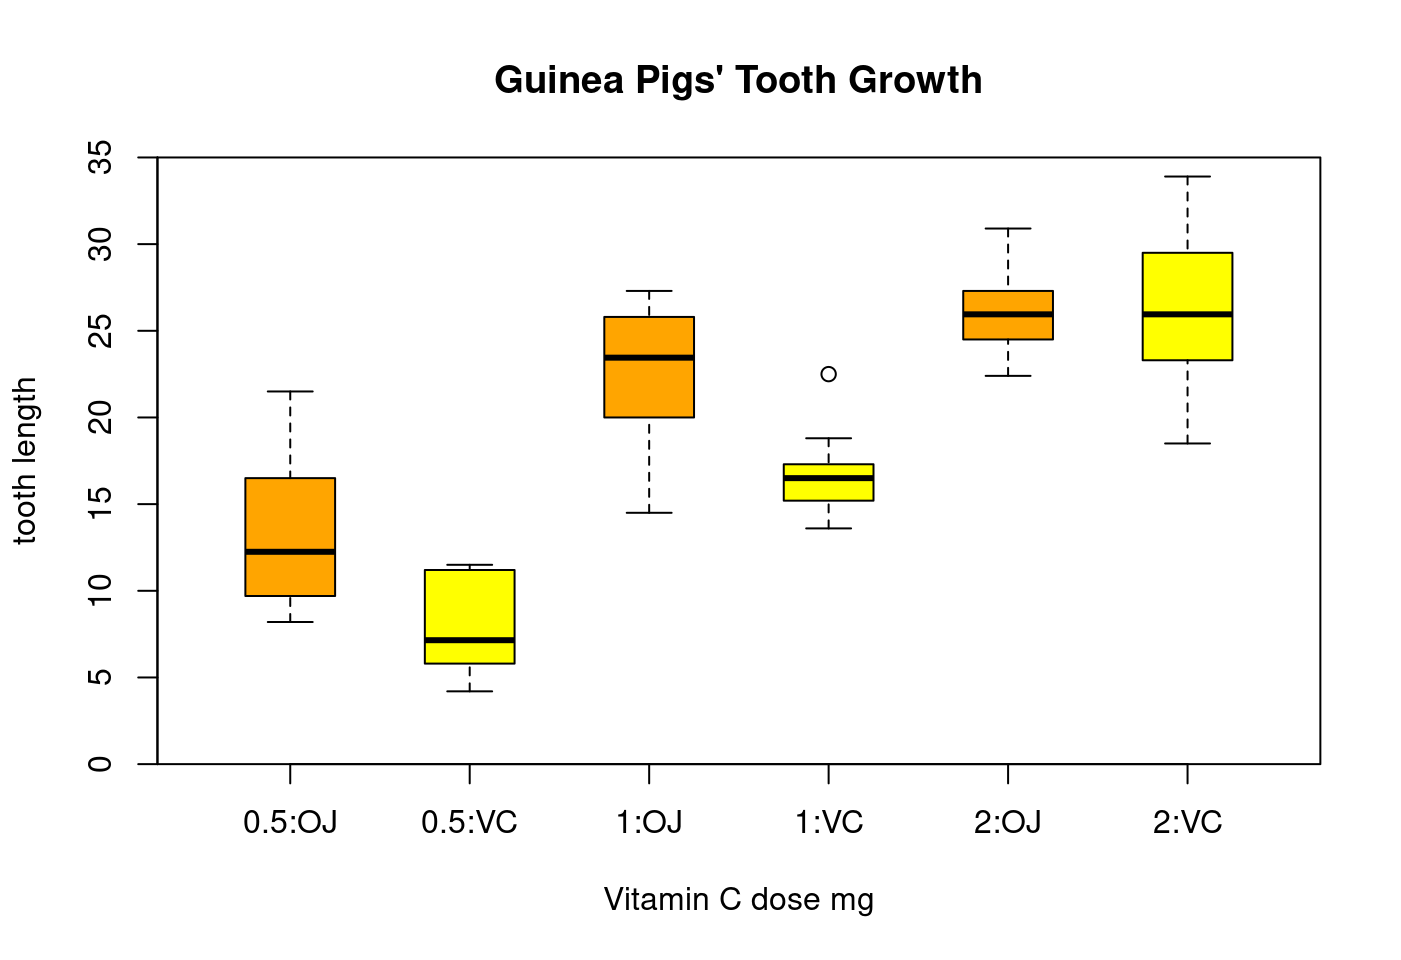
5.1.3 當盒型圖遇上其他統計圖
5.1.3.1 抓示範數據
library(ggplot2)
data(mpg)
head(mpg)
## # A tibble: 6 × 11
## manufacturer model displ year cyl trans drv cty hwy fl class
## <chr> <chr> <dbl> <int> <int> <chr> <chr> <int> <int> <chr> <chr>
## 1 audi a4 1.8 1999 4 auto(l5) f 18 29 p compa…
## 2 audi a4 1.8 1999 4 manual(m5) f 21 29 p compa…
## 3 audi a4 2 2008 4 manual(m6) f 20 31 p compa…
## 4 audi a4 2 2008 4 auto(av) f 21 30 p compa…
## 5 audi a4 2.8 1999 6 auto(l5) f 16 26 p compa…
## 6 audi a4 2.8 1999 6 manual(m5) f 18 26 p compa…5.1.3.2 只畫盒型圖
boxplot(mpg$hwy,
        horizontal = TRUE,
        ylim = c(10,50),
        xaxt = "n",
        col = rgb(0.8,0.8,0,0.5),
        frame = F)
text(x = boxplot.stats(mpg$hwy)$stats,
     labels = boxplot.stats(mpg$hwy)$stats,
     y = 1.25,
     col = "blue",
     cex = 0.8)
text(x = mpg$hwy[which(mpg$hwy>boxplot.stats(mpg$hwy)$stats[5])],
     labels = mpg$hwy[which(mpg$hwy>boxplot.stats(mpg$hwy)$stats[5])],
     y = 1.25,
     col = "red",
     cex = 0.8)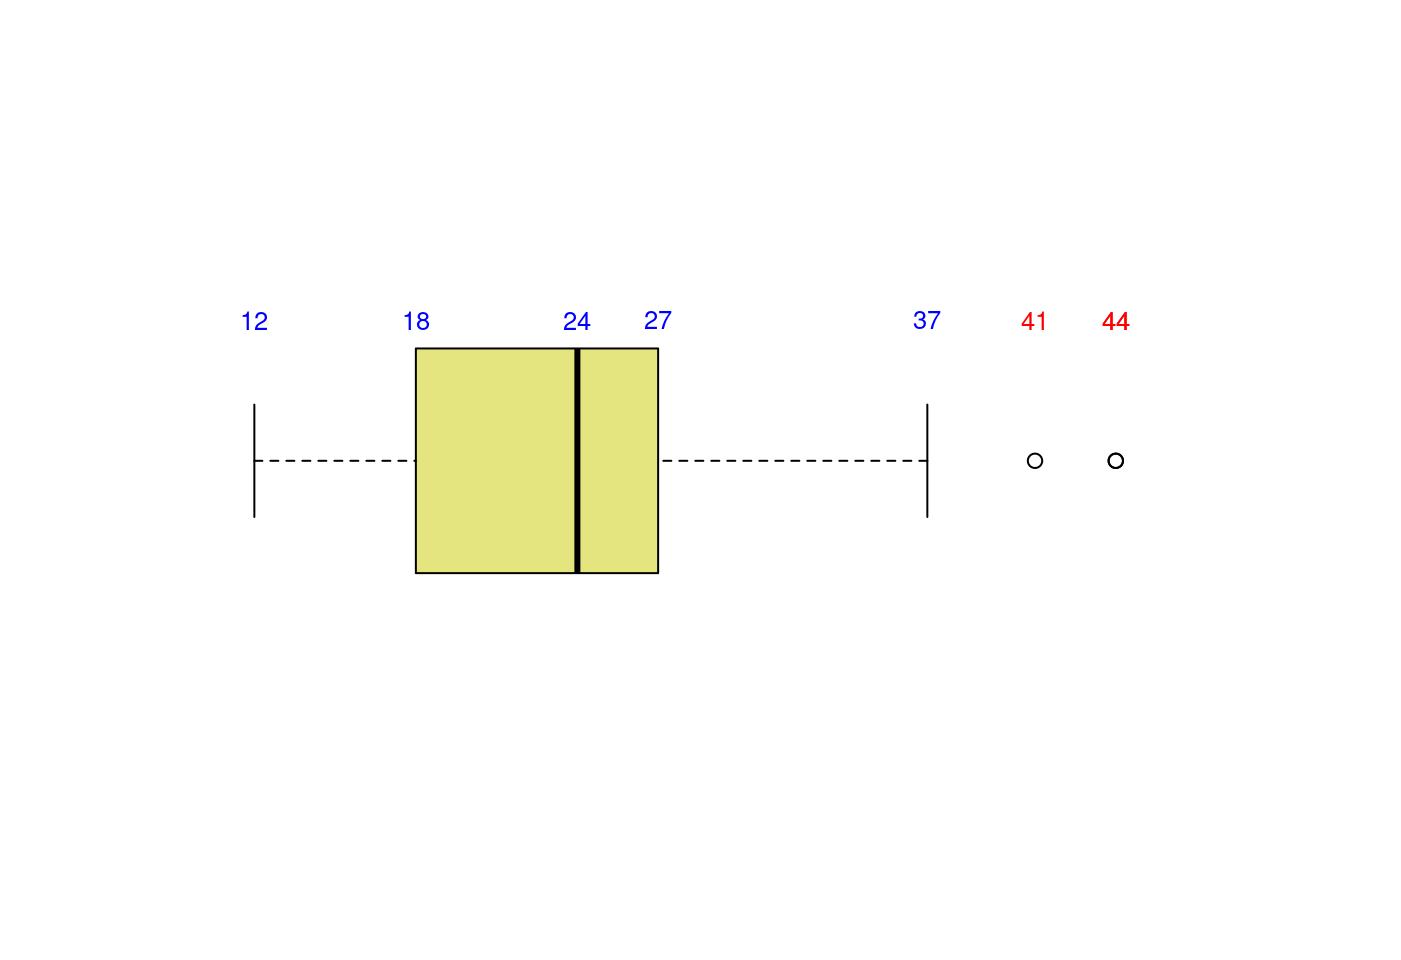
5.1.3.3 盒型圖加直方圖
# Layout to split the screen
layout(mat = matrix(c(1,2), 2, 1, byrow = TRUE), height = c(2,8))
## Error in layout.matrix(mat = matrix(c(1, 2), 2, 1, byrow = TRUE), height = c(2, : 缺少引數 "p",也沒有預設值# Draw the boxplot and the histogram
par(mar=c(0, 3.1, 1.1, 2.1))
boxplot(mpg$hwy,
horizontal = TRUE,
ylim = c(10,50),
xaxt = "n",
col = rgb(0.8,0.8,0,0.5),
frame = F)
text(x = boxplot.stats(mpg$hwy)$stats,
labels = boxplot.stats(mpg$hwy)$stats,
y = 1.35,
col = "blue",
cex = 0.8)
text(x = mpg$hwy[which(mpg$hwy>boxplot.stats(mpg$hwy)$stats[5])],
labels = mpg$hwy[which(mpg$hwy>boxplot.stats(mpg$hwy)$stats[5])],
y = 1.35,
col = "red",
cex = 0.8)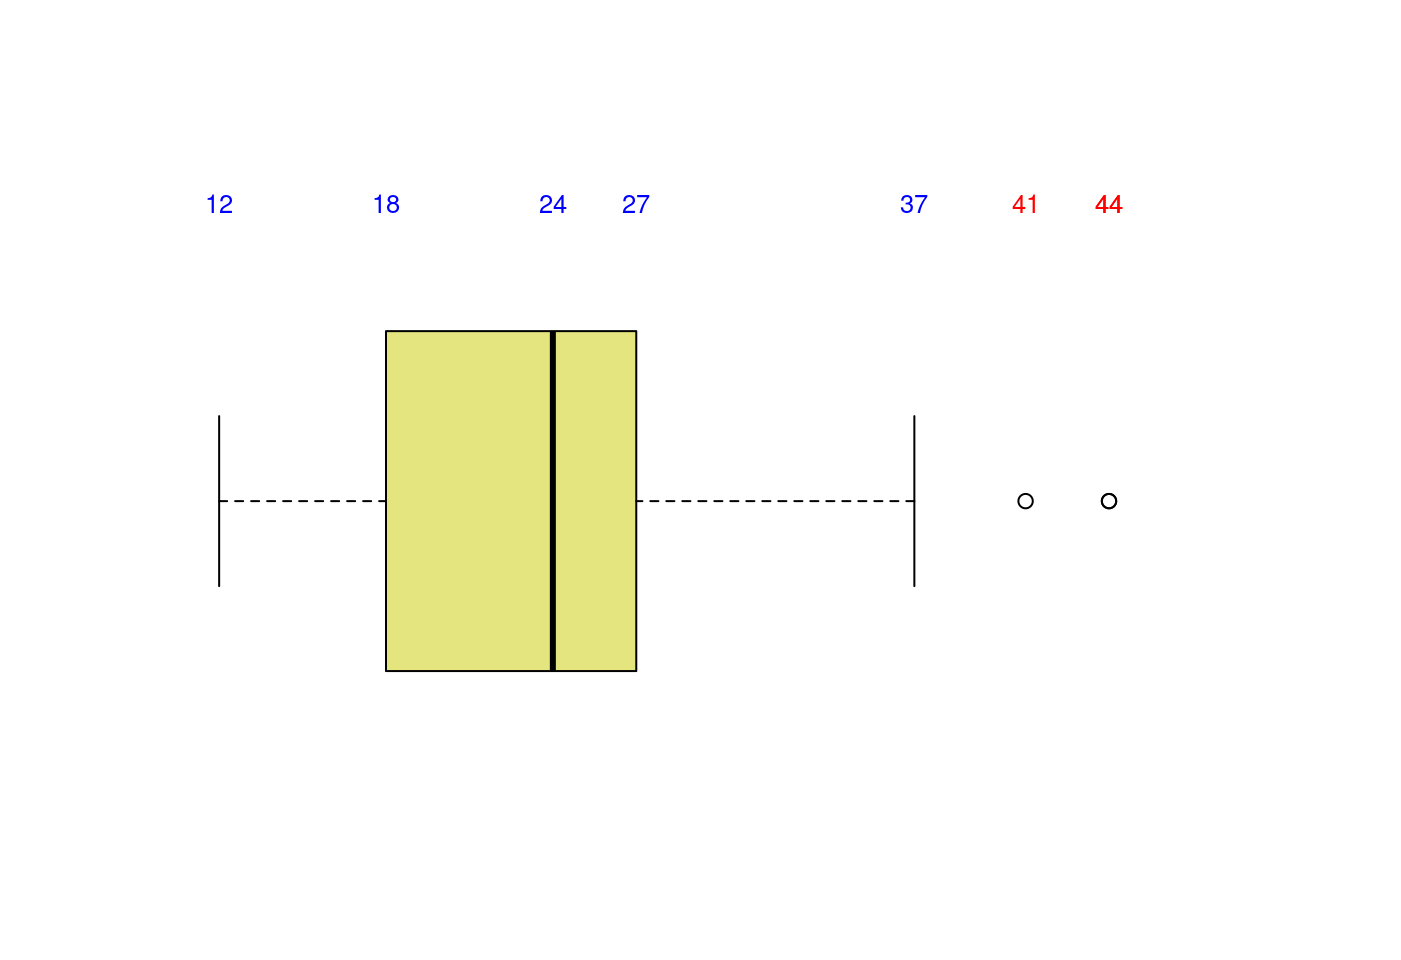
par(mar = c(4, 3.1, 1.1, 2.1))
hist(mpg$hwy,
     breaks = 40,
     col = rgb(0.2,0.8,0.5,0.5),
     border = F,
     main = "",
     xlab = "",
     xlim = c(10,50))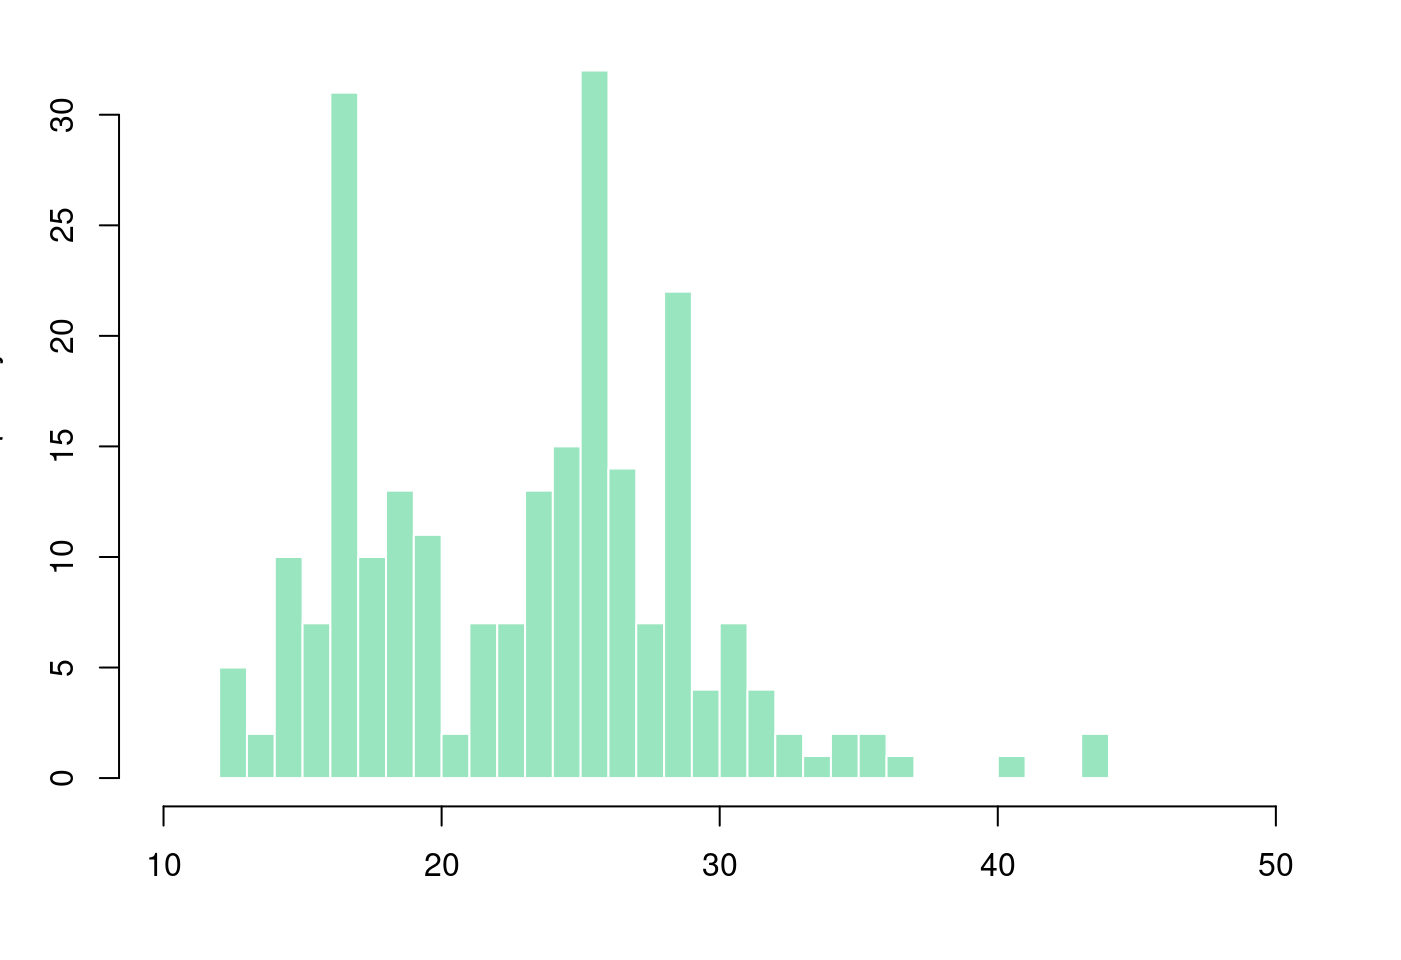
5.1.3.4 盒型圖加直方圖再加密度圖
# Layout to split the screen
layout(mat = matrix(c(1,2), 2, 1, byrow = TRUE), height = c(2,8))
## Error in layout.matrix(mat = matrix(c(1, 2), 2, 1, byrow = TRUE), height = c(2, : 缺少引數 "p",也沒有預設值# Draw the boxplot and the histogram
par(mar=c(0, 3.1, 1.1, 2.1))
boxplot(mpg$hwy,
horizontal = TRUE,
ylim = c(10,50),
xaxt = "n",
col = rgb(0.8,0.8,0,0.5),
frame = F)
text(x = boxplot.stats(mpg$hwy)$stats,
labels = boxplot.stats(mpg$hwy)$stats,
y = 1.35,
col = "blue",
cex = 0.8)
text(x = mpg$hwy[which(mpg$hwy>boxplot.stats(mpg$hwy)$stats[5])],
labels = mpg$hwy[which(mpg$hwy>boxplot.stats(mpg$hwy)$stats[5])],
y = 1.35,
col = "red",
cex = 0.8)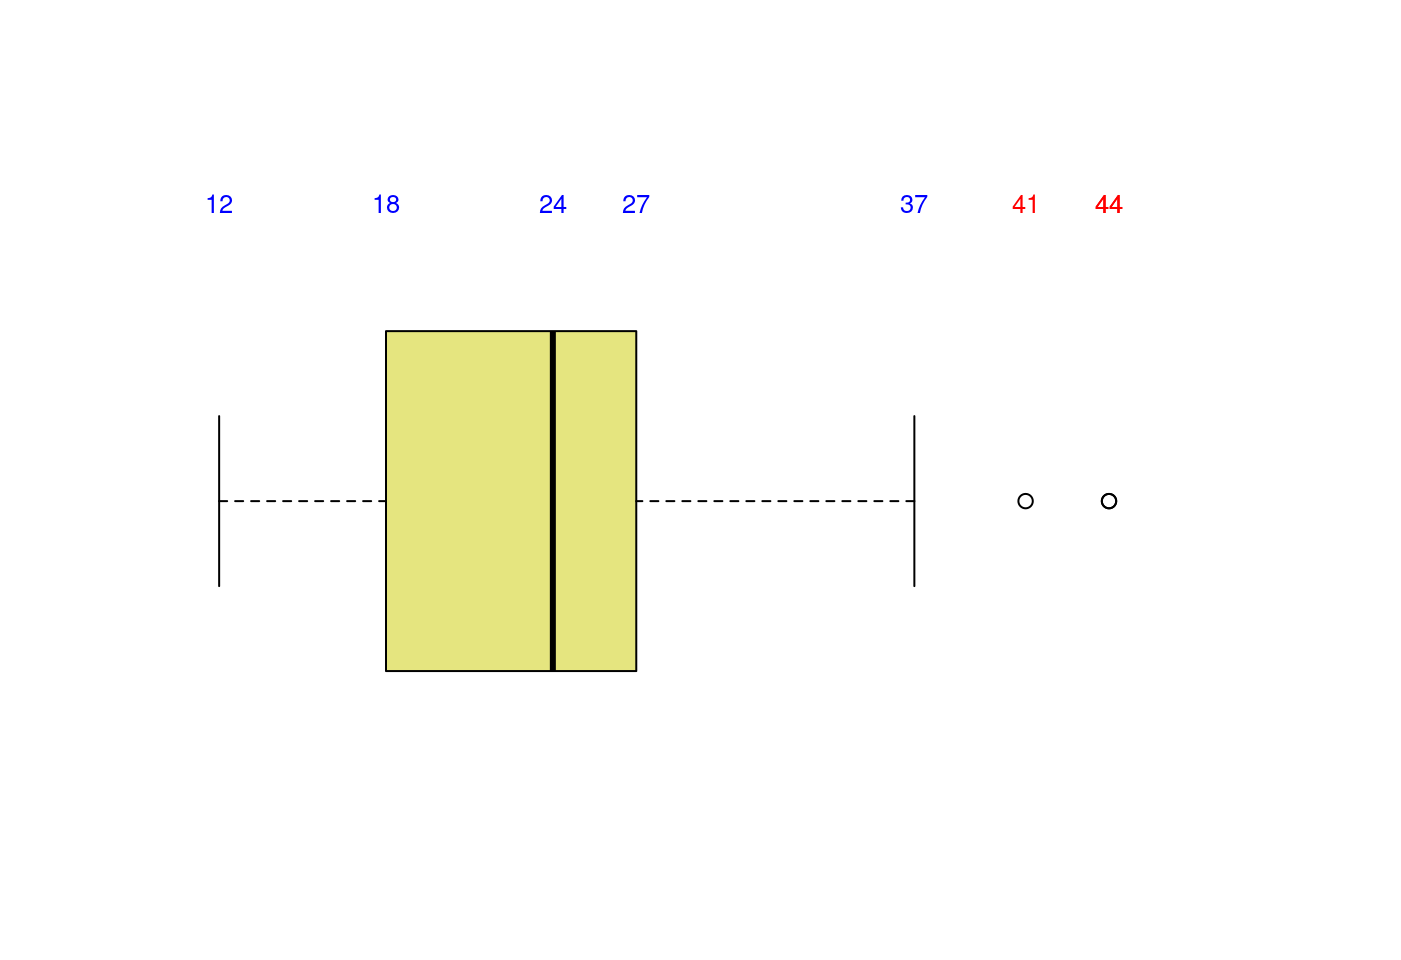
par(mar = c(4, 3.1, 1.1, 2.1))
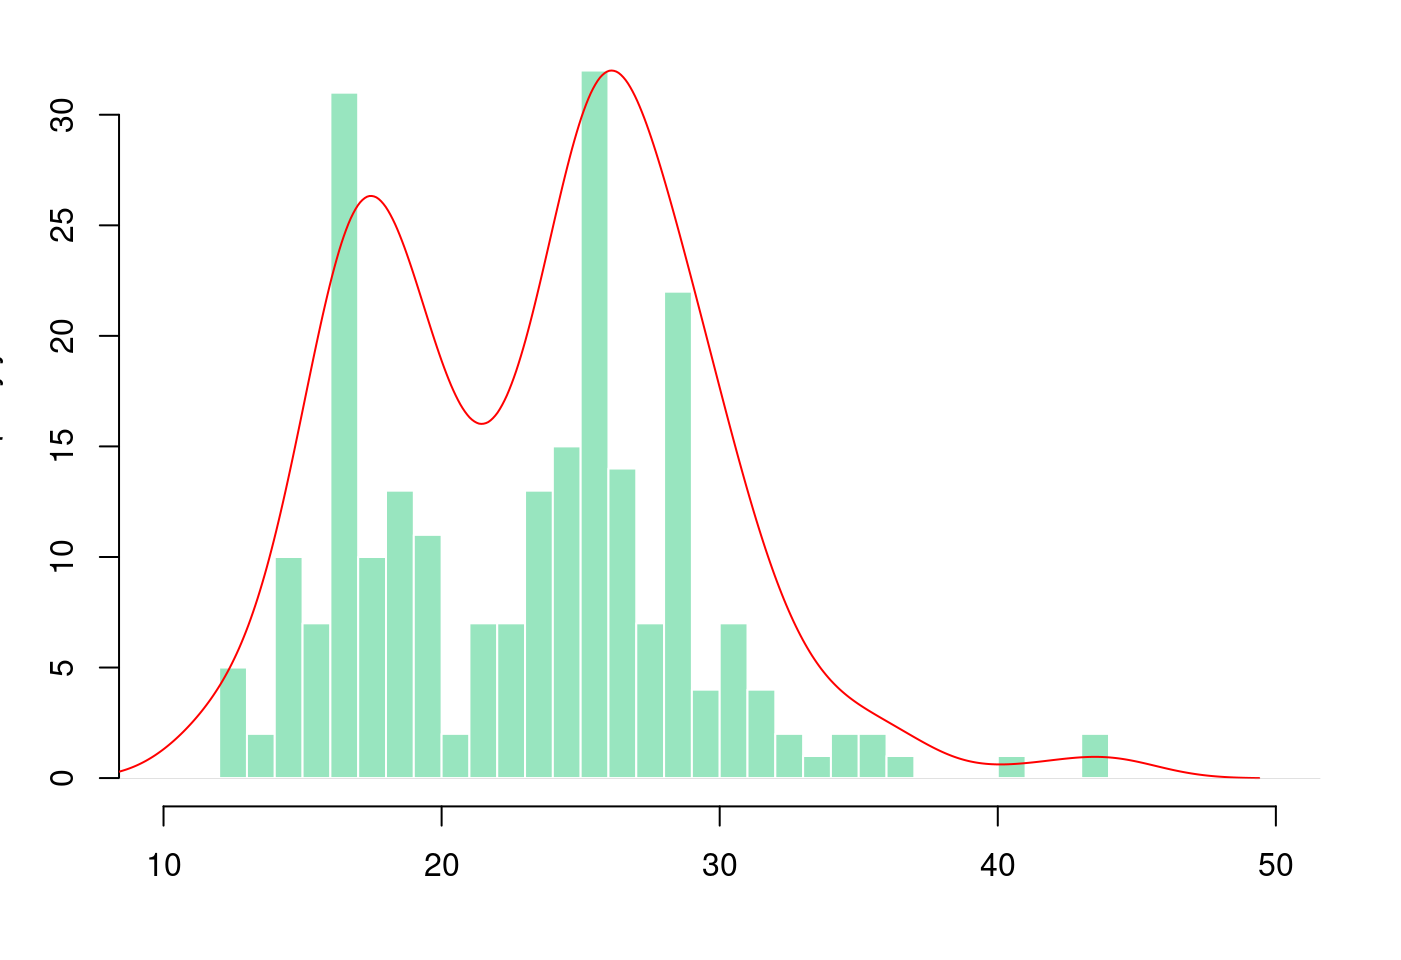
hist(mpg$hwy,
     breaks = 40,
     col = rgb(0.2,0.8,0.5,0.5),
     border = F,
     main = "",
     xlab = "",
     xlim = c(10,50))
# Kernel Density Plot
d <- density(mpg$hwy) # returns the density data
par(new = TRUE)
plot(d,
     col = "red",
     axes = FALSE,
     main = "",
     xlab = "",
     xlim = c(10,50)) # plots the results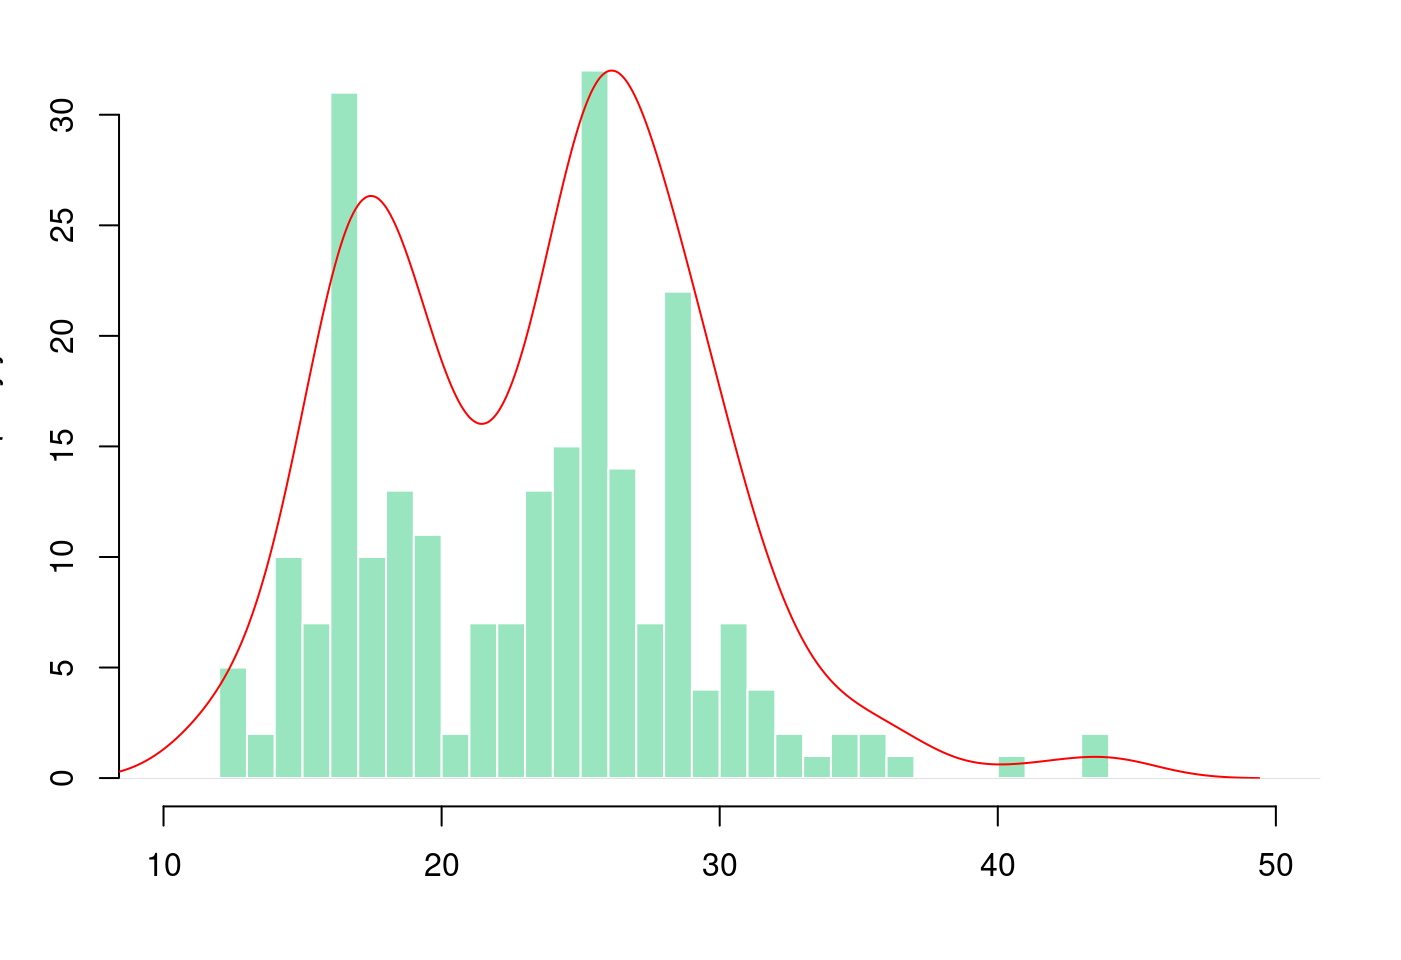
完美!
5.1.4 其他變種盒型圖
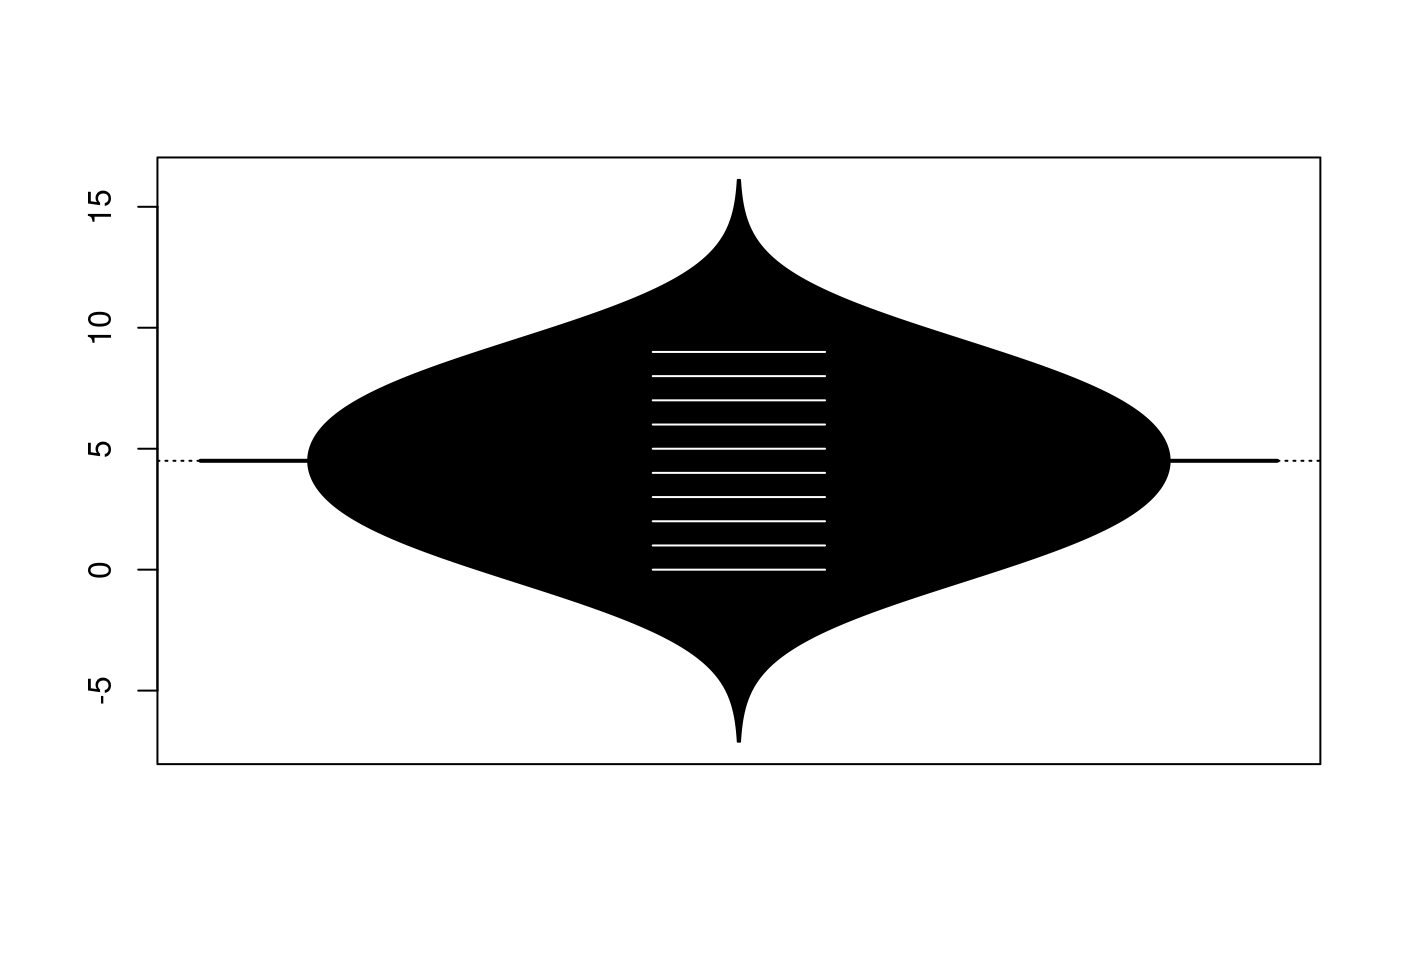
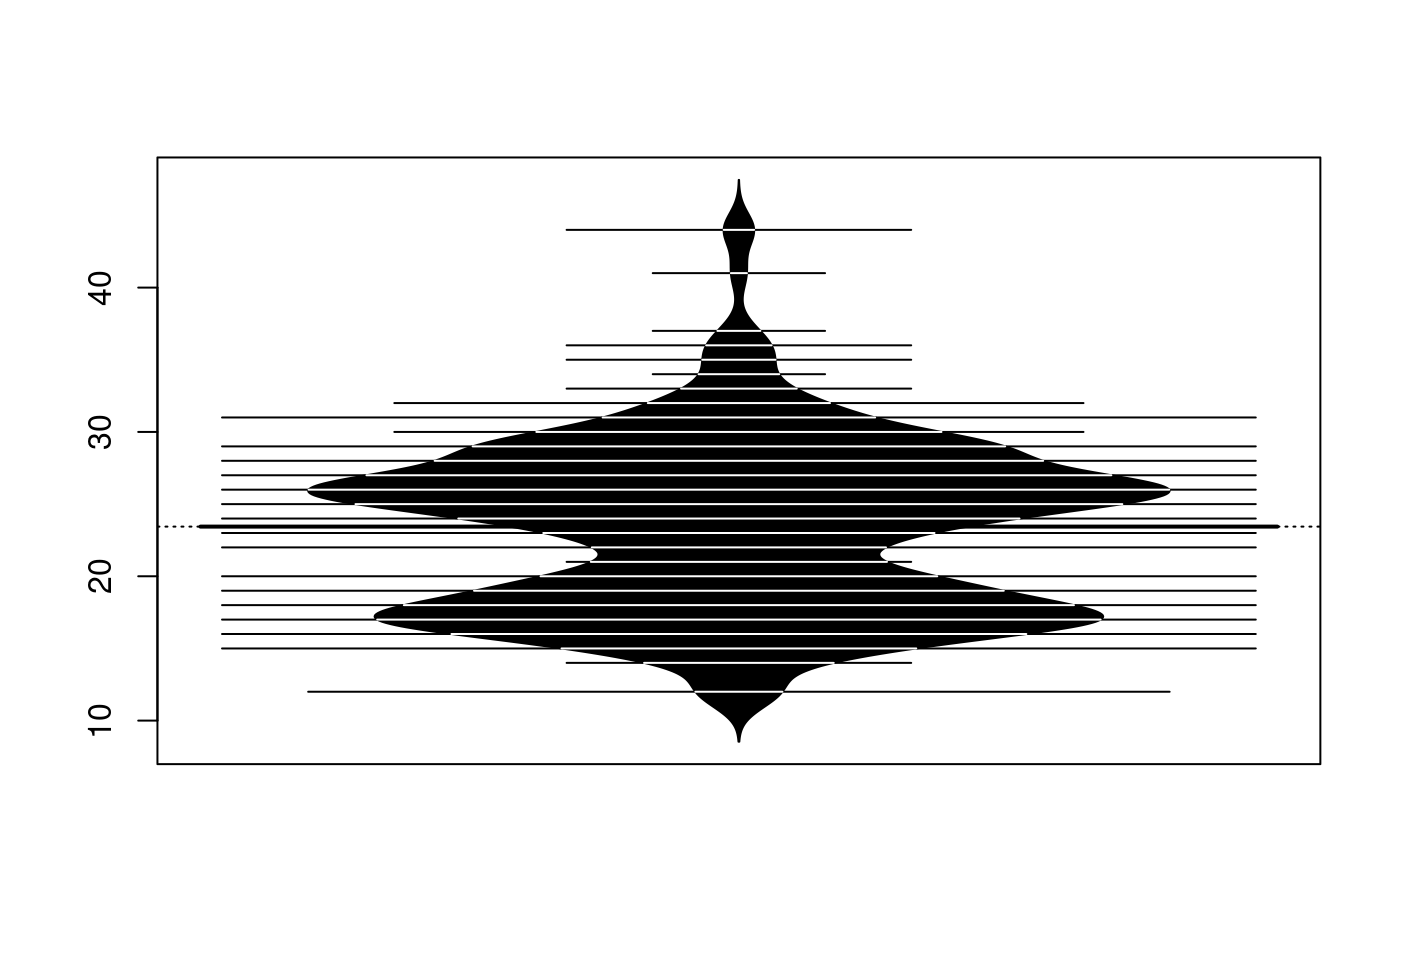
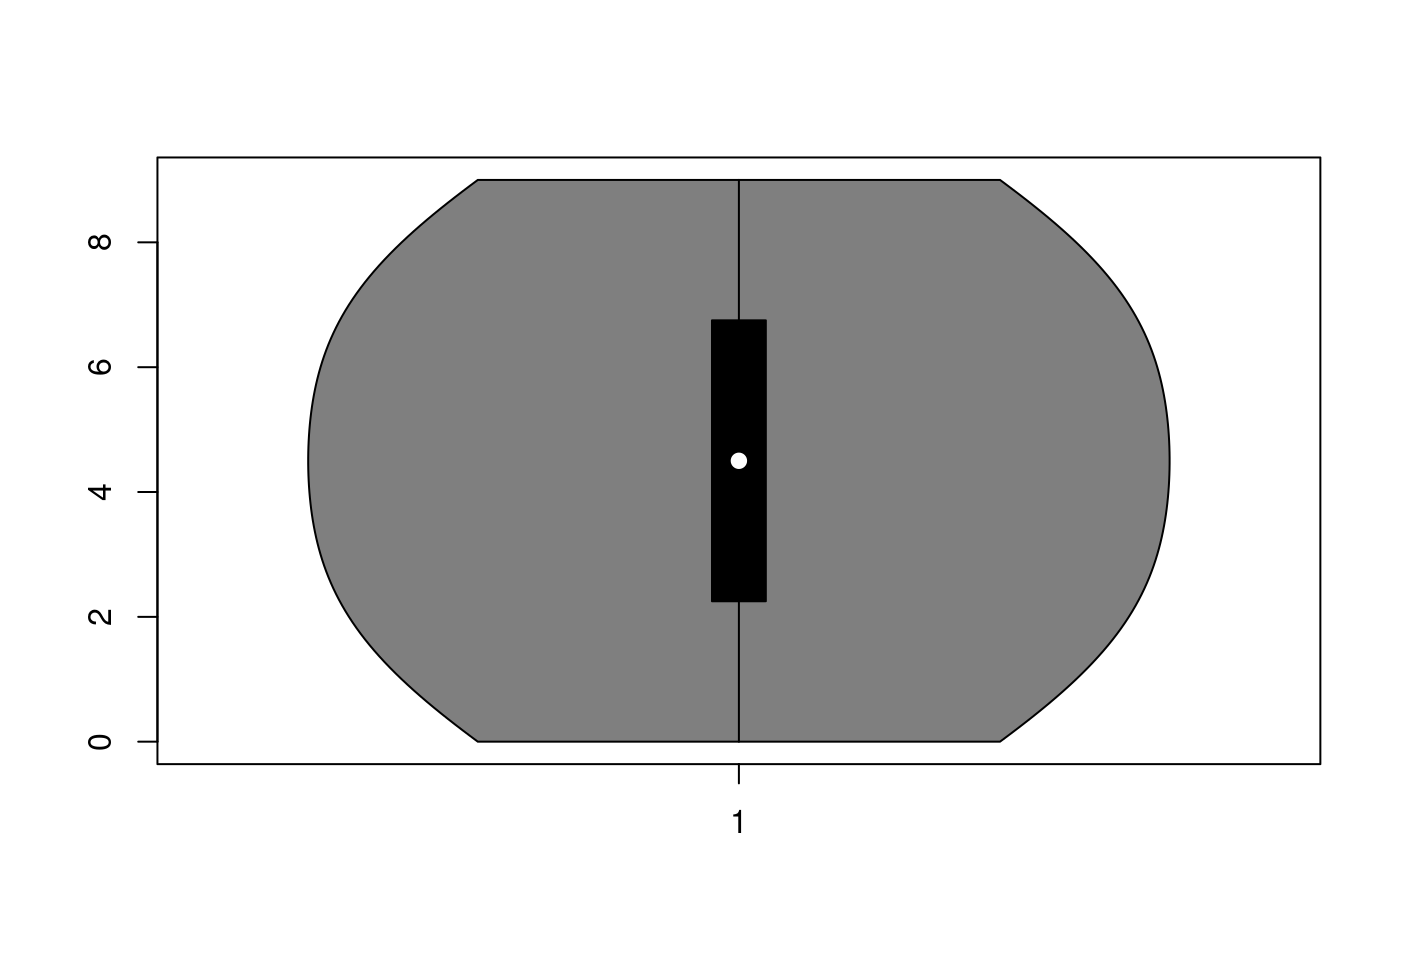
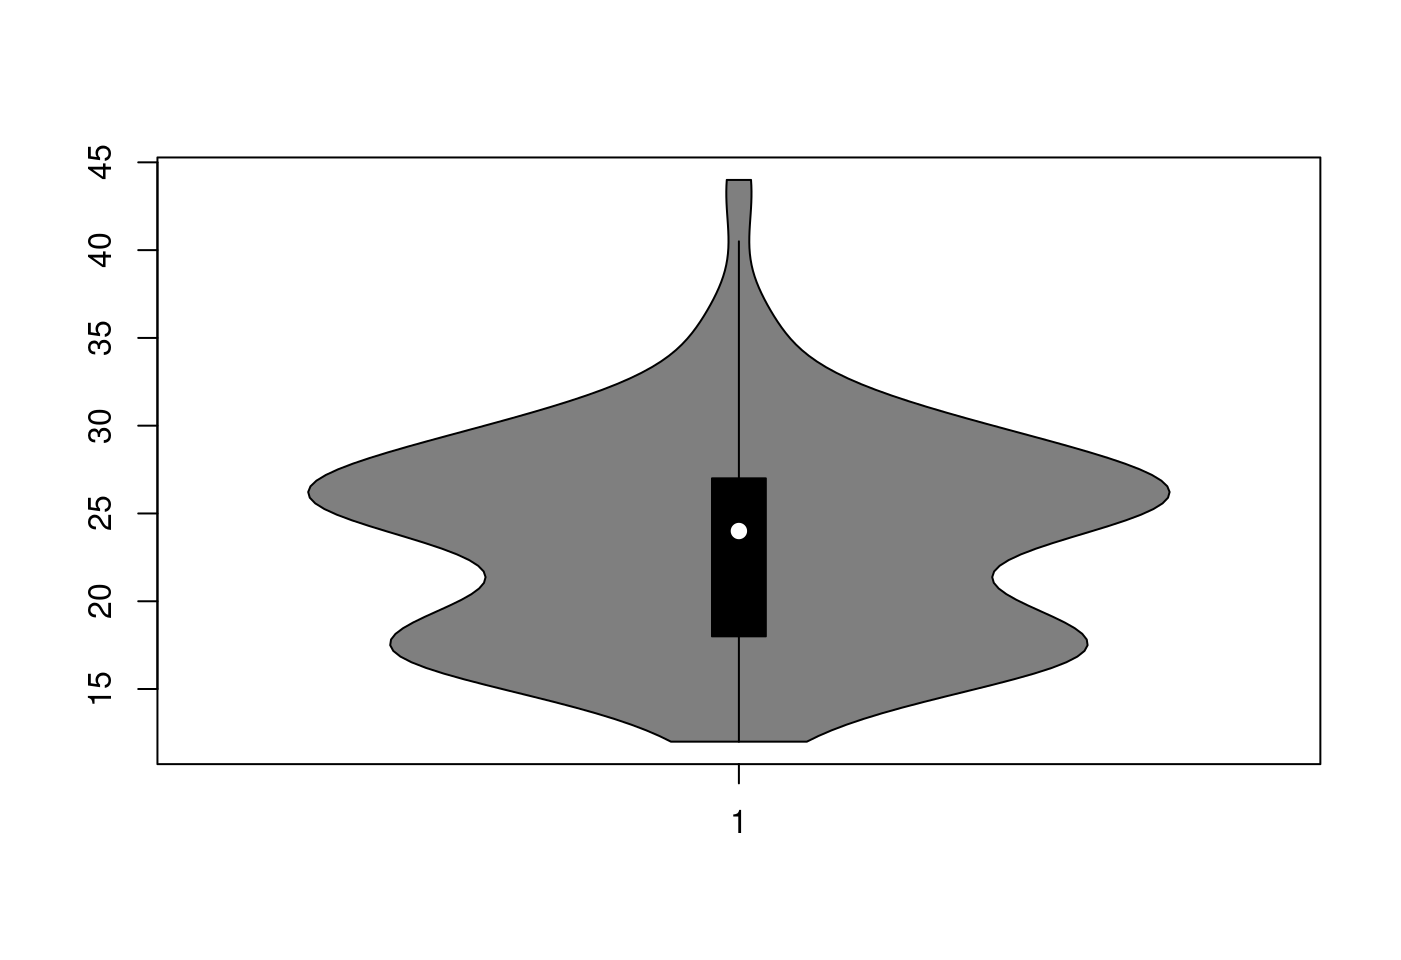
5.1.4.3 再驚豔一次vioplot真的是小提琴
data <- split(mpg$hwy, mpg$drv)
names(data)[1] <- "x"
do.call("vioplot",
        c(data,
          list(ylim = c(10,50),
               names = levels(factor(mpg$drv)),
               col = "orange")))
title("三把小提琴")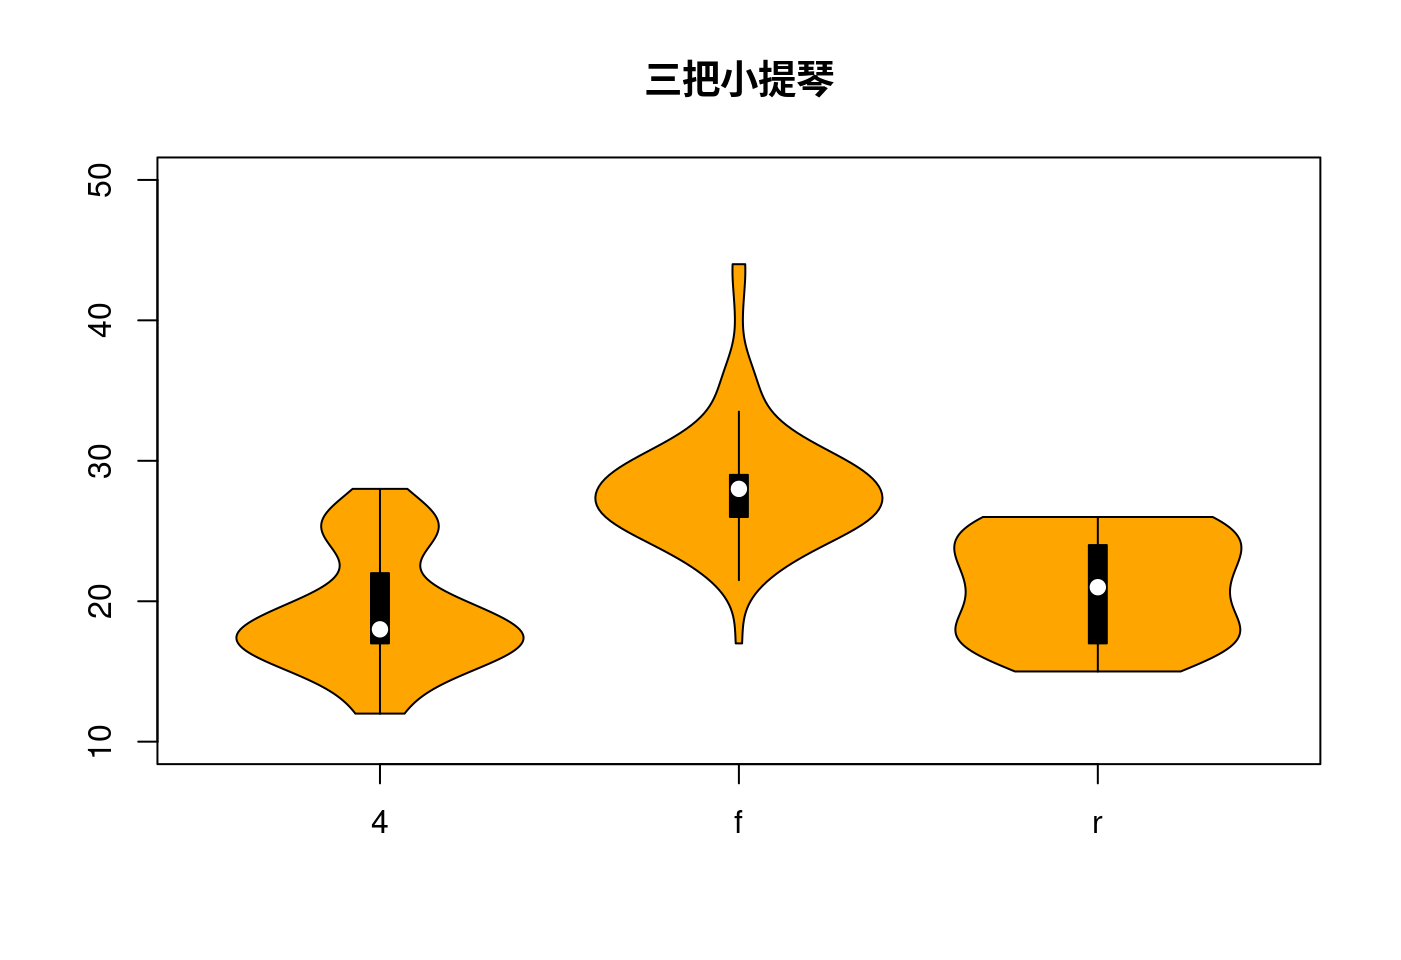
如果只有一個數字,是無法畫任何樣子的小提琴!
data <- split(mpg$hwy, mpg$fl)
names(data)[1] <- "x"
do.call("vioplot",
        c(data,
          list(ylim = c(10,50),
               names = levels(factor(mpg$fl)),
               col = "orange")))
title("三把小提琴加提座")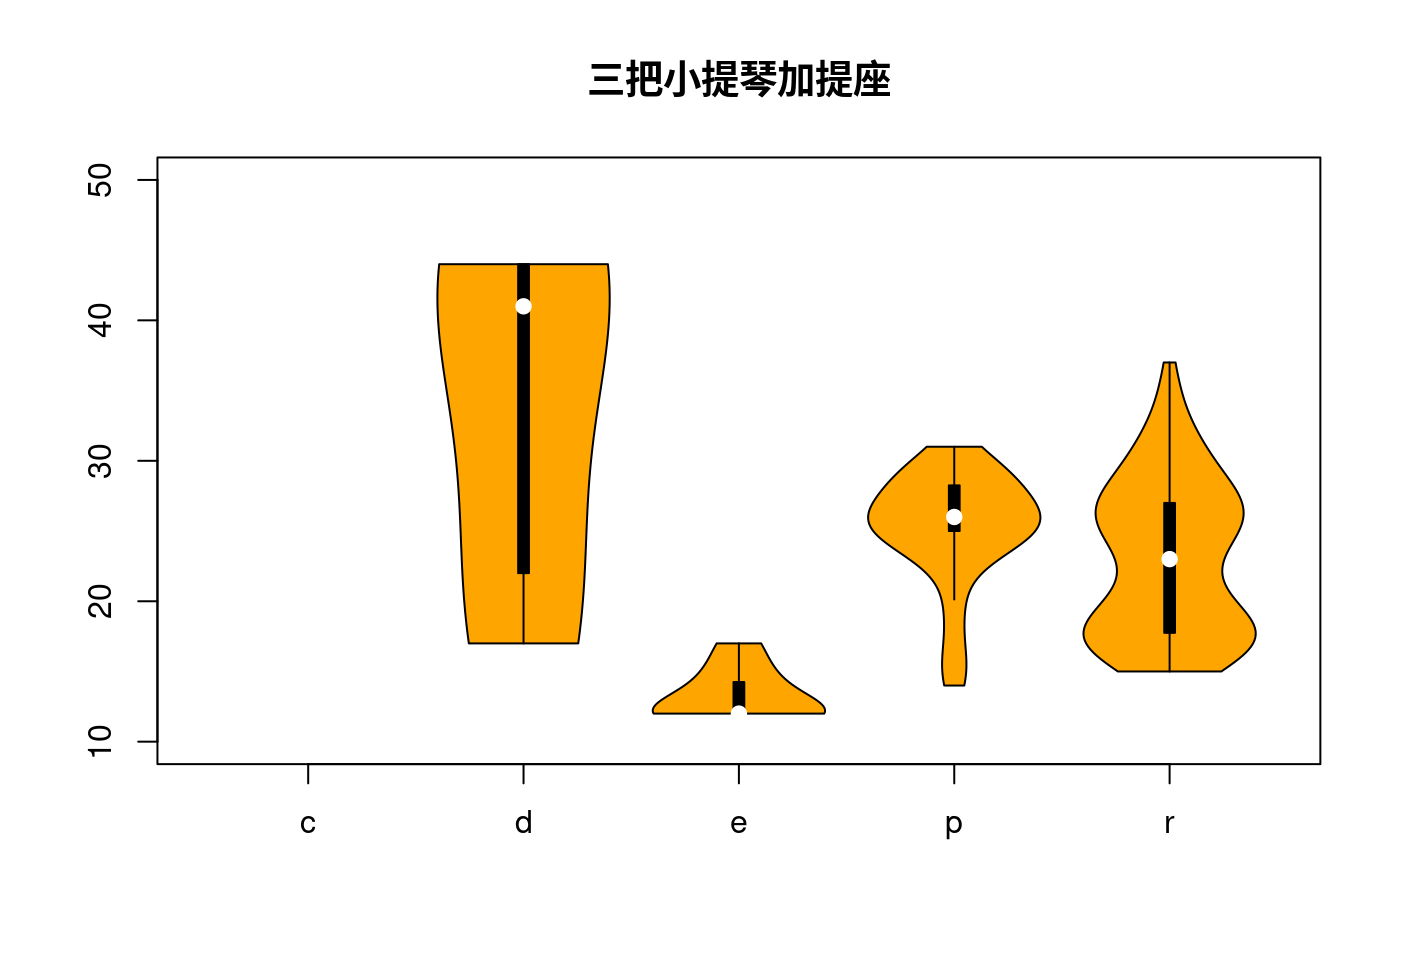
5.1.5 當散佈圖遇上盒型圖
library(car)
data(Prestige)
data(Vocab)
data(UN)scatterplot(prestige ~ income|type,
data = Prestige,
legend = FALSE)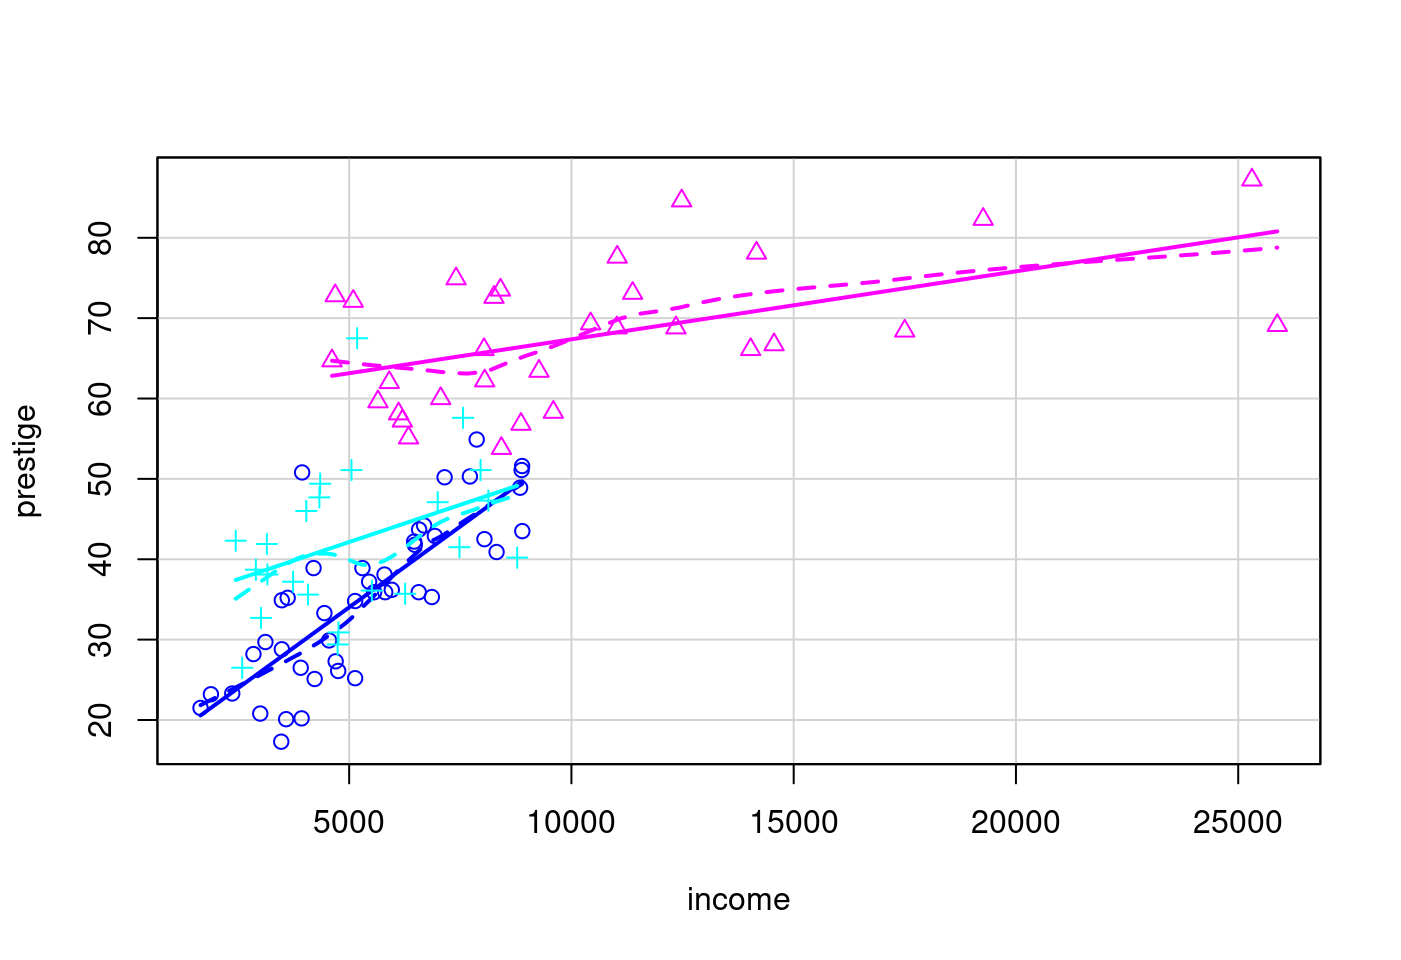
scatterplot(vocabulary ~ education,
            jitter = list(x = 1, y = 1),
            data = Vocab)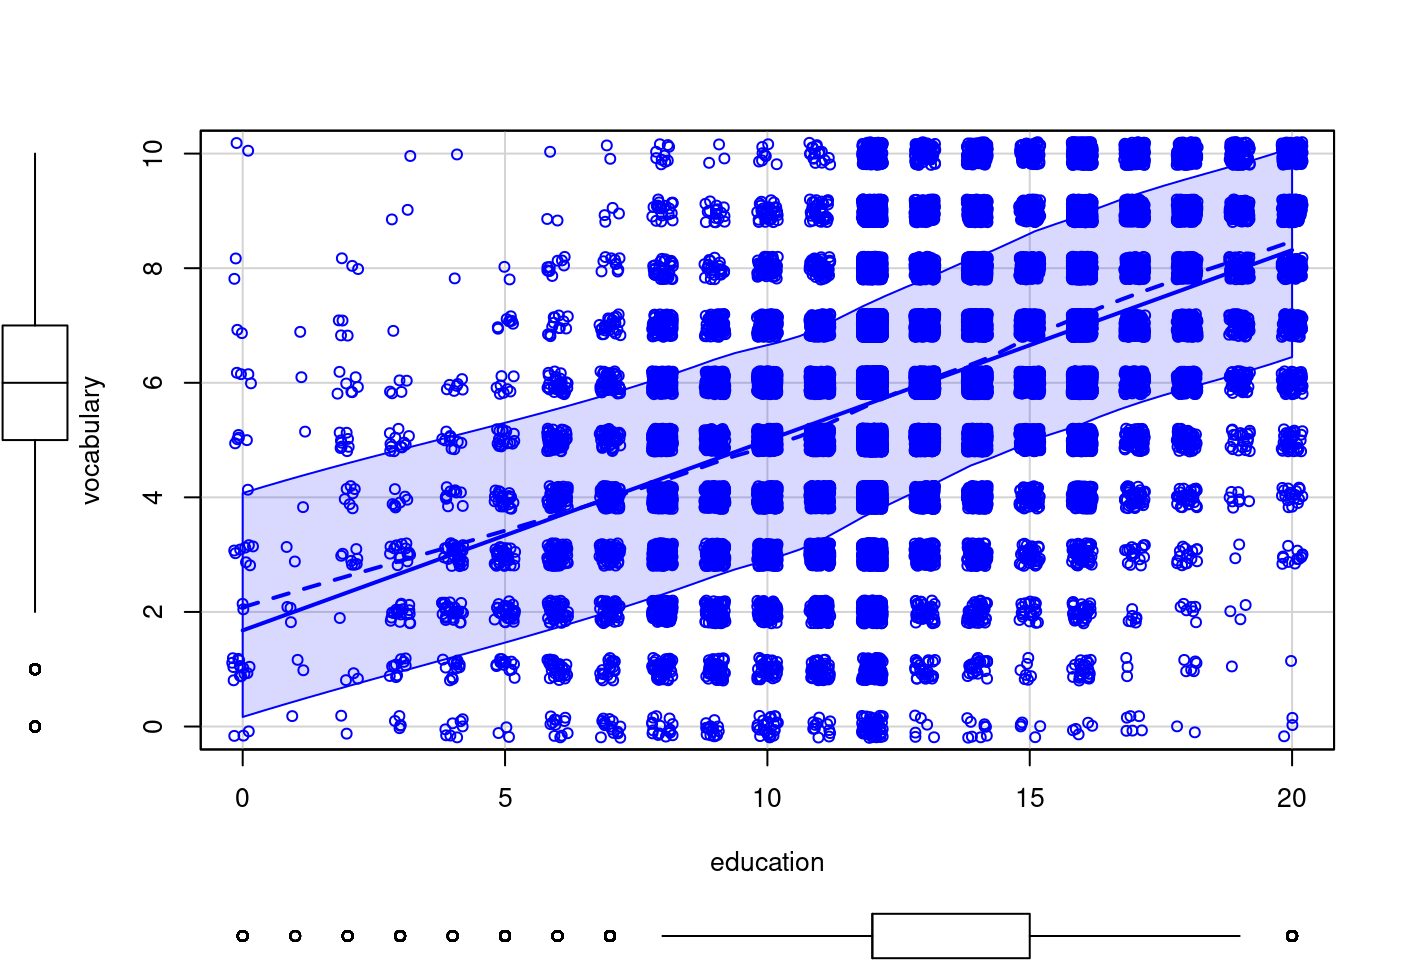
scatterplot(infantMortality ~ ppgdp,
            data = UN)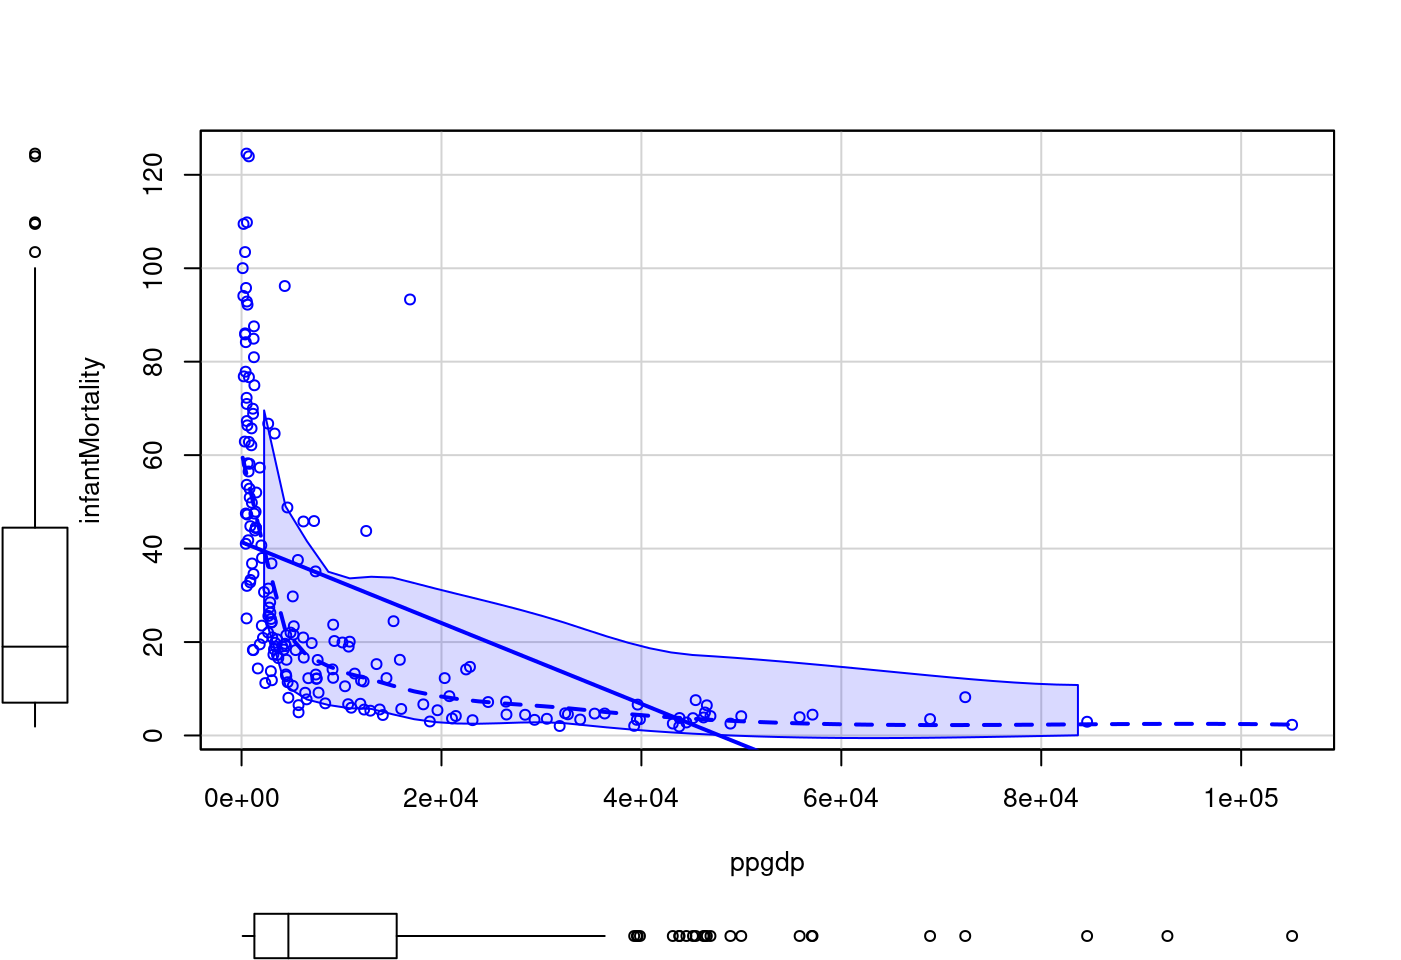
scatterplot(infantMortality ~ ppgdp,
            log = "xy",
            data = UN)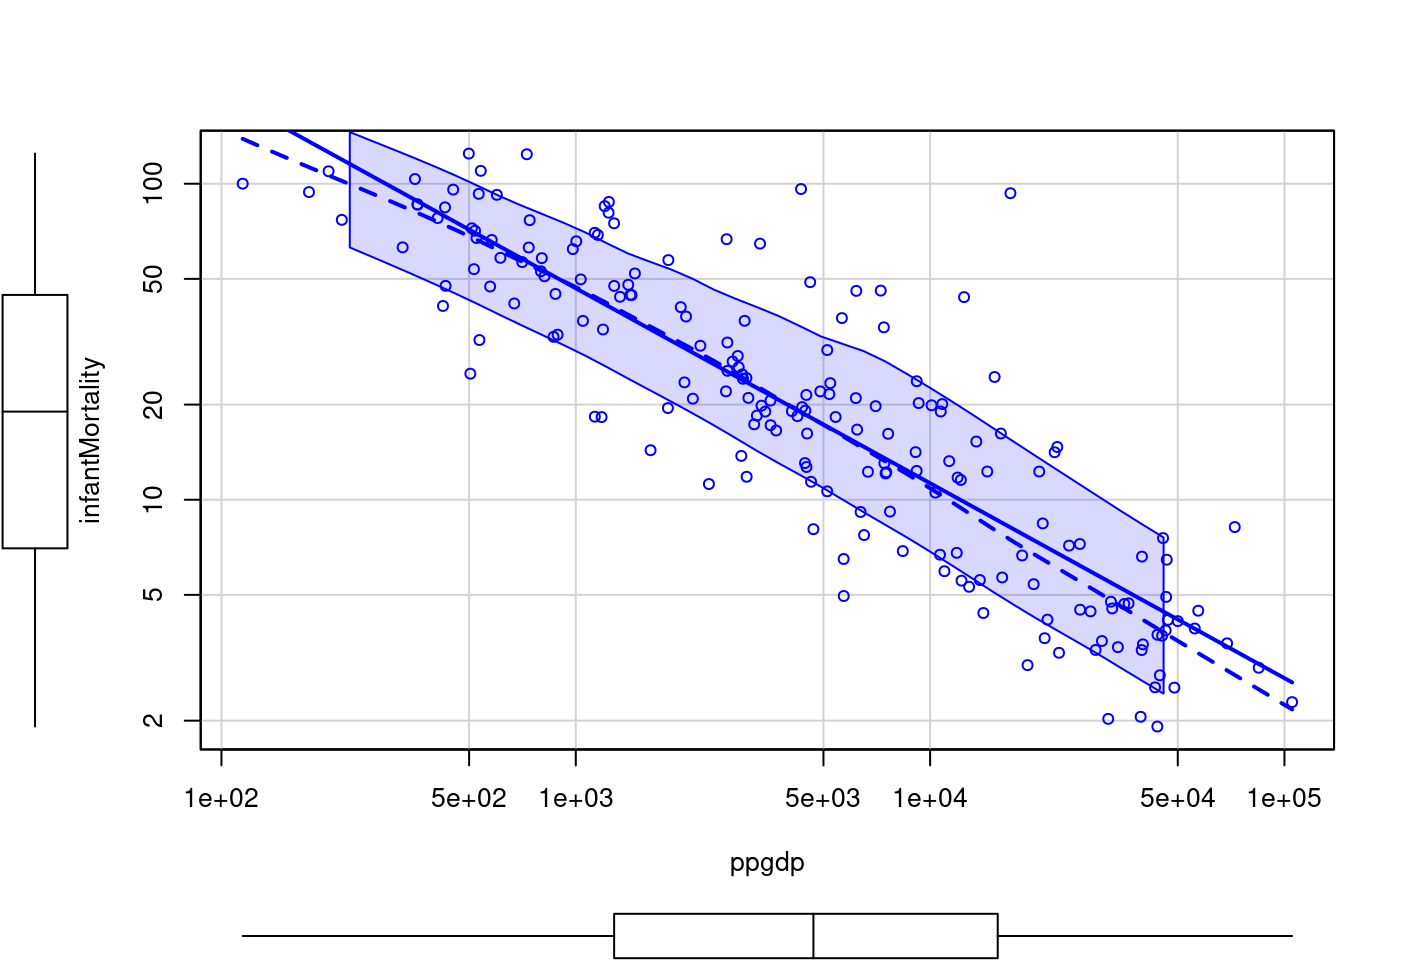
5.2 摘要統計量報表
如果讀者諸君瀏覽過「圖感」跟「數感」,一定會希望把這麼多描述、說明分配的資訊放在一起,一次看得夠,排排站,說不定可以激盪出新的圖、新的數,也就是新的統計量。比如說,看過平均數、看過標準差,有人建議算算標準差除以平均數,叫做變異係數(CV = Coefficient Of Variation)。作者上網搜尋一輪之後,發現「生態統計學家」跟「財務統計學家」都有人用,用變異係數衡量風險。那看過中位數、看過MAD的人,會不會想說算算MAD除以中位數,然後叫做離異係數(Coefficient Of Deviation)呢?如果想知道如何快速一次拿到許多統計量,也想看看哪一個套件是製表高手,請看這裡的示範與介紹。
…
5.2.2 數字的摘要統計量
5.2.2.1 summary
為了簡化示範過程,我們先用阿拉伯數字,一種正整數,看看R的「summary」可以給什麼樣的摘要統計量?
0:9## [1] 0 1 2 3 4 5 6 7 8 9summary(0:9)## Min. 1st Qu. Median Mean 3rd Qu. Max.
## 0.00 2.25 4.50 4.50 6.75 9.00R給什麼樣的摘要統計量報表呢?真的是「報表」嗎?先檢查有沒有名字?跟屬性?
x <- summary(0:9)
x
## Min. 1st Qu. Median Mean 3rd Qu. Max.
## 0.00 2.25 4.50 4.50 6.75 9.00- 名字,其實是某種維度名稱,就像中學學過幾何的「x軸」,上面會註記「x1, x2, x3, …」跟「y軸」,上面會註記「y1, y2, y3, …」:
names(x)## [1] "Min." "1st Qu." "Median" "Mean" "3rd Qu." "Max."- 屬性有兩個
class(x)## [1] "summaryDefault" "table"接下來,一個一個抓來看,summary給我們關於阿拉伯數字,0:9,的
- 最小值是
x["Min."]## Min.
## 0- 第一個四分位數是
x["1st Qu."]## 1st Qu.
## 2.25- 中位數是
x["Median"]## Median
## 4.5- 平均數是
x["Mean"]## Mean
## 4.5- 第三個四分位數是
x["3rd Qu."]## 3rd Qu.
## 6.75- 最大值是
x["Max."]## Max.
## 95.2.2.2 試著變出一張報表來
x## Min. 1st Qu. Median Mean 3rd Qu. Max.
## 0.00 2.25 4.50 4.50 6.75 9.00顯而易見,不是一張日常中的表。讓我們試著幫它化化妝,把各個摘要統計量放在一張形狀類似的表裏。
- 第一次嘗試。根據剛剛一個一個抓來看的經驗,以及網路搜尋得知「表,
data.frame」的用法,我們試試以下這一句話:
data.frame(Min = x["Min."],
           Q1 = x["1st Qu."],
           Median = x["Median"],
           Mean = x["Mean"],
           Q3 = x["3rd Qu."],
           Max = x["Max."])
## Error in dimnames(x) <- dnx: 'dimnames' 被應用於非陣列- 第一次嘗試無功而返!第二次嘗試。錯誤訊息提到一個不認識的字「
dimnames」,作者想說是不是把名字刪去(unname)就行?
x <- unname(x)
x
## [1] 0.00 2.25 4.50 4.50 6.75 9.00data.frame(Min = x[1],
Q1 = x[2],
Median = x[3],
Mean = x[4],
Q3 = x[5],
Max = x[6])## Error in dimnames(x) <- dnx: 'dimnames' 被應用於非陣列- 還是錯誤。而且錯誤訊息一模一樣。所以,作者決定先檢查檢查,雖然不知道要檢查什麼?
x[1]## [1] 0class(x)## [1] "summaryDefault" "table"- 刪去名字,但是屬性依舊。作者再深入檢查屬性一次:
attributes(x)## $class
## [1] "summaryDefault" "table"- 發現屬性藏在「
class」裡,作者問了網路如何「抹去」屬性,發現(記得再一次檢查成果)
attributes(x)$class <- NULL
attributes(x)## NULLclass(x)## [1] "numeric"- 確認
x的「class」變回我們熟悉的「numeric」,就表示
data.frame(Min = x[1],
           Q1 = x[2],
           Median = x[3],
           Mean = x[4],
           Q3 = x[5],
           Max = x[6])
## Min Q1 Median Mean Q3 Max
## 1 0 2.25 4.5 4.5 6.75 9- 或是
data.frame(最小值 = x[1],
           第一個四分位數 = x[2],
           中位數 = x[3],
           平均數 = x[4],
           第三個四分位數 = x[5],
           最大值 = x[6])
## 最小值 第一個四分位數 中位數 平均數 第三個四分位數 最大值
## 1 0 2.25 4.5 4.5 6.75 95.2.2.3 fivenum
R也有一個「五數統計」,
fivenum(0:9)## [1] 0.0 2.0 4.5 7.0 9.0x <- fivenum(0:9)
names(x)## NULLclass(x)## [1] "numeric"似乎可以輕鬆製表,但是,每一個統計量都沒名字,無法知道到底誰是誰? …
5.2.2.3.1 求助
?fivenum。這是跟R求救的基本作法,「問號」加「名字」。
?fivenum- 但是,在這一本微微書,R無法回應上述的句子,所以作者用下面這一句話抓網路使用手冊,讓我們可以繼續討論…
knitr::include_url("https://www.rdocumentation.org/packages/stats/versions/3.6.2/topics/fivenum")- 耐心地往下看到「Value」,說要繼續往下點…
A numeric vector of length 5 containing the summary information. See boxplot.stats for more details.
knitr::include_url("https://www.rdocumentation.org/link/boxplot.stats?package=stats&version=3.6.2")- 一樣看到「Value」,說是有「stats」,
boxplot.stats(0:9)## $stats
## [1] 0.0 2.0 4.5 7.0 9.0
##
## $n
## [1] 10
##
## $conf
## [1] 2.001801 6.998199
##
## $out
## integer(0)boxplot.stats(0:9)$stats## [1] 0.0 2.0 4.5 7.0 9.0a vector of length 5, containing the extreme of the lower whisker, the lower ‘hinge’, the median, the upper ‘hinge’ and the extreme of the upper whisker.
- 所以,這五個數字分別是
5.1 the extreme of the lower whisker
5.2 the lower ‘hinge’
5.3 the median
5.4 the upper ‘hinge’
5.5 the extreme of the upper whisker
- 不好意思,在這裡賣個關子,請讀者諸君前進前一節盒型圖一探究竟這五個數字到底在算什麼!
5.2.2.4 報表的專家
剛剛我們千辛萬苦,變出summary的輸出報表,難道R社群專家無人跟我們有著同樣的「切身之痛」嗎?當然不可能!有請…
5.2.2.4.1 第一位專家:library(psych)
library(psych)
psych::describe(0:9)
## vars n mean sd median trimmed mad min max range skew kurtosis se
## X1 1 10 4.5 3.03 4.5 4.5 3.71 0 9 9 0 -1.56 0.96套件psych給了什麼?
x <- psych::describe(0:9)
names(x)
## [1] "vars" "n" "mean" "sd" "median" "trimmed"
## [7] "mad" "min" "max" "range" "skew" "kurtosis"
## [13] "se"總共給了13個統計量,包括(為了示範R官方與其他套件提供的答案,作者嘗試再現套件「psych」的答案。)
以下各個語法,只要出現「
::」就意味著前面那一個「類英文字」是某個套件,沒有的話,就是R官方的函式。
- vars, 指的是第幾個變數。
- n,
length(0:9) =10 - mean,
mean(0:9) =4.5 - sd,
sd(0:9) =3.0276504 - median,
median(0:9) =4.5 - trimmed,
mean(DescTools::Trim(0:9)) =4.5 - mad,
mad(0:9) =3.7065 - min,
min(0:9) =0 - max,
max(0:9) =9 - range,
range(0:9)[2] - range(0:9)[1] =9 - skew,
e1071::skewness(0:9) =0 - kurtosis,
moments::kurtosis(0:9) - 3 =-1.2242424 - se,
sjstats::se(0:9) =0.9574271
5.2.2.4.2 計算思維練習題:請繼續搜尋套件psych如何計算kurtosis,因為答案不一樣?
提示網站:
knitr::include_url("https://personality-project.org/r/psych/help/describe.html")5.2.2.4.3 第二位專家:library(skimr)
library(skimr)
skim(0:9)| Name | 0:9 |
| Number of rows | 10 |
| Number of columns | 1 |
| _______________________ | |
| Column type frequency: | |
| numeric | 1 |
| ________________________ | |
| Group variables | None |
Variable type: numeric
| skim_variable | n_missing | complete_rate | mean | sd | p0 | p25 | p50 | p75 | p100 | hist |
|---|---|---|---|---|---|---|---|---|---|---|
| data | 0 | 1 | 4.5 | 3.03 | 0 | 2.25 | 4.5 | 6.75 | 9 | ▇▇▇▇▇ |
套件skimr給了什麼?
x <- skimr::skim(0:9)
names(x)
## [1] "skim_type" "skim_variable" "n_missing" "complete_rate"
## [5] "numeric.mean" "numeric.sd" "numeric.p0" "numeric.p25"
## [9] "numeric.p50" "numeric.p75" "numeric.p100" "numeric.hist"總共給了12個統計量,包括
各位看倌一定發現了,
skim設計的名字「又臭又長」,會這樣,當然是為了「盡善盡美」。這是R社群專家最棒的地方,絕對善盡R的學術要求。但是,對作者而言,為了解釋skim提供的12個統計量,是不是自己打上每一個名字,實在讓作者遲疑了幾秒鐘!雖然前面第一位專家psych給的13個統計量的名字真的是一個一個打上去的!還好,用「markdown」的「Rmd」格式可以在字裡行間埋入R語法,所以我用「names(x)[1]」叫出skim提供的第一個統計量的名字。然後把「1」換成「2」繼續叫,直到最後一個。
- skim_type, typeof(0:9) = integer
- skim_variable, 數據集的名字,或是函式
skim提供的名字。 - n_missing, sum(is.na(0:9)) = 0
- complete_rate, sum(complete.cases(0:9))/length(0:9) = 1
- numeric.mean, mean(0:9) = 4.5
- numeric.sd, sd(0:9) = 3.0276504
- numeric.p0, quantile(0:9)[1] = 0
- numeric.p25, quantile(0:9)[2] = 2.25
- numeric.p50, quantile(0:9)[3] = 4.5
- numeric.p75, quantile(0:9)[4] = 6.75
- numeric.p100, quantile(0:9)[5] = 9
- numeric.hist, 畫一張微微直方圖,是套件
skimr的傑作。請各位深入研究這是怎麼辦到的?
5.2.2.4.4 計算思維練習題:定義自己的skim統計量
CD <- function(x){
  mad(x) / median(x)
}
my_skim <- skimr::skim_with(
  numeric = skimr::sfl(median = median,
                       iqr = IQR,
                       mad = mad,
                       CD = CD,
                       p99 = ~ quantile(., probs = .99)),
  append = FALSE
)
my_skim(iris, Sepal.Length, Sepal.Width)| Name | iris |
| Number of rows | 150 |
| Number of columns | 5 |
| _______________________ | |
| Column type frequency: | |
| numeric | 2 |
| ________________________ | |
| Group variables | None |
Variable type: numeric
| skim_variable | n_missing | complete_rate | median | iqr | mad | CD | p99 |
|---|---|---|---|---|---|---|---|
| Sepal.Length | 0 | 1 | 5.8 | 1.3 | 1.04 | 0.18 | 7.70 |
| Sepal.Width | 0 | 1 | 3.0 | 0.5 | 0.44 | 0.15 | 4.15 |
5.2.3 文字的摘要統計量
數字之後,繼續看如何取得文字的摘要統計量跟報表?
5.2.3.1 英文字母
先看小寫英文字母,再看大寫英文字母,以及它們個別在R裏頭的「型態(type)」與「部分成員(atomic)」。
letters## [1] "a" "b" "c" "d" "e" "f" "g" "h" "i" "j" "k" "l" "m" "n" "o" "p" "q" "r" "s"
## [20] "t" "u" "v" "w" "x" "y" "z"str(letters)## chr [1:26] "a" "b" "c" "d" "e" "f" "g" "h" "i" "j" "k" "l" "m" "n" "o" "p" ...LETTERS## [1] "A" "B" "C" "D" "E" "F" "G" "H" "I" "J" "K" "L" "M" "N" "O" "P" "Q" "R" "S"
## [20] "T" "U" "V" "W" "X" "Y" "Z"str(LETTERS)## chr [1:26] "A" "B" "C" "D" "E" "F" "G" "H" "I" "J" "K" "L" "M" "N" "O" "P" ...5.2.3.2 英文字母的摘要統計量
一樣先來小寫英文字母,再來大寫英文字母:
summary(letters)## Length Class Mode
## 26 character charactersummary(LETTERS)## Length Class Mode
## 26 character character5.2.3.3 英文字母的次數分配表
5.2.3.3.1 絕對次數分配表
table(letters)## letters
## a b c d e f g h i j k l m n o p q r s t u v w x y z
## 1 1 1 1 1 1 1 1 1 1 1 1 1 1 1 1 1 1 1 1 1 1 1 1 1 1但前述結果並不是一張美美的表格!
data.frame(table(letters))## letters Freq
## 1 a 1
## 2 b 1
## 3 c 1
## 4 d 1
## 5 e 1
## 6 f 1
## 7 g 1
## 8 h 1
## 9 i 1
## 10 j 1
## 11 k 1
## 12 l 1
## 13 m 1
## 14 n 1
## 15 o 1
## 16 p 1
## 17 q 1
## 18 r 1
## 19 s 1
## 20 t 1
## 21 u 1
## 22 v 1
## 23 w 1
## 24 x 1
## 25 y 1
## 26 z 1橫著擺擺看:這時候,我們請套件data.table來幫忙。原因是,R官方「橫著擺擺看(transpose)」的作法叫做「t」,但是…
t(data.frame(table(letters)))## [,1] [,2] [,3] [,4] [,5] [,6] [,7] [,8] [,9] [,10] [,11] [,12] [,13]
## letters "a" "b" "c" "d" "e" "f" "g" "h" "i" "j" "k" "l" "m"
## Freq "1" "1" "1" "1" "1" "1" "1" "1" "1" "1" "1" "1" "1"
## [,14] [,15] [,16] [,17] [,18] [,19] [,20] [,21] [,22] [,23] [,24] [,25]
## letters "n" "o" "p" "q" "r" "s" "t" "u" "v" "w" "x" "y"
## Freq "1" "1" "1" "1" "1" "1" "1" "1" "1" "1" "1" "1"
## [,26]
## letters "z"
## Freq "1"不是表格!搜尋網路
how to transpose a dataframe in r
讓作者找到套件data.table提供的作法最接近R官方作法:
library(data.table)
transpose(data.frame(table(letters)))
## V1 V2 V3 V4 V5 V6 V7 V8 V9 V10 V11 V12 V13 V14 V15 V16 V17 V18 V19 V20 V21
## 1 a b c d e f g h i j k l m n o p q r s t u
## 2 1 1 1 1 1 1 1 1 1 1 1 1 1 1 1 1 1 1 1 1 1
## V22 V23 V24 V25 V26
## 1 v w x y z
## 2 1 1 1 1 1但是, 多了「一橫排」!讓作者試著改改看:
x <- transpose(data.frame(table(letters)))
x
## V1 V2 V3 V4 V5 V6 V7 V8 V9 V10 V11 V12 V13 V14 V15 V16 V17 V18 V19 V20 V21
## 1 a b c d e f g h i j k l m n o p q r s t u
## 2 1 1 1 1 1 1 1 1 1 1 1 1 1 1 1 1 1 1 1 1 1
## V22 V23 V24 V25 V26
## 1 v w x y z
## 2 1 1 1 1 1colnames(x) <- x[1,]
x## a b c d e f g h i j k l m n o p q r s t u v w x y z
## 1 a b c d e f g h i j k l m n o p q r s t u v w x y z
## 2 1 1 1 1 1 1 1 1 1 1 1 1 1 1 1 1 1 1 1 1 1 1 1 1 1 1x <- x[-1,]
x## a b c d e f g h i j k l m n o p q r s t u v w x y z
## 2 1 1 1 1 1 1 1 1 1 1 1 1 1 1 1 1 1 1 1 1 1 1 1 1 1 1rownames(x) <- 1
x## a b c d e f g h i j k l m n o p q r s t u v w x y z
## 1 1 1 1 1 1 1 1 1 1 1 1 1 1 1 1 1 1 1 1 1 1 1 1 1 1 1成功了!
5.2.3.3.2 相對次數分配表
prop.table(table(letters))## letters
## a b c d e f g
## 0.03846154 0.03846154 0.03846154 0.03846154 0.03846154 0.03846154 0.03846154
## h i j k l m n
## 0.03846154 0.03846154 0.03846154 0.03846154 0.03846154 0.03846154 0.03846154
## o p q r s t u
## 0.03846154 0.03846154 0.03846154 0.03846154 0.03846154 0.03846154 0.03846154
## v w x y z
## 0.03846154 0.03846154 0.03846154 0.03846154 0.03846154data.frame(prop.table(table(letters)))## letters Freq
## 1 a 0.03846154
## 2 b 0.03846154
## 3 c 0.03846154
## 4 d 0.03846154
## 5 e 0.03846154
## 6 f 0.03846154
## 7 g 0.03846154
## 8 h 0.03846154
## 9 i 0.03846154
## 10 j 0.03846154
## 11 k 0.03846154
## 12 l 0.03846154
## 13 m 0.03846154
## 14 n 0.03846154
## 15 o 0.03846154
## 16 p 0.03846154
## 17 q 0.03846154
## 18 r 0.03846154
## 19 s 0.03846154
## 20 t 0.03846154
## 21 u 0.03846154
## 22 v 0.03846154
## 23 w 0.03846154
## 24 x 0.03846154
## 25 y 0.03846154
## 26 z 0.038461545.2.3.4 再請專家:library(skimr)
skimr::skim(letters)| Name | letters |
| Number of rows | 26 |
| Number of columns | 1 |
| _______________________ | |
| Column type frequency: | |
| character | 1 |
| ________________________ | |
| Group variables | None |
Variable type: character
| skim_variable | n_missing | complete_rate | min | max | empty | n_unique | whitespace |
|---|---|---|---|---|---|---|---|
| data | 0 | 1 | 1 | 1 | 0 | 26 | 0 |
5.2.4 表的摘要統計量
在前述幾個段落,作者刻意分開數字與文字,這純粹是為了示範、為了教學、為了學習,絕對不是刻意與現實脫節,請讀者諸君特別注意這一類的「學術工程建構法」。接下來,我們引用R官方套件datasets裏頭收錄的一組著名的數據集iris,為各位示範如何取得現實世界裡,某一張大表的摘要統計量,並且試圖製作「高可讀性的報表」。
- 呼叫
iris
library(datasets)
data(iris)
class(iris)## [1] "data.frame"sapply(iris, class)## Sepal.Length Sepal.Width Petal.Length Petal.Width Species
## "numeric" "numeric" "numeric" "numeric" "factor"- 前面幾筆:
head(iris)## Sepal.Length Sepal.Width Petal.Length Petal.Width Species
## 1 5.1 3.5 1.4 0.2 setosa
## 2 4.9 3.0 1.4 0.2 setosa
## 3 4.7 3.2 1.3 0.2 setosa
## 4 4.6 3.1 1.5 0.2 setosa
## 5 5.0 3.6 1.4 0.2 setosa
## 6 5.4 3.9 1.7 0.4 setosa- 製作摘要統計量報表
summary(iris)## Sepal.Length Sepal.Width Petal.Length Petal.Width
## Min. :4.300 Min. :2.000 Min. :1.000 Min. :0.100
## 1st Qu.:5.100 1st Qu.:2.800 1st Qu.:1.600 1st Qu.:0.300
## Median :5.800 Median :3.000 Median :4.350 Median :1.300
## Mean :5.843 Mean :3.057 Mean :3.758 Mean :1.199
## 3rd Qu.:6.400 3rd Qu.:3.300 3rd Qu.:5.100 3rd Qu.:1.800
## Max. :7.900 Max. :4.400 Max. :6.900 Max. :2.500
## Species
## setosa :50
## versicolor:50
## virginica :50
##
##
## data.frame(summary(iris))## Var1 Var2 Freq
## 1 Sepal.Length Min. :4.300
## 2 Sepal.Length 1st Qu.:5.100
## 3 Sepal.Length Median :5.800
## 4 Sepal.Length Mean :5.843
## 5 Sepal.Length 3rd Qu.:6.400
## 6 Sepal.Length Max. :7.900
## 7 Sepal.Width Min. :2.000
## 8 Sepal.Width 1st Qu.:2.800
## 9 Sepal.Width Median :3.000
## 10 Sepal.Width Mean :3.057
## 11 Sepal.Width 3rd Qu.:3.300
## 12 Sepal.Width Max. :4.400
## 13 Petal.Length Min. :1.000
## 14 Petal.Length 1st Qu.:1.600
## 15 Petal.Length Median :4.350
## 16 Petal.Length Mean :3.758
## 17 Petal.Length 3rd Qu.:5.100
## 18 Petal.Length Max. :6.900
## 19 Petal.Width Min. :0.100
## 20 Petal.Width 1st Qu.:0.300
## 21 Petal.Width Median :1.300
## 22 Petal.Width Mean :1.199
## 23 Petal.Width 3rd Qu.:1.800
## 24 Petal.Width Max. :2.500
## 25 Species setosa :50
## 26 Species versicolor:50
## 27 Species virginica :50
## 28 Species <NA>
## 29 Species <NA>
## 30 Species <NA>上述這一張表,絕對不是一張「高可讀性的報表」。
5.2.4.0.1 計算思維練習題:請試著為summary(iris)變出一張「高可讀性的報表」。
繼續看看fivenum…
fivenum(iris)## Error in xtfrm.data.frame(x): cannot xtfrm data frames從錯誤訊息看來,fivenum無法接受一張大表!讓我們一個一個欄位看:
sapply(iris, fivenum)## Sepal.Length Sepal.Width Petal.Length Petal.Width Species
## [1,] 4.3 2.0 1.00 0.1 NA
## [2,] 5.1 2.8 1.60 0.3 NA
## [3,] 5.8 3.0 4.35 1.3 NA
## [4,] 6.4 3.3 5.10 1.8 NA
## [5,] 7.9 4.4 6.90 2.5 NA但是fivenum無法計算factor文字的摘要統計量!
fivenum(iris$Species)## [1] NA NA NA NA NA- 有請專家
psych
psych::describe(iris)## vars n mean sd median trimmed mad min max range skew
## Sepal.Length 1 150 5.84 0.83 5.80 5.81 1.04 4.3 7.9 3.6 0.31
## Sepal.Width 2 150 3.06 0.44 3.00 3.04 0.44 2.0 4.4 2.4 0.31
## Petal.Length 3 150 3.76 1.77 4.35 3.76 1.85 1.0 6.9 5.9 -0.27
## Petal.Width 4 150 1.20 0.76 1.30 1.18 1.04 0.1 2.5 2.4 -0.10
## Species* 5 150 2.00 0.82 2.00 2.00 1.48 1.0 3.0 2.0 0.00
## kurtosis se
## Sepal.Length -0.61 0.07
## Sepal.Width 0.14 0.04
## Petal.Length -1.42 0.14
## Petal.Width -1.36 0.06
## Species* -1.52 0.07看來,psych的describe也無法處理factor文字的摘要統計量!
- 最後有請專家
skimr
skimr::skim(iris)| Name | iris |
| Number of rows | 150 |
| Number of columns | 5 |
| _______________________ | |
| Column type frequency: | |
| factor | 1 |
| numeric | 4 |
| ________________________ | |
| Group variables | None |
Variable type: factor
| skim_variable | n_missing | complete_rate | ordered | n_unique | top_counts |
|---|---|---|---|---|---|
| Species | 0 | 1 | FALSE | 3 | set: 50, ver: 50, vir: 50 |
Variable type: numeric
| skim_variable | n_missing | complete_rate | mean | sd | p0 | p25 | p50 | p75 | p100 | hist |
|---|---|---|---|---|---|---|---|---|---|---|
| Sepal.Length | 0 | 1 | 5.84 | 0.83 | 4.3 | 5.1 | 5.80 | 6.4 | 7.9 | ▆▇▇▅▂ |
| Sepal.Width | 0 | 1 | 3.06 | 0.44 | 2.0 | 2.8 | 3.00 | 3.3 | 4.4 | ▁▆▇▂▁ |
| Petal.Length | 0 | 1 | 3.76 | 1.77 | 1.0 | 1.6 | 4.35 | 5.1 | 6.9 | ▇▁▆▇▂ |
| Petal.Width | 0 | 1 | 1.20 | 0.76 | 0.1 | 0.3 | 1.30 | 1.8 | 2.5 | ▇▁▇▅▃ |
套件
skimr是冠軍!
5.2.5 一群一群「部分數據集、子數據集」的摘要統計量
5.2.5.1 先來平均數與標準差
library(doBy)
summaryBy(Sepal.Length + Sepal.Width ~ Species,
data = iris,
FUN = function(x) {
c(平均數 = mean(x), 標準差 = sd(x))
})## Species Sepal.Length.平均數 Sepal.Length.標準差 Sepal.Width.平均數
## 1 setosa 5.006 0.3524897 3.428
## 2 versicolor 5.936 0.5161711 2.770
## 3 virginica 6.588 0.6358796 2.974
## Sepal.Width.標準差
## 1 0.3790644
## 2 0.3137983
## 3 0.32249665.2.5.2 再來偏度跟扁度
library(doBy)
summaryBy(Sepal.Length + Sepal.Width ~ Species,
data = iris,
FUN = function(x) {
c(偏度 = e1071::skewness(x), 扁度 = moments::kurtosis(x))
})## Species Sepal.Length.偏度 Sepal.Length.扁度 Sepal.Width.偏度
## 1 setosa 0.11297784 2.654235 0.03872946
## 2 versicolor 0.09913926 2.401173 -0.34136443
## 3 virginica 0.11102862 2.912058 0.34428489
## Sepal.Width.扁度
## 1 3.744222
## 2 2.551728
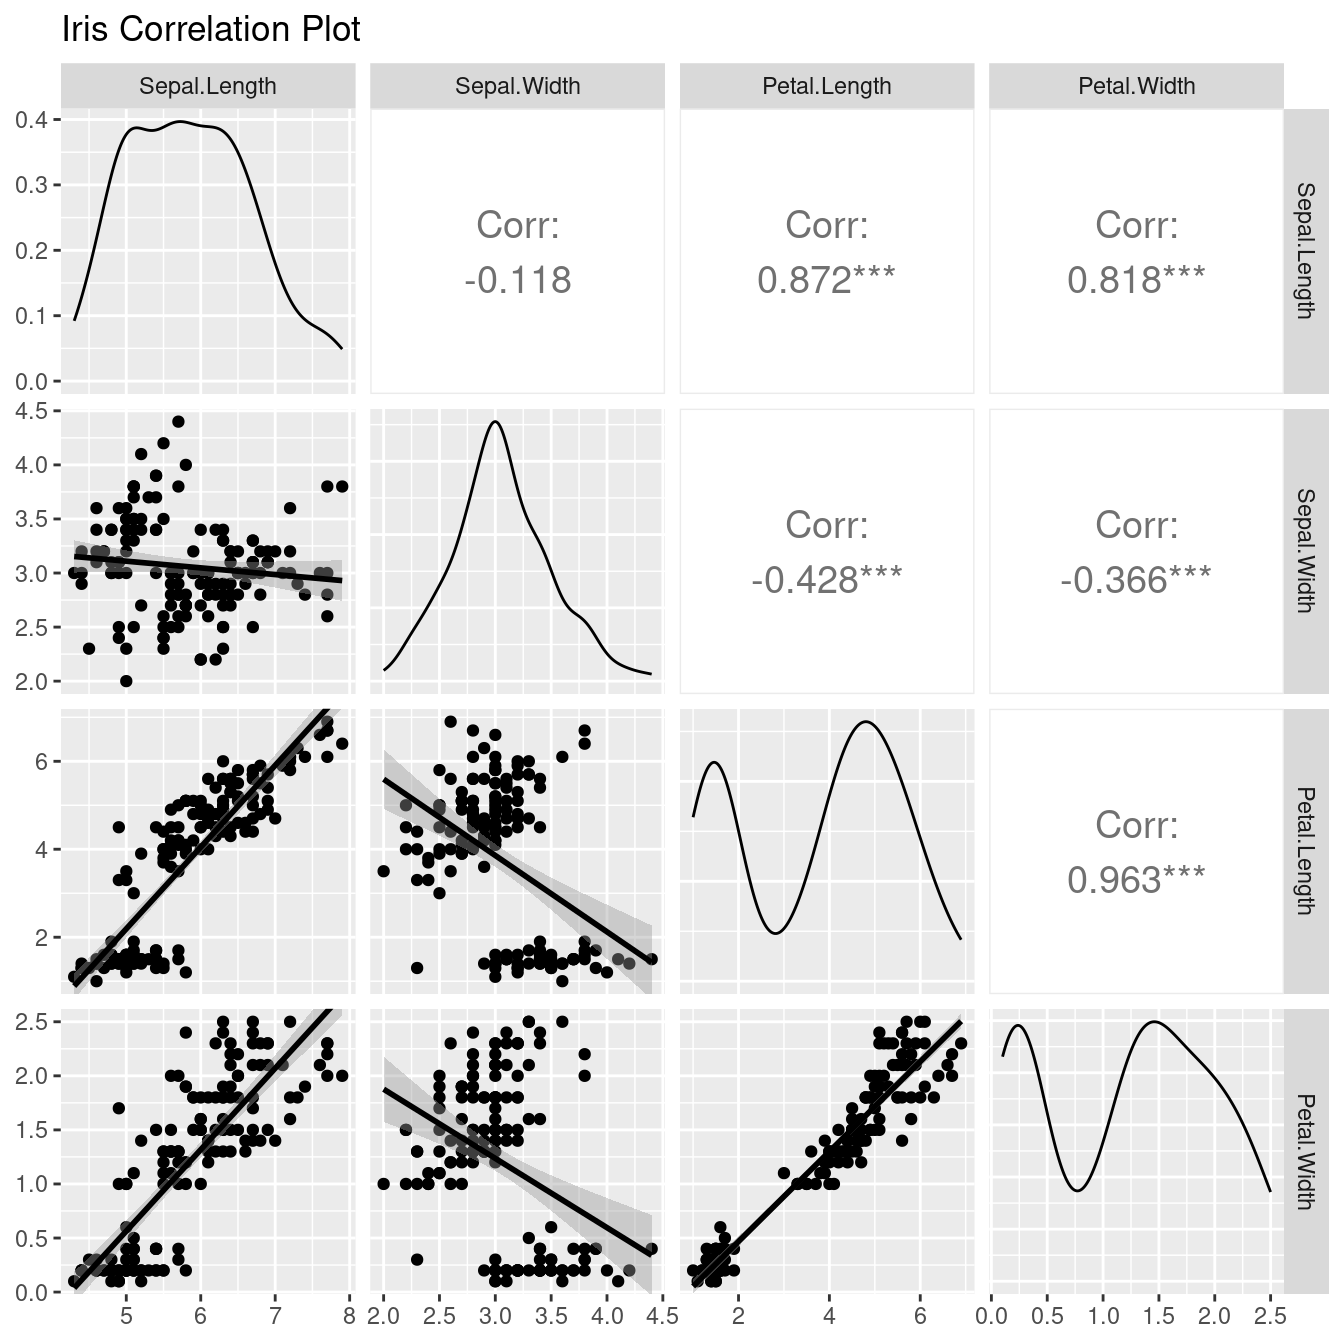
## 3 3.5197665.2.5.3 記得:看摘要統計量一定要有圖來輔助!
尤其是出現雙峰的時候!
library(GGally)## Registered S3 method overwritten by 'GGally':
## method from
## +.gg ggplot2ggpairs(data = iris[1:4],
title = "Iris Correlation Plot",
upper = list(continuous = wrap("cor", size = 5)),
lower = list(continuous = "smooth")
)
5.2.5.4 再請專家skimr
iris %>%
dplyr::group_by(Species) %>%
skimr::skim()| Name | Piped data |
| Number of rows | 150 |
| Number of columns | 5 |
| _______________________ | |
| Column type frequency: | |
| numeric | 4 |
| ________________________ | |
| Group variables | Species |
Variable type: numeric
| skim_variable | Species | n_missing | complete_rate | mean | sd | p0 | p25 | p50 | p75 | p100 | hist |
|---|---|---|---|---|---|---|---|---|---|---|---|
| Sepal.Length | setosa | 0 | 1 | 5.01 | 0.35 | 4.3 | 4.80 | 5.00 | 5.20 | 5.8 | ▃▃▇▅▁ |
| Sepal.Length | versicolor | 0 | 1 | 5.94 | 0.52 | 4.9 | 5.60 | 5.90 | 6.30 | 7.0 | ▂▇▆▃▃ |
| Sepal.Length | virginica | 0 | 1 | 6.59 | 0.64 | 4.9 | 6.23 | 6.50 | 6.90 | 7.9 | ▁▃▇▃▂ |
| Sepal.Width | setosa | 0 | 1 | 3.43 | 0.38 | 2.3 | 3.20 | 3.40 | 3.68 | 4.4 | ▁▃▇▅▂ |
| Sepal.Width | versicolor | 0 | 1 | 2.77 | 0.31 | 2.0 | 2.52 | 2.80 | 3.00 | 3.4 | ▁▅▆▇▂ |
| Sepal.Width | virginica | 0 | 1 | 2.97 | 0.32 | 2.2 | 2.80 | 3.00 | 3.18 | 3.8 | ▂▆▇▅▁ |
| Petal.Length | setosa | 0 | 1 | 1.46 | 0.17 | 1.0 | 1.40 | 1.50 | 1.58 | 1.9 | ▁▃▇▃▁ |
| Petal.Length | versicolor | 0 | 1 | 4.26 | 0.47 | 3.0 | 4.00 | 4.35 | 4.60 | 5.1 | ▂▂▇▇▆ |
| Petal.Length | virginica | 0 | 1 | 5.55 | 0.55 | 4.5 | 5.10 | 5.55 | 5.88 | 6.9 | ▃▇▇▃▂ |
| Petal.Width | setosa | 0 | 1 | 0.25 | 0.11 | 0.1 | 0.20 | 0.20 | 0.30 | 0.6 | ▇▂▂▁▁ |
| Petal.Width | versicolor | 0 | 1 | 1.33 | 0.20 | 1.0 | 1.20 | 1.30 | 1.50 | 1.8 | ▅▇▃▆▁ |
| Petal.Width | virginica | 0 | 1 | 2.03 | 0.27 | 1.4 | 1.80 | 2.00 | 2.30 | 2.5 | ▂▇▆▅▇ |
iris %>%
dplyr::group_by(Species) %>%
my_skim()| Name | Piped data |
| Number of rows | 150 |
| Number of columns | 5 |
| _______________________ | |
| Column type frequency: | |
| numeric | 4 |
| ________________________ | |
| Group variables | Species |
Variable type: numeric
| skim_variable | Species | n_missing | complete_rate | median | iqr | mad | CD | p99 |
|---|---|---|---|---|---|---|---|---|
| Sepal.Length | setosa | 0 | 1 | 5.00 | 0.40 | 0.30 | 0.06 | 5.75 |
| Sepal.Length | versicolor | 0 | 1 | 5.90 | 0.70 | 0.52 | 0.09 | 6.95 |
| Sepal.Length | virginica | 0 | 1 | 6.50 | 0.67 | 0.59 | 0.09 | 7.80 |
| Sepal.Width | setosa | 0 | 1 | 3.40 | 0.48 | 0.37 | 0.11 | 4.30 |
| Sepal.Width | versicolor | 0 | 1 | 2.80 | 0.48 | 0.30 | 0.11 | 3.35 |
| Sepal.Width | virginica | 0 | 1 | 3.00 | 0.38 | 0.30 | 0.10 | 3.80 |
| Petal.Length | setosa | 0 | 1 | 1.50 | 0.18 | 0.15 | 0.10 | 1.90 |
| Petal.Length | versicolor | 0 | 1 | 4.35 | 0.60 | 0.52 | 0.12 | 5.05 |
| Petal.Length | virginica | 0 | 1 | 5.55 | 0.78 | 0.67 | 0.12 | 6.80 |
| Petal.Width | setosa | 0 | 1 | 0.20 | 0.10 | 0.00 | 0.00 | 0.55 |
| Petal.Width | versicolor | 0 | 1 | 1.30 | 0.30 | 0.22 | 0.17 | 1.75 |
| Petal.Width | virginica | 0 | 1 | 2.00 | 0.50 | 0.30 | 0.15 | 2.50 |
5.2.6 加總運算(aggregate)
# aggregate data frame iris by Species, returning means for numeric variables
attach(iris)
aggdata <- aggregate(Sepal.Length,
by = list(Species),
FUN = mean,
na.rm = TRUE)
aggdata## Group.1 x
## 1 setosa 5.006
## 2 versicolor 5.936
## 3 virginica 6.588detach(iris)5.2.6.1 變出「高可讀性的報表」
colnames(aggdata) <- c("Species", "Sepal.Length.mean")
aggdata## Species Sepal.Length.mean
## 1 setosa 5.006
## 2 versicolor 5.936
## 3 virginica 6.5885.2.6.2 ?aggregate
knitr::include_url("https://www.rdocumentation.org/packages/stats/versions/3.6.2/topics/aggregate")5.2.7 圖的摘要統計量
每一張圖都是數字建構出來的,所以畫圖語法的輸出,除了一張圖,還有背後畫圖需要的數字。請看…
5.2.7.1 長條圖
p <- barplot(table(0:9))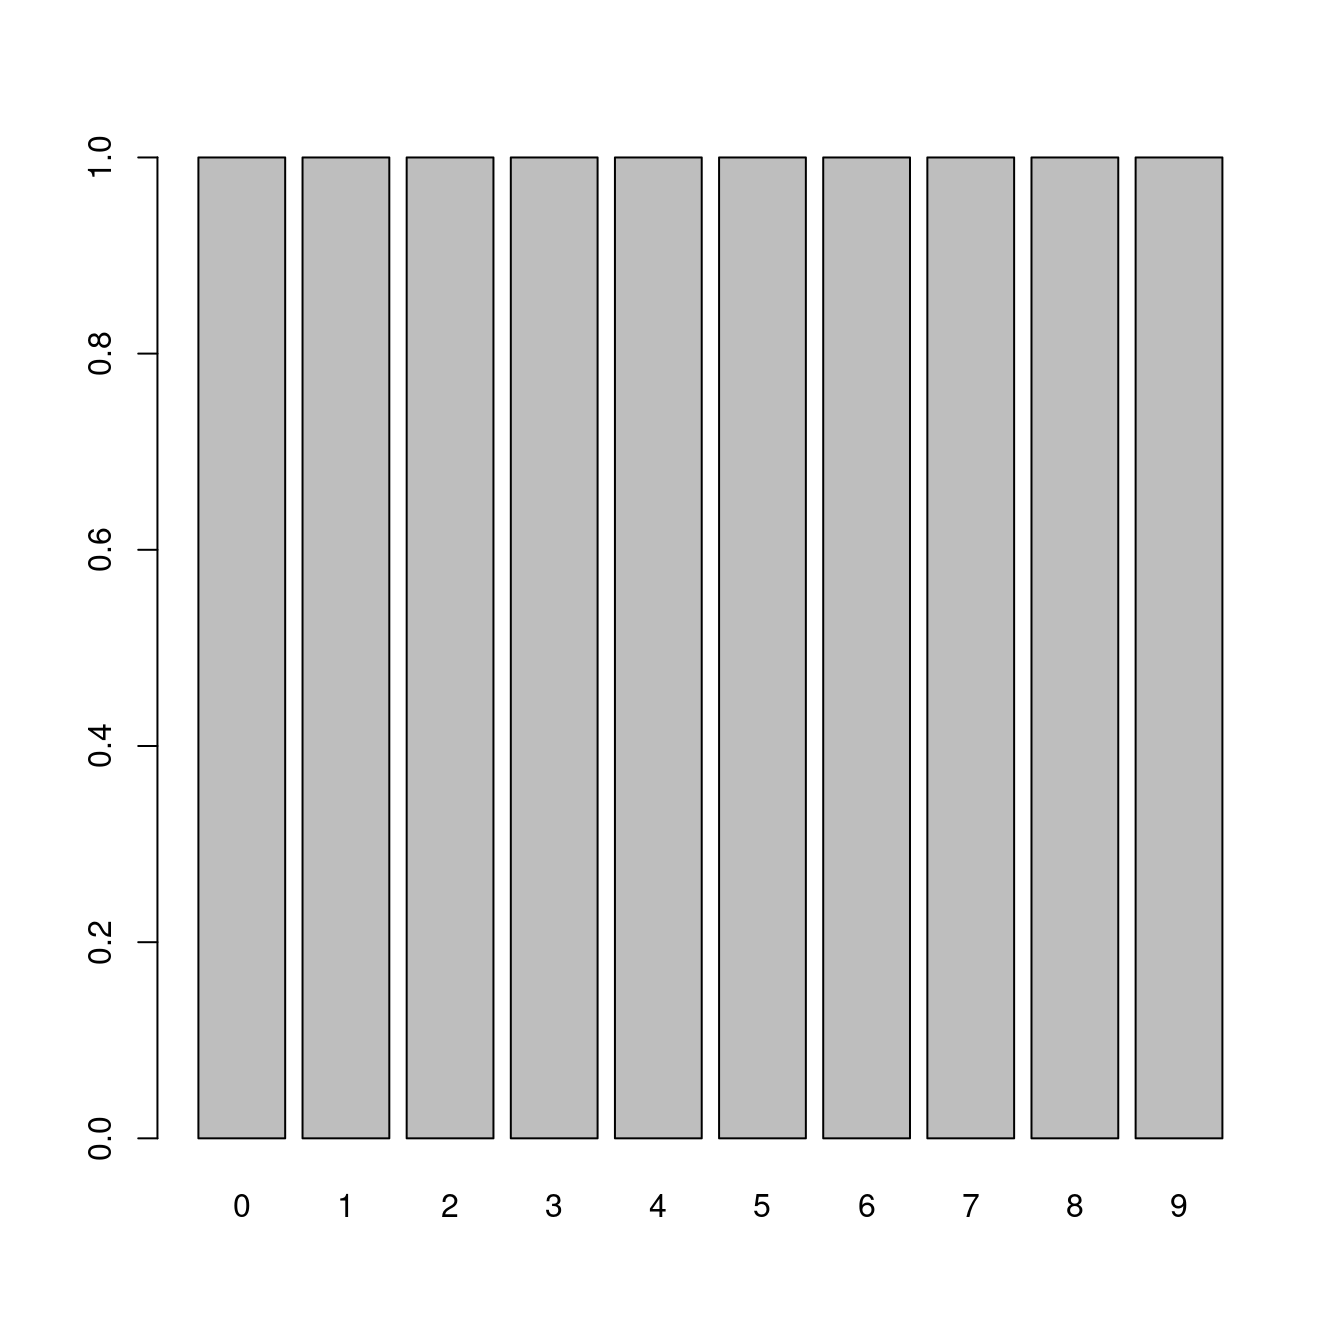
p## [,1]
## [1,] 0.7
## [2,] 1.9
## [3,] 3.1
## [4,] 4.3
## [5,] 5.5
## [6,] 6.7
## [7,] 7.9
## [8,] 9.1
## [9,] 10.3
## [10,] 11.5長條圖留下來的資訊是每一道柱子在x軸的位置,所以我可以用最原始的方式plot示意長條圖的原型:
plot(p, table(0:9), type = "p")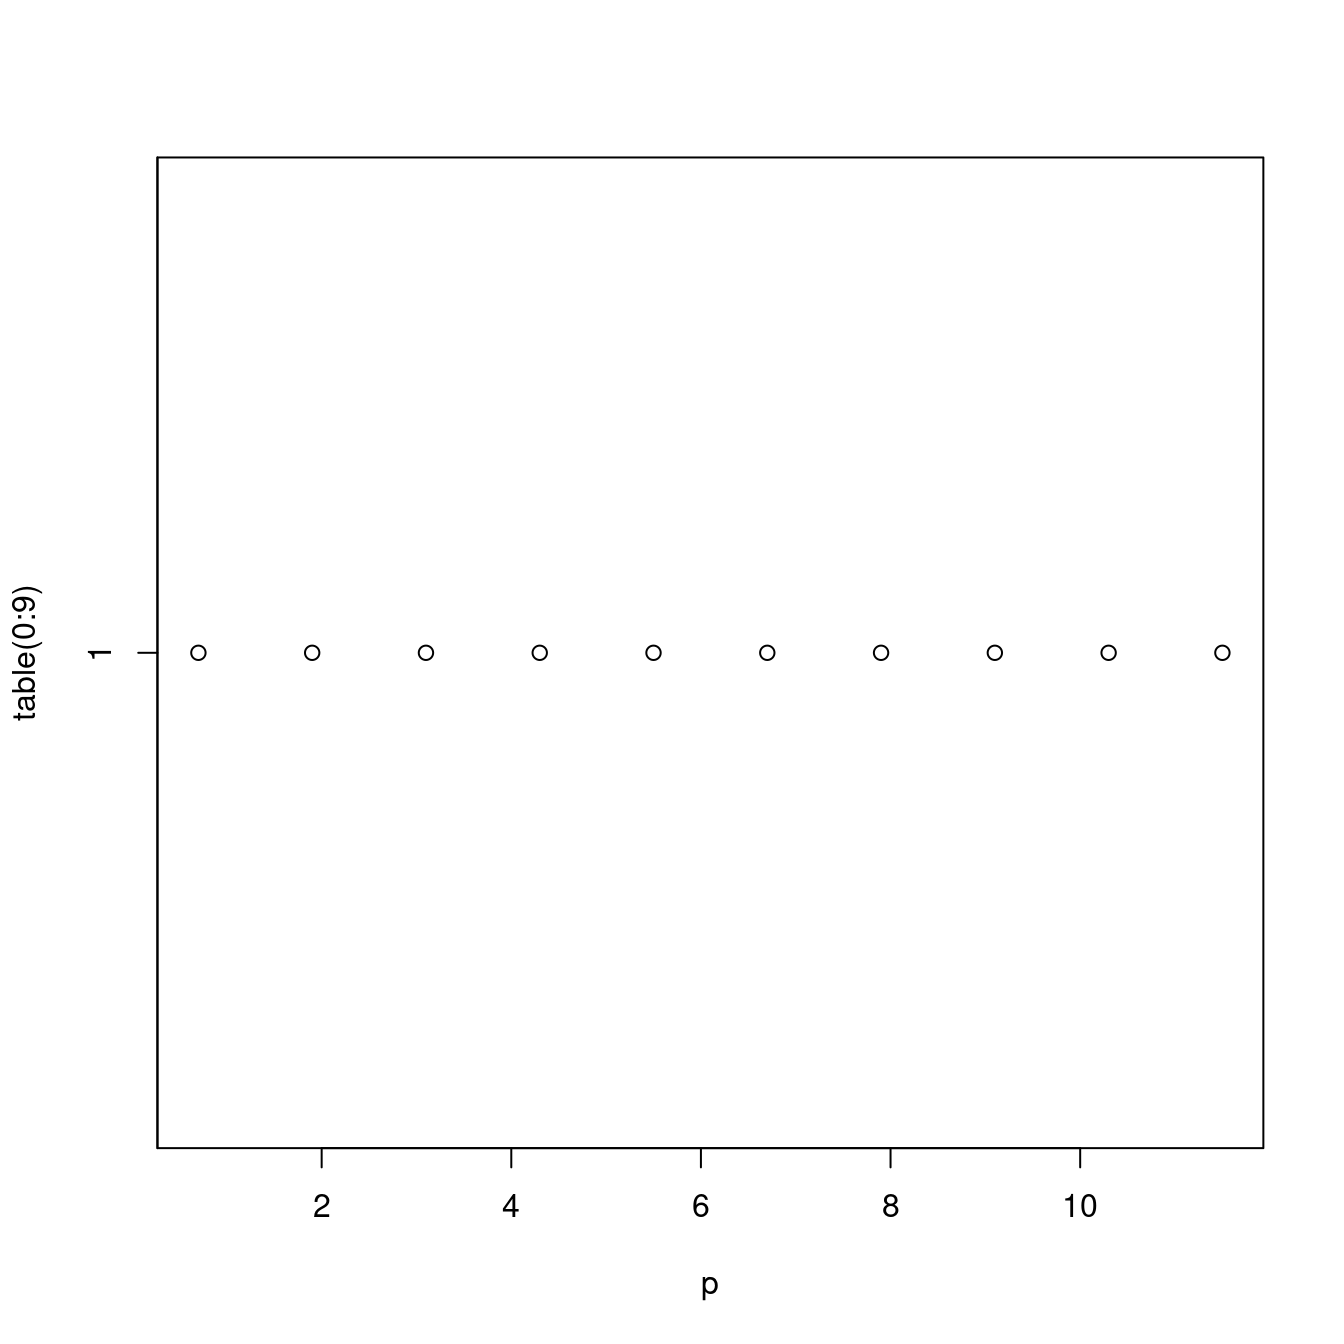
5.2.7.2 直方圖
p <- hist(mtcars$mpg)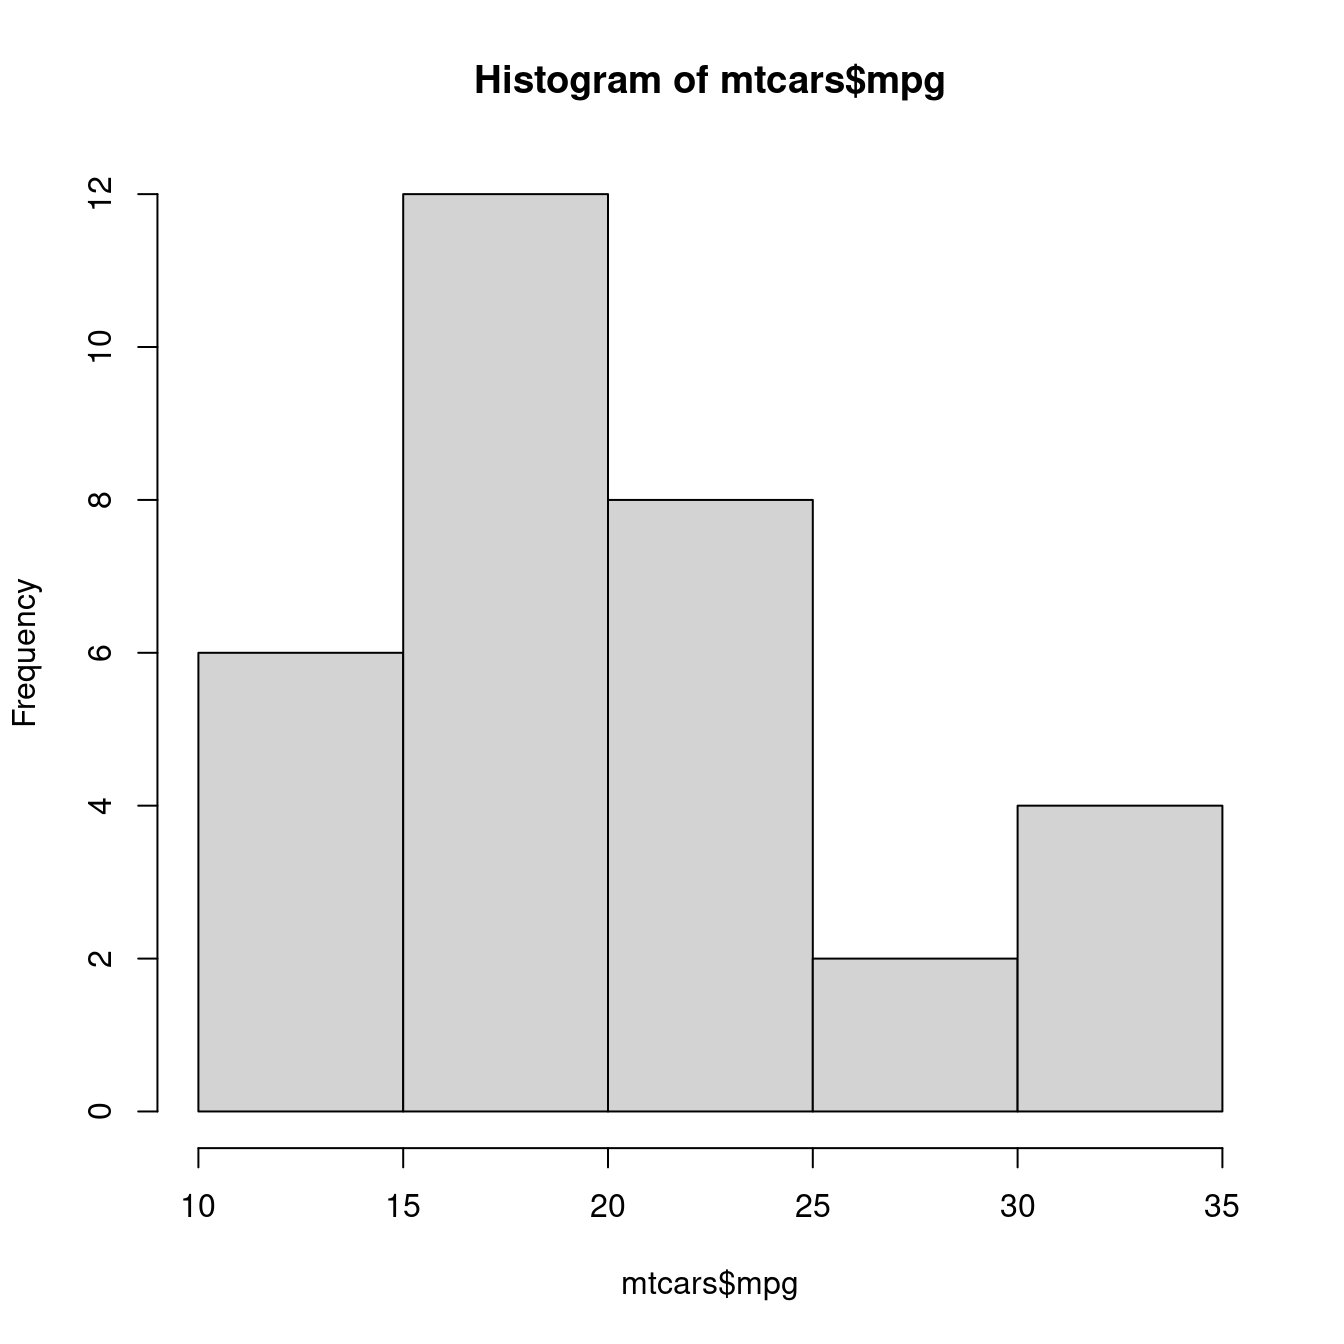
p## $breaks
## [1] 10 15 20 25 30 35
##
## $counts
## [1] 6 12 8 2 4
##
## $density
## [1] 0.0375 0.0750 0.0500 0.0125 0.0250
##
## $mids
## [1] 12.5 17.5 22.5 27.5 32.5
##
## $xname
## [1] "mtcars$mpg"
##
## $equidist
## [1] TRUE
##
## attr(,"class")
## [1] "histogram"直方圖留下來的資訊比較多,而且清楚表達。作者拿「組中點(mids)」跟「絕對次數(counts)」給plot示意一張直方圖的原型:
plot(p$mids, p$counts, type = "p")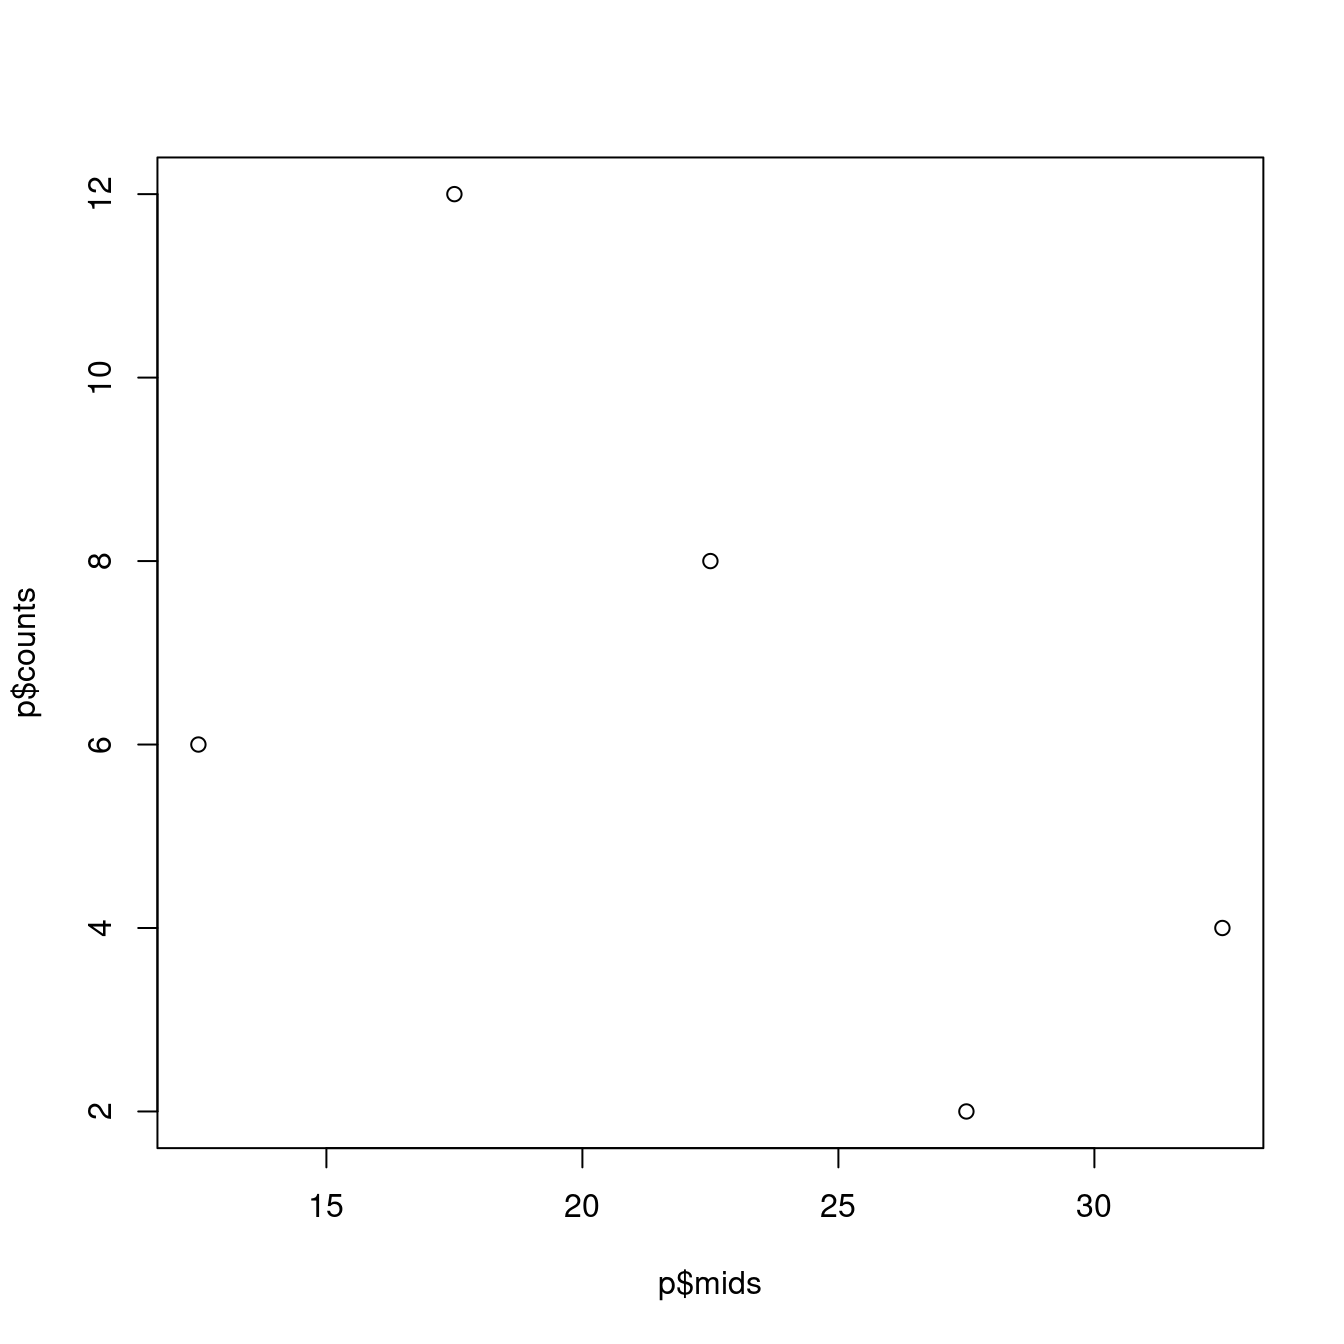
5.3 離群值
…
5.3.2 最大值、最小值
5.3.2.1 抓示範數據
library(ggplot2)
data(mpg)
head(mpg)## # A tibble: 6 × 11
## manufacturer model displ year cyl trans drv cty hwy fl class
## <chr> <chr> <dbl> <int> <int> <chr> <chr> <int> <int> <chr> <chr>
## 1 audi a4 1.8 1999 4 auto(l5) f 18 29 p compa…
## 2 audi a4 1.8 1999 4 manual(m5) f 21 29 p compa…
## 3 audi a4 2 2008 4 manual(m6) f 20 31 p compa…
## 4 audi a4 2 2008 4 auto(av) f 21 30 p compa…
## 5 audi a4 2.8 1999 6 auto(l5) f 16 26 p compa…
## 6 audi a4 2.8 1999 6 manual(m5) f 18 26 p compa…5.3.2.2 呼叫skimr::skim取得摘要統計量報表
library(skimr)
skim(mpg)| Name | mpg |
| Number of rows | 234 |
| Number of columns | 11 |
| _______________________ | |
| Column type frequency: | |
| character | 6 |
| numeric | 5 |
| ________________________ | |
| Group variables | None |
Variable type: character
| skim_variable | n_missing | complete_rate | min | max | empty | n_unique | whitespace |
|---|---|---|---|---|---|---|---|
| manufacturer | 0 | 1 | 4 | 10 | 0 | 15 | 0 |
| model | 0 | 1 | 2 | 22 | 0 | 38 | 0 |
| trans | 0 | 1 | 8 | 10 | 0 | 10 | 0 |
| drv | 0 | 1 | 1 | 1 | 0 | 3 | 0 |
| fl | 0 | 1 | 1 | 1 | 0 | 5 | 0 |
| class | 0 | 1 | 3 | 10 | 0 | 7 | 0 |
Variable type: numeric
| skim_variable | n_missing | complete_rate | mean | sd | p0 | p25 | p50 | p75 | p100 | hist |
|---|---|---|---|---|---|---|---|---|---|---|
| displ | 0 | 1 | 3.47 | 1.29 | 1.6 | 2.4 | 3.3 | 4.6 | 7 | ▇▆▆▃▁ |
| year | 0 | 1 | 2003.50 | 4.51 | 1999.0 | 1999.0 | 2003.5 | 2008.0 | 2008 | ▇▁▁▁▇ |
| cyl | 0 | 1 | 5.89 | 1.61 | 4.0 | 4.0 | 6.0 | 8.0 | 8 | ▇▁▇▁▇ |
| cty | 0 | 1 | 16.86 | 4.26 | 9.0 | 14.0 | 17.0 | 19.0 | 35 | ▆▇▃▁▁ |
| hwy | 0 | 1 | 23.44 | 5.95 | 12.0 | 18.0 | 24.0 | 27.0 | 44 | ▅▅▇▁▁ |
5.3.3 盒型圖
5.3.3.1 只畫盒型圖
boxplot(mpg$hwy,
horizontal = FALSE,
ylim = c(10,50),
xaxt = "n",
col = rgb(0.8,0.8,0,0.5),
frame = F)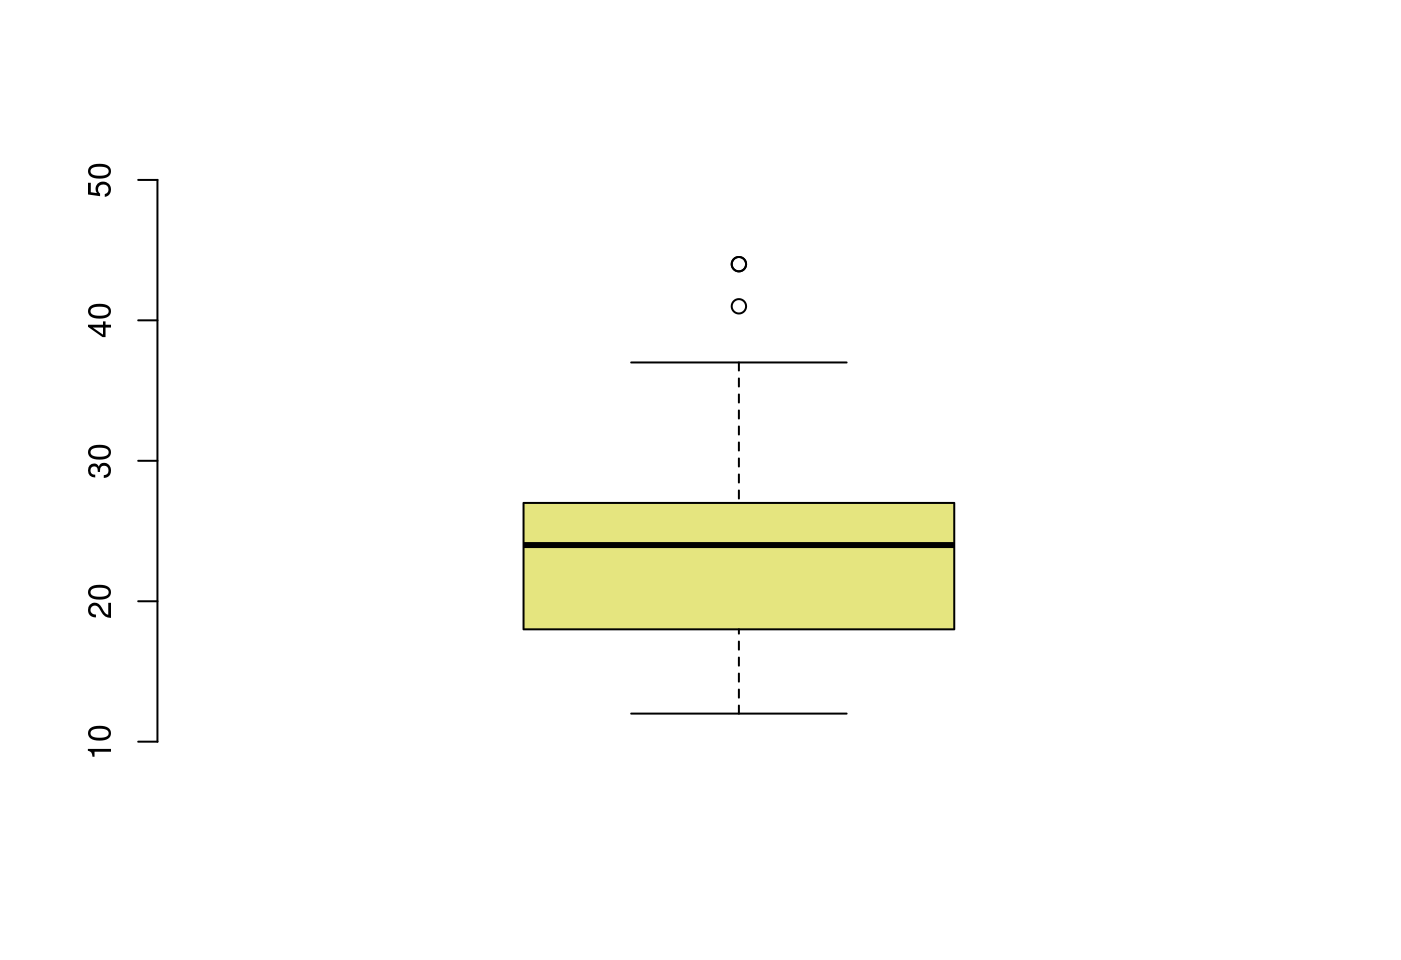
5.3.3.2 盒型圖加直方圖
# Layout to split the screen
layout(mat = matrix(c(1,2), 2, 1, byrow = TRUE), height = c(1,8))## Error in layout.matrix(mat = matrix(c(1, 2), 2, 1, byrow = TRUE), height = c(1, : 缺少引數 "p",也沒有預設值# Draw the boxplot and the histogram
par(mar=c(0, 3.1, 1.1, 2.1))
boxplot(mpg$hwy,
horizontal = TRUE,
ylim = c(10,50),
xaxt = "n",
col = rgb(0.8,0.8,0,0.5),
frame = F)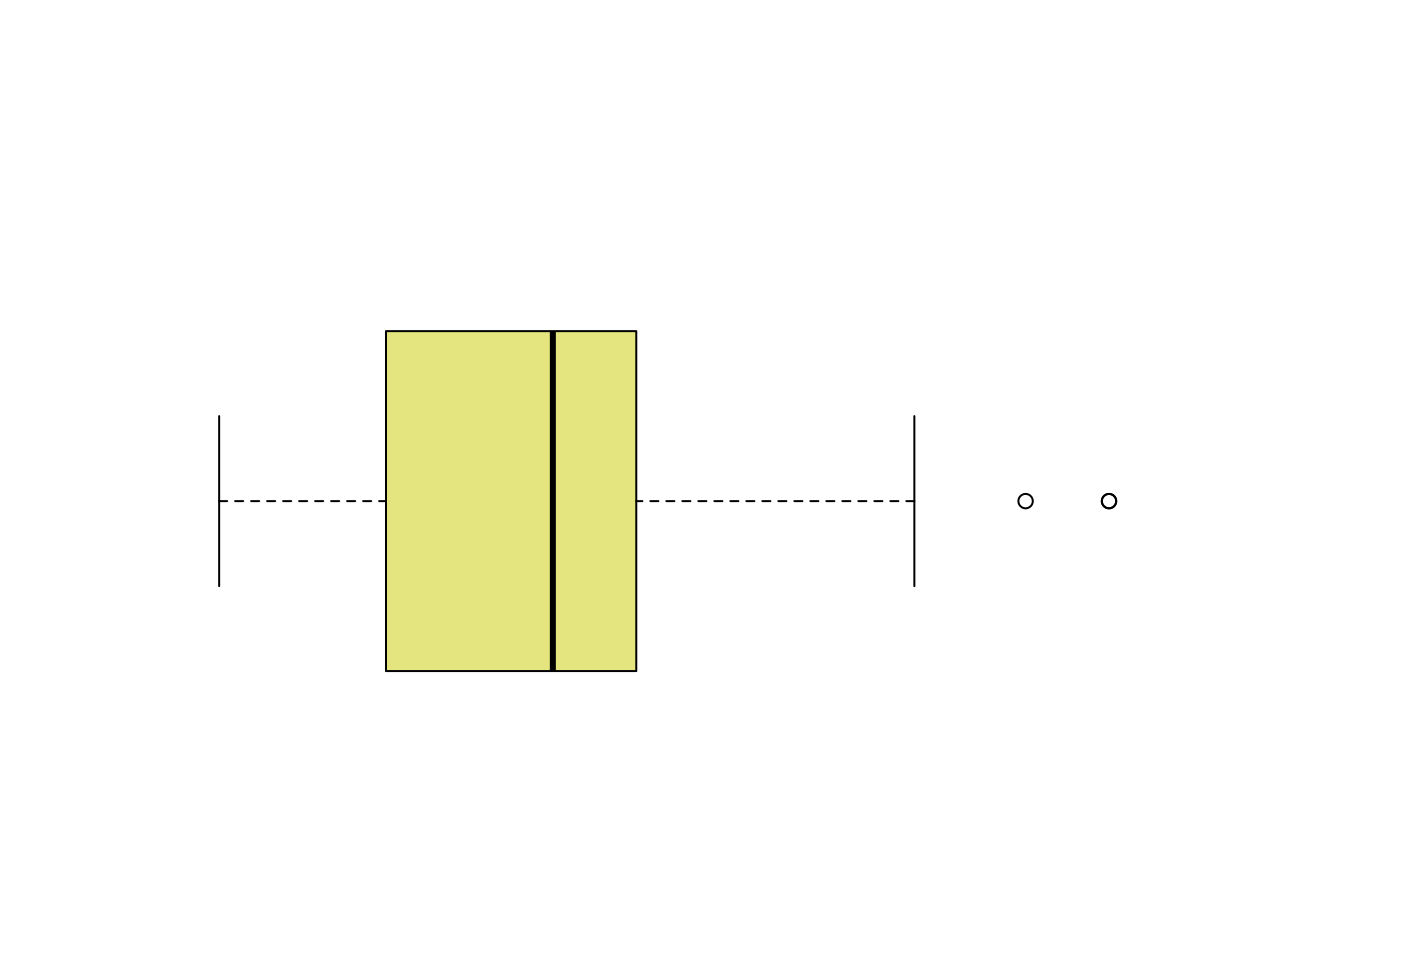
par(mar = c(4, 3.1, 1.1, 2.1))
hist(mpg$hwy,
breaks = 40,
col = rgb(0.2,0.8,0.5,0.5),
border = F,
main = "",
xlab = "",
xlim = c(10,50))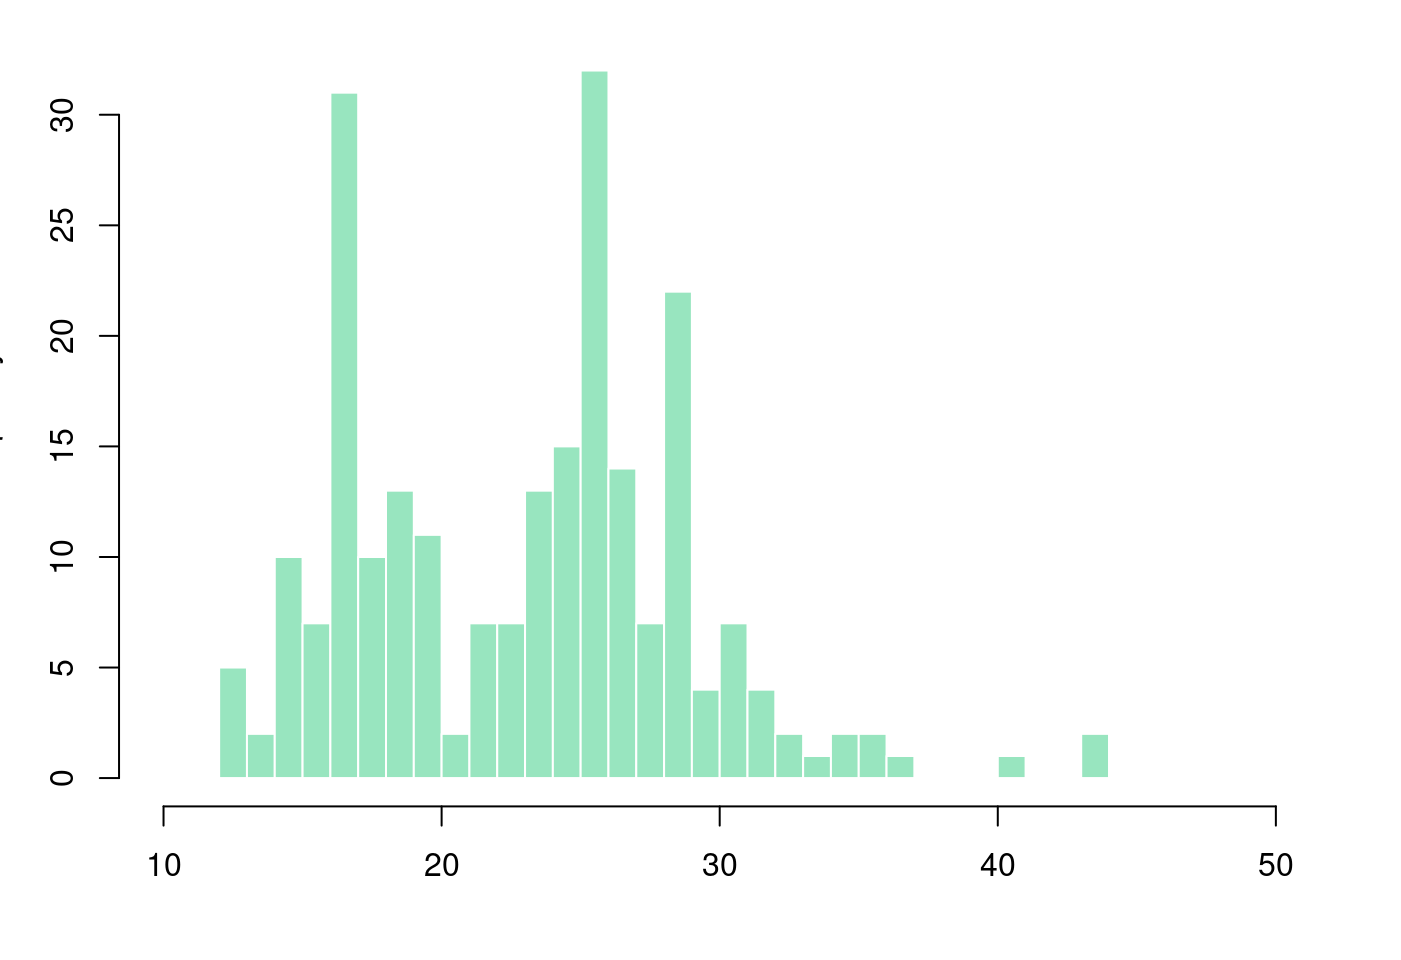
5.3.3.3 盒型圖加直方圖再加密度圖
# Layout to split the screen
layout(mat = matrix(c(1,2), 2, 1, byrow = TRUE), height = c(1,8))## Error in layout.matrix(mat = matrix(c(1, 2), 2, 1, byrow = TRUE), height = c(1, : 缺少引數 "p",也沒有預設值# Draw the boxplot and the histogram
par(mar=c(0, 3.1, 1.1, 2.1))
boxplot(mpg$hwy,
horizontal = TRUE,
ylim = c(10,50),
xaxt = "n",
col = rgb(0.8,0.8,0,0.5),
frame = F)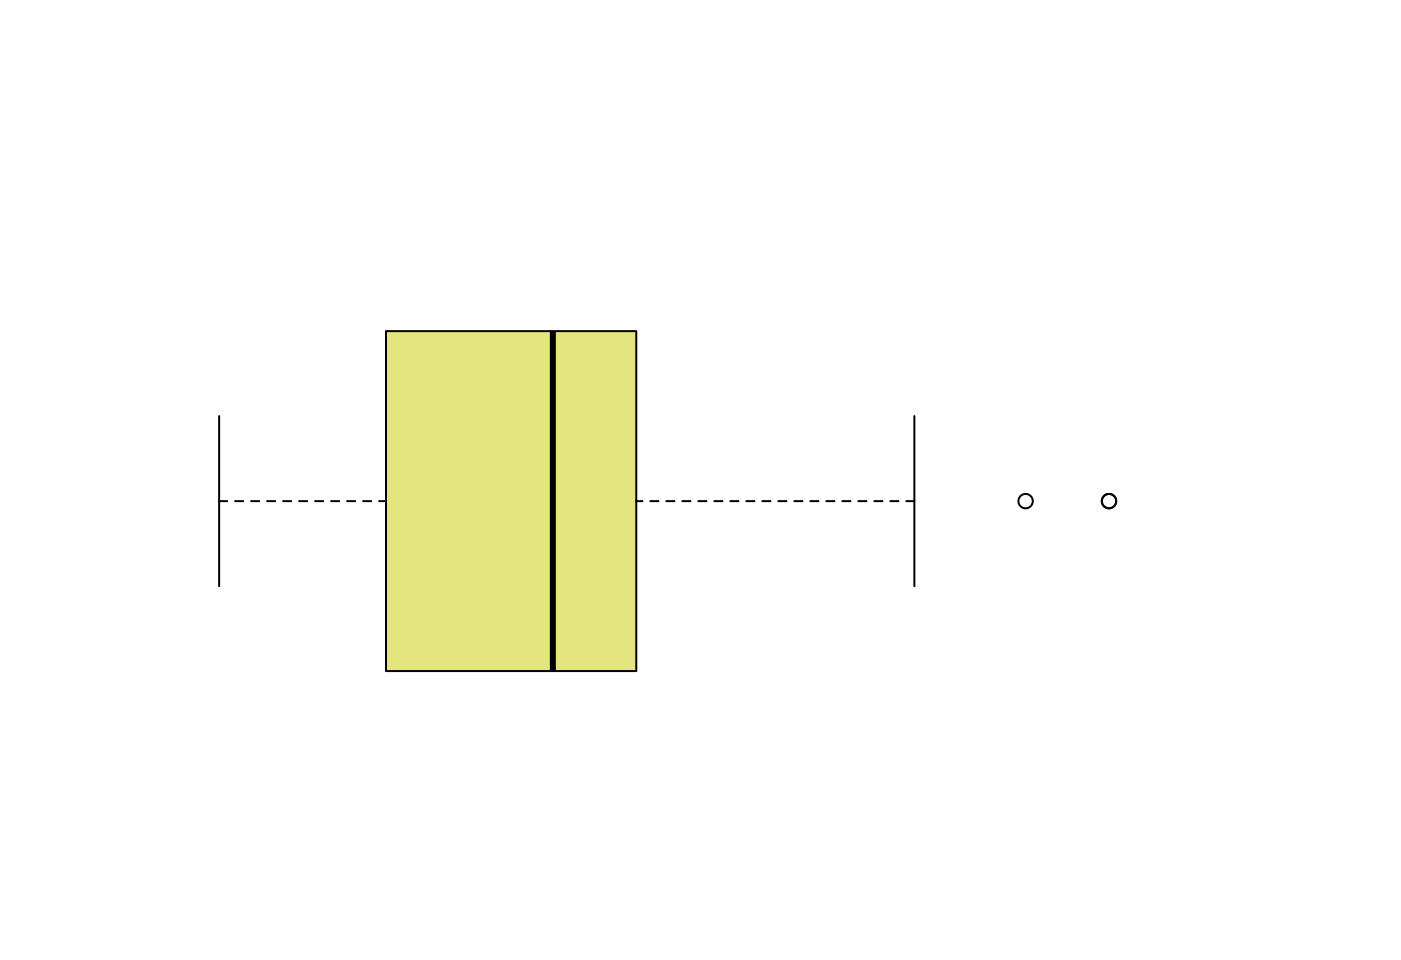
par(mar = c(4, 3.1, 1.1, 2.1))
hist(mpg$hwy,
breaks = 40,
col = rgb(0.2,0.8,0.5,0.5),
border = F,
main = "",
xlab = "",
xlim = c(10,50))
# Kernel Density Plot
d <- density(mpg$hwy) # returns the density data
par(new = TRUE)
plot(d,
col = "red",
axes = FALSE,
main = "",
xlab = "",
xlim = c(10,50)) # plots the results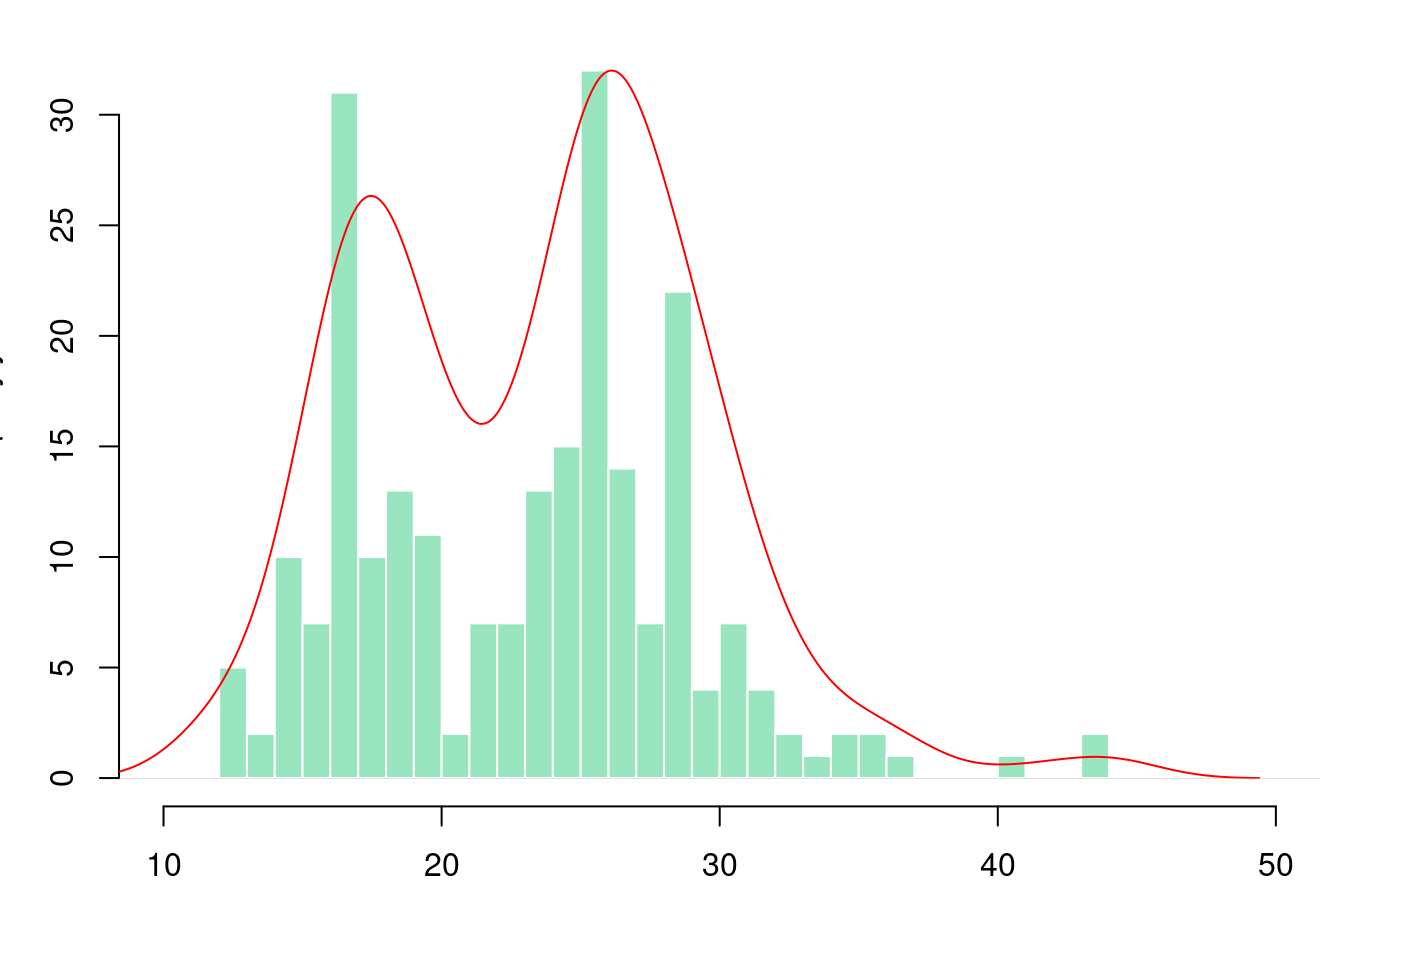
5.3.3.4 離群值在哪裏?離群值多大?多小?
- 取得盒型圖的摘要統計量
boxplot.stats(mpg$hwy)## $stats
## [1] 12 18 24 27 37
##
## $n
## [1] 234
##
## $conf
## [1] 23.07041 24.92959
##
## $out
## [1] 44 44 41- 取得離群值
boxplot.stats(mpg$hwy)$out## [1] 44 44 41- 取得離群值所在的位置
out <- boxplot.stats(mpg$hwy)$out
which(mpg$hwy %in% out)## [1] 213 222 223- 檢視離群值所在的觀察值
mpg[which(mpg$hwy %in% out),]## # A tibble: 3 × 11
## manufacturer model displ year cyl trans drv cty hwy fl class
## <chr> <chr> <dbl> <int> <int> <chr> <chr> <int> <int> <chr> <chr>
## 1 volkswagen jetta 1.9 1999 4 manua… f 33 44 d comp…
## 2 volkswagen new beetle 1.9 1999 4 manua… f 35 44 d subc…
## 3 volkswagen new beetle 1.9 1999 4 auto(… f 29 41 d subc…- 取得專家的證詞?
## # A tibble: 3 × 11
## manufacturer model displ year cyl trans drv cty hwy fl class
## <chr> <chr> <dbl> <int> <int> <chr> <chr> <int> <int> <chr> <chr>
## 1 volkswagen jetta 1.9 1999 4 manua… f 33 44 d comp…
## 2 volkswagen new beetle 1.9 1999 4 manua… f 35 44 d subc…
## 3 volkswagen new beetle 1.9 1999 4 auto(… f 29 41 d subc…## Error in layout.matrix(mat = matrix(c(1, 2), 2, 1, byrow = TRUE), height = c(1, : 缺少引數 "p",也沒有預設值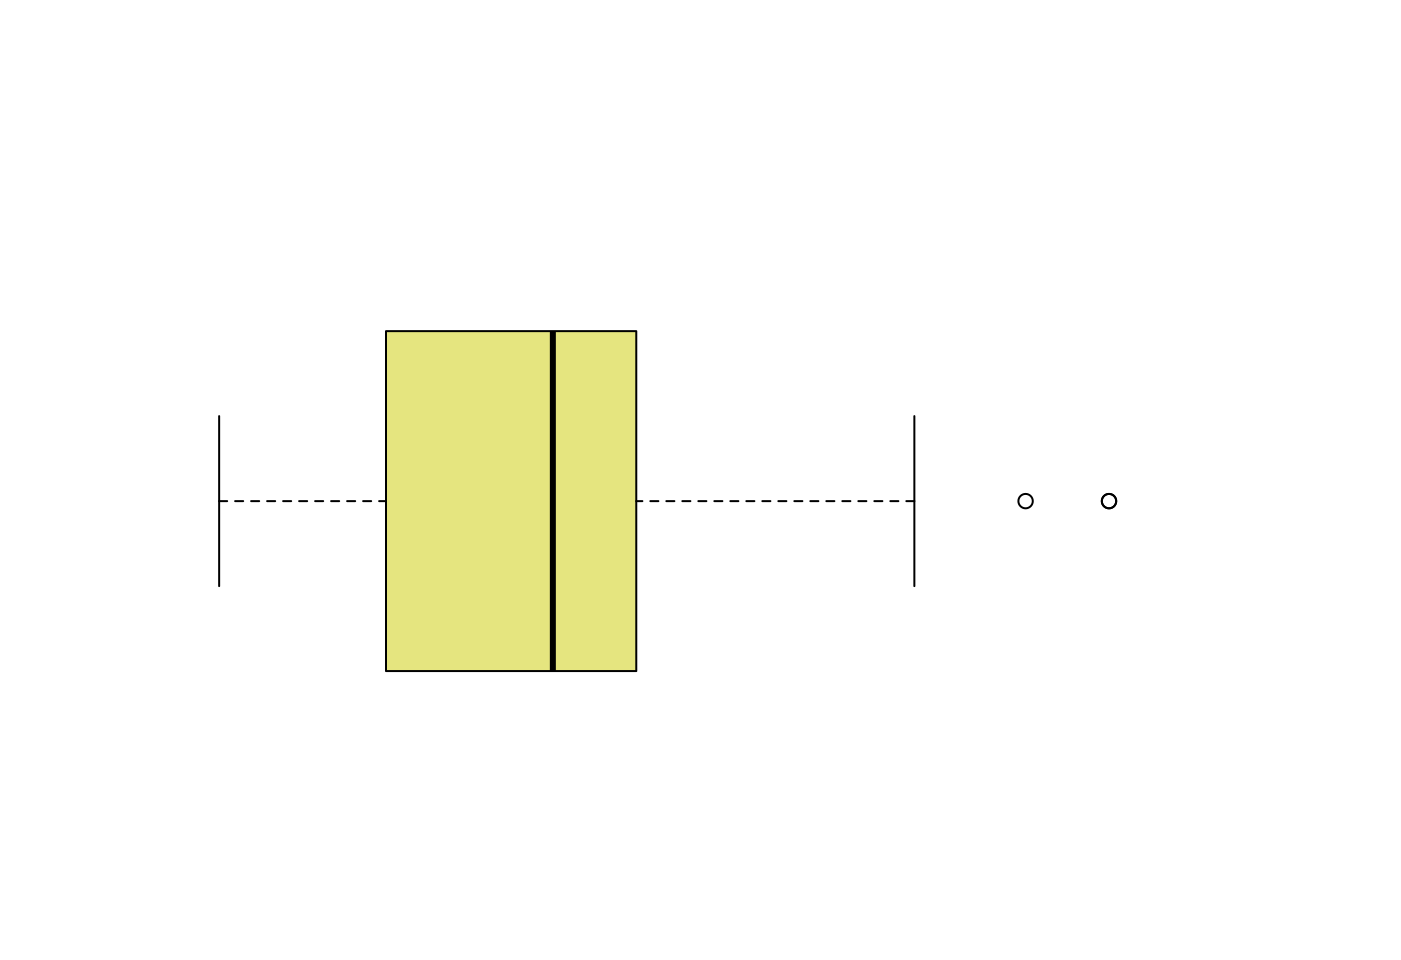
5.3.4 Hampel過濾器
- 定義下界
lower_bound <- median(mpg$hwy) - 3.0 * mad(mpg$hwy)
lower_bound## [1] 1.761- 定義上界
upper_bound <- median(mpg$hwy) + 3.0 * mad(mpg$hwy)
upper_bound## [1] 46.239- 抓離群值
out_ind <- which(mpg$hwy < lower_bound | mpg$hwy > upper_bound)
out_ind## integer(0)if(length(out_ind) == 0){
print("No outliers according to the Hampel filter.")
} else {
out <- mpg$hwy[out_ind]
print(out)
}## [1] "No outliers according to the Hampel filter."5.3.5 Grubbs’s test
呼叫套件,
library(outliers)- 最大值是離群值嗎?
grubbsUP <- grubbs.test(mpg$hwy)
grubbsUP##
## Grubbs test for one outlier
##
## data: mpg$hwy
## G = 3.45274, U = 0.94862, p-value = 0.05555
## alternative hypothesis: highest value 44 is an outlier- 最小值是離群值嗎?
grubbsLOW <- grubbs.test(mpg$hwy, opposite = TRUE)
grubbsLOW##
## Grubbs test for one outlier
##
## data: mpg$hwy
## G = 1.92122, U = 0.98409, p-value = 1
## alternative hypothesis: lowest value 12 is an outlier- 變大最大值之後再來一次!
OLDhwy <- mpg[34, "hwy"] # 保留原始數字
mpg[34, "hwy"] <- 45 # 變大,變成45,因為之前的最大值是44。
grubbsUP <- grubbs.test(mpg$hwy) # 檢定
grubbsUP # 看報表##
## Grubbs test for one outlier
##
## data: mpg$hwy
## G = 3.52134, U = 0.94655, p-value = 0.04242
## alternative hypothesis: highest value 45 is an outliermpg[34, "hwy"] <- OLDhwy # 回復原始數字。5.3.6 Rosner’s test
呼叫套件,
library(EnvStats)檢視報表:
rosner <- rosnerTest(mpg$hwy, k = length(boxplot.stats(mpg$hwy)$out))
rosner## $distribution
## [1] "Normal"
##
## $statistic
## R.1 R.2 R.3
## 3.452739 3.552586 3.131909
##
## $sample.size
## [1] 234
##
## $parameters
## k
## 3
##
## $alpha
## [1] 0.05
##
## $crit.value
## lambda.1 lambda.2 lambda.3
## 3.652091 3.650836 3.649575
##
## $n.outliers
## [1] 0
##
## $alternative
## [1] "Up to 3 observations are not\n from the same Distribution."
##
## $method
## [1] "Rosner's Test for Outliers"
##
## $data
## [1] 29 29 31 30 26 26 27 26 25 28 27 25 25 25 25 24 25 23 20 15 20 17 17 26 23
## [26] 26 25 24 19 14 15 17 27 30 26 29 26 24 24 22 22 24 24 17 22 21 23 23 19 18
## [51] 17 17 19 19 12 17 15 17 17 12 17 16 18 15 16 12 17 17 16 12 15 16 17 15 17
## [76] 17 18 17 19 17 19 19 17 17 17 16 16 17 15 17 26 25 26 24 21 22 23 22 20 33
## [101] 32 32 29 32 34 36 36 29 26 27 30 31 26 26 28 26 29 28 27 24 24 24 22 19 20
## [126] 17 12 19 18 14 15 18 18 15 17 16 18 17 19 19 17 29 27 31 32 27 26 26 25 25
## [151] 17 17 20 18 26 26 27 28 25 25 24 27 25 26 23 26 26 26 26 25 27 25 27 20 20
## [176] 19 17 20 17 29 27 31 31 26 26 28 27 29 31 31 26 26 27 30 33 35 37 35 15 18
## [201] 20 20 22 17 19 18 20 29 26 29 29 24 44 29 26 29 29 29 29 23 24 44 41 29 26
## [226] 28 29 29 29 28 29 26 26 26
##
## $data.name
## [1] "mpg$hwy"
##
## $bad.obs
## [1] 0
##
## $all.stats
## i Mean.i SD.i Value Obs.Num R.i+1 lambda.i+1 Outlier
## 1 0 23.44017 5.954643 44 213 3.452739 3.652091 FALSE
## 2 1 23.35193 5.812124 44 222 3.552586 3.650836 FALSE
## 3 2 23.26293 5.663340 41 223 3.131909 3.649575 FALSE
##
## attr(,"class")
## [1] "gofOutlier"5.4 數據的數據、數字在進化?
…
5.4.2 摘要統計量
5.4.2.1 準備R的公開數據集
set.seed(1233)
library(datasets)
data("iris")
head(iris[sample(1:dim(iris)[1], 100)[1:10],], 10)## Sepal.Length Sepal.Width Petal.Length Petal.Width Species
## 15 5.8 4.0 1.2 0.2 setosa
## 104 6.3 2.9 5.6 1.8 virginica
## 130 7.2 3.0 5.8 1.6 virginica
## 97 5.7 2.9 4.2 1.3 versicolor
## 65 5.6 2.9 3.6 1.3 versicolor
## 43 4.4 3.2 1.3 0.2 setosa
## 66 6.7 3.1 4.4 1.4 versicolor
## 27 5.0 3.4 1.6 0.4 setosa
## 74 6.1 2.8 4.7 1.2 versicolor
## 119 7.7 2.6 6.9 2.3 virginica5.4.2.2 summary
summary(iris)## Sepal.Length Sepal.Width Petal.Length Petal.Width
## Min. :4.300 Min. :2.000 Min. :1.000 Min. :0.100
## 1st Qu.:5.100 1st Qu.:2.800 1st Qu.:1.600 1st Qu.:0.300
## Median :5.800 Median :3.000 Median :4.350 Median :1.300
## Mean :5.843 Mean :3.057 Mean :3.758 Mean :1.199
## 3rd Qu.:6.400 3rd Qu.:3.300 3rd Qu.:5.100 3rd Qu.:1.800
## Max. :7.900 Max. :4.400 Max. :6.900 Max. :2.500
## Species
## setosa :50
## versicolor:50
## virginica :50
##
##
## 5.4.2.3 skimr::skim
- 呼叫
skimr。
library(skimr)- 呼叫
skimr::skim
skimr::skim(iris)| Name | iris |
| Number of rows | 150 |
| Number of columns | 5 |
| _______________________ | |
| Column type frequency: | |
| factor | 1 |
| numeric | 4 |
| ________________________ | |
| Group variables | None |
Variable type: factor
| skim_variable | n_missing | complete_rate | ordered | n_unique | top_counts |
|---|---|---|---|---|---|
| Species | 0 | 1 | FALSE | 3 | set: 50, ver: 50, vir: 50 |
Variable type: numeric
| skim_variable | n_missing | complete_rate | mean | sd | p0 | p25 | p50 | p75 | p100 | hist |
|---|---|---|---|---|---|---|---|---|---|---|
| Sepal.Length | 0 | 1 | 5.84 | 0.83 | 4.3 | 5.1 | 5.80 | 6.4 | 7.9 | ▆▇▇▅▂ |
| Sepal.Width | 0 | 1 | 3.06 | 0.44 | 2.0 | 2.8 | 3.00 | 3.3 | 4.4 | ▁▆▇▂▁ |
| Petal.Length | 0 | 1 | 3.76 | 1.77 | 1.0 | 1.6 | 4.35 | 5.1 | 6.9 | ▇▁▆▇▂ |
| Petal.Width | 0 | 1 | 1.20 | 0.76 | 0.1 | 0.3 | 1.30 | 1.8 | 2.5 | ▇▁▇▅▃ |
5.4.3 統計量在進化
5.4.3.2 到底1, 2, 3可以再生出多少數字?
5.4.3.2.1 一個接著一個冒出來
min
min(1:3)## [1] 1sort(1:3)[1]## [1] 1max
max(1:3)## [1] 3sort(1:3)[3]## [1] 3median
median(1:3)## [1] 2Q1
quantile(1:3, probs = 0.25)## 25%
## 1.5Q3
quantile(1:3, probs = 0.75)## 75%
## 2.5range
range(1:3)## [1] 1 3range(1:3)[2] - range(1:3)[1]## [1] 2diff(range(1:3))## [1] 2IQR
IQR(1:3)## [1] 1quantile(1:3, probs = 0.75) - quantile(1:3, probs = 0.25)## 75%
## 1sum
sum(1:3)## [1] 61 + 2 + 3## [1] 6mean
mean(1:3)## [1] 2sum(1:3)/length(1:3)## [1] 2m1
moments::moment(1:3, order = 1)## [1] 2(1 + 2 + 3)/3## [1] 2m2
moments::moment(1:3, order = 2)## [1] 4.666667(1^2 + 2^2 + 3^2)/3## [1] 4.666667m3
moments::moment(1:3, order = 3)## [1] 12(1^3 + 2^3 + 3^3)/3## [1] 12var
var(1:3)## [1] 1sum((1:3 - mean(1:3))^2)/(3 - 1)## [1] 1sd
sd(1:3)## [1] 1sqrt(sum((1:3 - mean(1:3))^2)/(3 - 1))## [1] 1muStat::stdev(1:3, unbiased = TRUE)## Error in loadNamespace(x): 不存在叫 'muStat' 這個名稱的套件var_pop
sjstats::var_pop(1:3)## [1] 0.6666667sum((1:3 - mean(1:3))^2)/3## [1] 0.6666667sd_pop
sjstats::sd_pop(1:3)## [1] 0.8164966sqrt(sum((1:3 - mean(1:3))^2)/3)## [1] 0.8164966muStat::stdev(1:3, unbiased = FALSE)## Error in loadNamespace(x): 不存在叫 'muStat' 這個名稱的套件sqrt(muStat::stdev(1:3, unbiased = FALSE))## Error in loadNamespace(x): 不存在叫 'muStat' 這個名稱的套件mad
mad(1:3)## [1] 1.48261.4826 * median(abs(1-2),abs(2-2),abs(3-2))## [1] 1.4826cv
EnvStats::cv(1:3)## [1] 0.5sd(1:3)/mean(1:3)## [1] 0.5CD
mad(1:3)/median(1:3)## [1] 0.7413skewness
moments::skewness(1:3)## [1] 0kurtosis
moments::kurtosis(1:3)## [1] 1.5NROW
NROW(1:3)## [1] 3prod
prod(1:3)## [1] 61 * 2 * 3## [1] 6mean
mean(c(1:3, 8, 9))## [1] 4.6mean(log(c(1:3, 8, 9)))## [1] 1.213685sd
sd(c(1:3, 8, 9))## [1] 3.646917sd(log(c(1:3, 8, 9)))## [1] 0.9319492slope
x <- 1:3
y <- x
lm(y ~ x)$coefficients[2]## x
## 1slope > 0
x <- 1:3
y <- x
slope <- lm(y ~ x)$coefficients[2]
ifelse(slope > 0, 1, 0)## x
## 1E(log(x))
mean(log(1:3))## [1] 0.5972532(log(1) + log(2) + log(3))/3## [1] 0.59725325.4.3.2.2 整合成智庫
- 第一階統計量
my_skim01 <- skim_with(
numeric = sfl(min = min,
max = max,
median = median,
mean = mean,
Q1 = ~ quantile(., probs = .25),
Q3 = ~ quantile(., probs = .75)),
append = FALSE
)
my_skim01(iris)| Name | iris |
| Number of rows | 150 |
| Number of columns | 5 |
| _______________________ | |
| Column type frequency: | |
| factor | 1 |
| numeric | 4 |
| ________________________ | |
| Group variables | None |
Variable type: factor
| skim_variable | n_missing | complete_rate | ordered | n_unique | top_counts |
|---|---|---|---|---|---|
| Species | 0 | 1 | FALSE | 3 | set: 50, ver: 50, vir: 50 |
Variable type: numeric
| skim_variable | n_missing | complete_rate | min | max | median | mean | Q1 | Q3 |
|---|---|---|---|---|---|---|---|---|
| Sepal.Length | 0 | 1 | 4.3 | 7.9 | 5.80 | 5.84 | 5.1 | 6.4 |
| Sepal.Width | 0 | 1 | 2.0 | 4.4 | 3.00 | 3.06 | 2.8 | 3.3 |
| Petal.Length | 0 | 1 | 1.0 | 6.9 | 4.35 | 3.76 | 1.6 | 5.1 |
| Petal.Width | 0 | 1 | 0.1 | 2.5 | 1.30 | 1.20 | 0.3 | 1.8 |
- 第二階統計量
my_skim02 <- skim_with(
numeric = sfl(range = ~ diff(range(.)),
IQR = IQR,
mad = mad,
var = var,
sd = sd,
m2 = ~ moments::moment(., order = 2)),
append = FALSE
)
my_skim02(iris)| Name | iris |
| Number of rows | 150 |
| Number of columns | 5 |
| _______________________ | |
| Column type frequency: | |
| factor | 1 |
| numeric | 4 |
| ________________________ | |
| Group variables | None |
Variable type: factor
| skim_variable | n_missing | complete_rate | ordered | n_unique | top_counts |
|---|---|---|---|---|---|
| Species | 0 | 1 | FALSE | 3 | set: 50, ver: 50, vir: 50 |
Variable type: numeric
| skim_variable | n_missing | complete_rate | range | IQR | mad | var | sd | m2 |
|---|---|---|---|---|---|---|---|---|
| Sepal.Length | 0 | 1 | 3.6 | 1.3 | 1.04 | 0.69 | 0.83 | 34.83 |
| Sepal.Width | 0 | 1 | 2.4 | 0.5 | 0.44 | 0.19 | 0.44 | 9.54 |
| Petal.Length | 0 | 1 | 5.9 | 3.5 | 1.85 | 3.12 | 1.77 | 17.22 |
| Petal.Width | 0 | 1 | 2.4 | 1.5 | 1.04 | 0.58 | 0.76 | 2.02 |
- 高階統計量
my_skim03 <- skim_with(
numeric = sfl(skewness = ~ moments::skewness(.),
kurtosis = ~ moments::kurtosis(.)),
append = FALSE
)
my_skim03(iris)| Name | iris |
| Number of rows | 150 |
| Number of columns | 5 |
| _______________________ | |
| Column type frequency: | |
| factor | 1 |
| numeric | 4 |
| ________________________ | |
| Group variables | None |
Variable type: factor
| skim_variable | n_missing | complete_rate | ordered | n_unique | top_counts |
|---|---|---|---|---|---|
| Species | 0 | 1 | FALSE | 3 | set: 50, ver: 50, vir: 50 |
Variable type: numeric
| skim_variable | n_missing | complete_rate | skewness | kurtosis |
|---|---|---|---|---|
| Sepal.Length | 0 | 1 | 0.31 | 2.43 |
| Sepal.Width | 0 | 1 | 0.32 | 3.18 |
| Petal.Length | 0 | 1 | -0.27 | 1.60 |
| Petal.Width | 0 | 1 | -0.10 | 1.66 |
- 統計量的函數
CD <- function(x){
mad(x) / median(x)
}
my_skim04 <- skim_with(
numeric = sfl(CV = EnvStats::cv,
CD = CD),
append = FALSE
)
my_skim04(iris)| Name | iris |
| Number of rows | 150 |
| Number of columns | 5 |
| _______________________ | |
| Column type frequency: | |
| factor | 1 |
| numeric | 4 |
| ________________________ | |
| Group variables | None |
Variable type: factor
| skim_variable | n_missing | complete_rate | ordered | n_unique | top_counts |
|---|---|---|---|---|---|
| Species | 0 | 1 | FALSE | 3 | set: 50, ver: 50, vir: 50 |
Variable type: numeric
| skim_variable | n_missing | complete_rate | CV | CD |
|---|---|---|---|---|
| Sepal.Length | 0 | 1 | 0.14 | 0.18 |
| Sepal.Width | 0 | 1 | 0.14 | 0.15 |
| Petal.Length | 0 | 1 | 0.47 | 0.43 |
| Petal.Width | 0 | 1 | 0.64 | 0.80 |
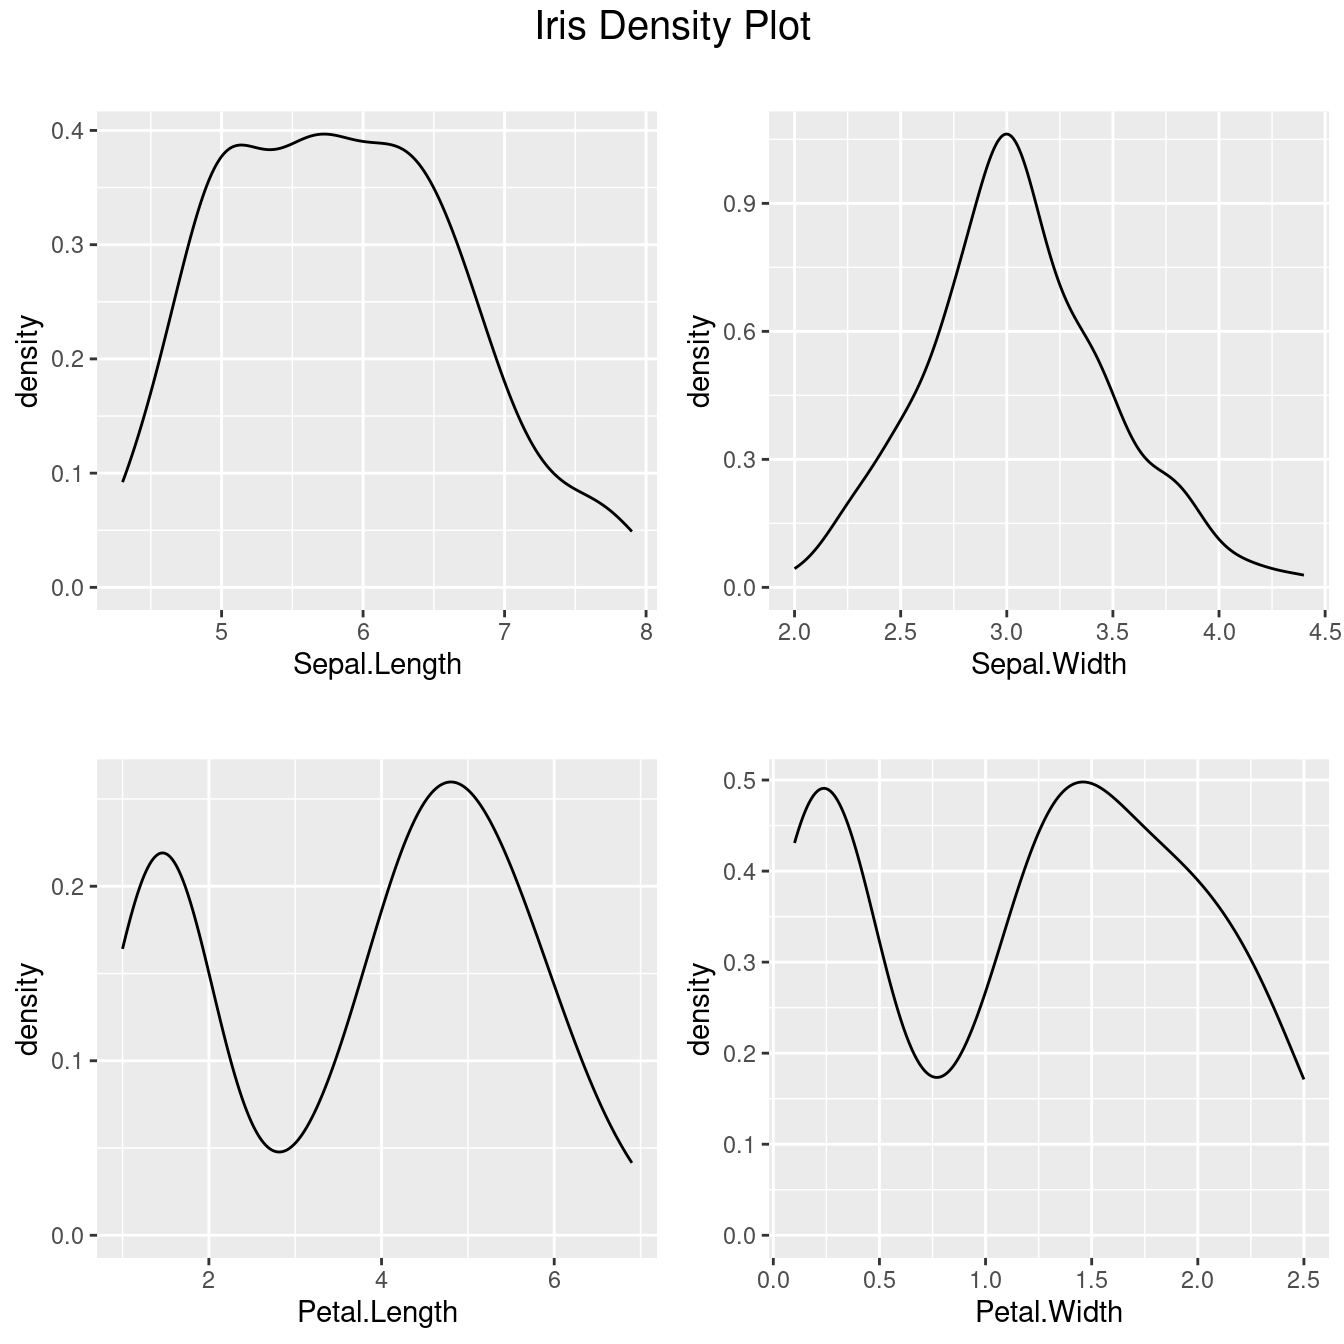
- 樣本密度圖
library(ggplot2)
library(grid)
library(gridExtra)
library(GGally)
DhistSl <- ggally_densityDiag(data = iris[1],
mapping = ggplot2::aes(x = Sepal.Length))
DhistSw <- ggally_densityDiag(data = iris[2],
mapping = ggplot2::aes(x = Sepal.Width))
DhistPl <- ggally_densityDiag(data = iris[3],
mapping = ggplot2::aes(x = Petal.Length))
DhistPw <- ggally_densityDiag(data = iris[4],
mapping = ggplot2::aes(x = Petal.Width))
# Plot all density visualizations
grid.arrange(DhistSl + ggtitle(""),
DhistSw + ggtitle(""),
DhistPl + ggtitle(""),
DhistPw + ggtitle(""),
nrow = 2,
top = textGrob("Iris Density Plot", gp = gpar(fontsize=15))
)
5.4.4 創造數字
library(readxl)
library(dplyr)5.4.4.1 準備八張原始數據表
Customers <- read_excel("data/Northwind/Customers.xlsx")
Customers %>% slice(1:3)## # A tibble: 3 × 7
## CustomerID CustomerName ContactName Address City PostalCode Country
## <dbl> <chr> <chr> <chr> <chr> <chr> <chr>
## 1 1 Alfreds Futterkiste Maria Ande… Obere … Berl… 12209.0 Germany
## 2 2 Ana Trujillo Empareda… Ana Trujil… Avda. … Méxi… 5021.0 Mexico
## 3 3 Antonio Moreno Taquer… Antonio Mo… Matade… Méxi… 5023.0 MexicoCategories <- read_excel("data/Northwind/Categories.xlsx")
Categories %>% slice(1:3)## # A tibble: 3 × 3
## CategoryID CategoryName Description
## <dbl> <chr> <chr>
## 1 1 Beverages Soft drinks, coffees, teas, beers, and ales
## 2 2 Condiments Sweet and savory sauces, relishes, spreads, and seaso…
## 3 3 Confections Desserts, candies, and sweet breadsEmployees <- read_excel("data/Northwind/Employees.xlsx")
Employees %>% slice(1:3)## # A tibble: 3 × 6
## EmployeeID LastName FirstName BirthDate Photo Notes
## <dbl> <chr> <chr> <dttm> <chr> <chr>
## 1 1 Davolio Nancy 1968-12-08 00:00:00 EmpID1.pic Education inclu…
## 2 2 Fuller Andrew 1952-02-19 00:00:00 EmpID2.pic Andrew received…
## 3 3 Leverling Janet 1963-08-30 00:00:00 EmpID3.pic Janet has a BS …OrderDetails <- read_excel("data/Northwind/OrderDetails.xlsx")
OrderDetails %>% slice(1:3)## # A tibble: 3 × 4
## OrderDetailID OrderID ProductID Quantity
## <dbl> <dbl> <dbl> <dbl>
## 1 1 10248 11 12
## 2 2 10248 42 10
## 3 3 10248 72 5Orders <- read_excel("data/Northwind/Orders.xlsx")
Orders %>% slice(1:3)## # A tibble: 3 × 5
## OrderID CustomerID EmployeeID OrderDate ShipperID
## <dbl> <dbl> <dbl> <dttm> <dbl>
## 1 10248 90 5 1996-07-04 00:00:00 3
## 2 10249 81 6 1996-07-05 00:00:00 1
## 3 10250 34 4 1996-07-08 00:00:00 2Products <- read_excel("data/Northwind/Products.xlsx")
Products %>% slice(1:3)## # A tibble: 3 × 6
## ProductID ProductName SupplierID CategoryID Unit Price
## <dbl> <chr> <dbl> <dbl> <chr> <dbl>
## 1 1 Chais 1 1 10 boxes x 20 bags 18
## 2 2 Chang 1 1 24 - 12 oz bottles 19
## 3 3 Aniseed Syrup 1 2 12 - 550 ml bottles 10Shippers <- read_excel("data/Northwind/Shippers.xlsx")
Shippers %>% slice(1:3)## # A tibble: 3 × 3
## ShipperID ShipperName Phone
## <dbl> <chr> <chr>
## 1 1 Speedy Express (503) 555-9831
## 2 2 United Package (503) 555-3199
## 3 3 Federal Shipping (503) 555-9931Suppliers <- read_excel("data/Northwind/Suppliers.xlsx")
Suppliers %>% slice(1:3)## # A tibble: 3 × 8
## SupplierID SupplierName ContactName Address City PostalCode Country Phone
## <dbl> <chr> <chr> <chr> <chr> <chr> <chr> <chr>
## 1 1 Exotic Liquid Charlotte … 49 Gil… Lond… EC1 4SD UK (171…
## 2 2 New Orleans Caj… Shelley Bu… P.O. B… New … 70117.0 USA (100…
## 3 3 Grandma Kelly's… Regina Mur… 707 Ox… Ann … 48104.0 USA (313…5.4.4.2 併表
library(dplyr)df <- Orders %>% left_join(OrderDetails, by = "OrderID")
df %>% slice(1:10)## # A tibble: 10 × 8
## OrderID CustomerID EmployeeID OrderDate ShipperID OrderDetailID
## <dbl> <dbl> <dbl> <dttm> <dbl> <dbl>
## 1 10248 90 5 1996-07-04 00:00:00 3 1
## 2 10248 90 5 1996-07-04 00:00:00 3 2
## 3 10248 90 5 1996-07-04 00:00:00 3 3
## 4 10249 81 6 1996-07-05 00:00:00 1 4
## 5 10249 81 6 1996-07-05 00:00:00 1 5
## 6 10250 34 4 1996-07-08 00:00:00 2 6
## 7 10250 34 4 1996-07-08 00:00:00 2 7
## 8 10250 34 4 1996-07-08 00:00:00 2 8
## 9 10251 84 3 1996-07-08 00:00:00 1 9
## 10 10251 84 3 1996-07-08 00:00:00 1 10
## # ℹ 2 more variables: ProductID <dbl>, Quantity <dbl>df <- df %>% left_join(Products, by = "ProductID")
df %>% slice(1:10)## # A tibble: 10 × 13
## OrderID CustomerID EmployeeID OrderDate ShipperID OrderDetailID
## <dbl> <dbl> <dbl> <dttm> <dbl> <dbl>
## 1 10248 90 5 1996-07-04 00:00:00 3 1
## 2 10248 90 5 1996-07-04 00:00:00 3 2
## 3 10248 90 5 1996-07-04 00:00:00 3 3
## 4 10249 81 6 1996-07-05 00:00:00 1 4
## 5 10249 81 6 1996-07-05 00:00:00 1 5
## 6 10250 34 4 1996-07-08 00:00:00 2 6
## 7 10250 34 4 1996-07-08 00:00:00 2 7
## 8 10250 34 4 1996-07-08 00:00:00 2 8
## 9 10251 84 3 1996-07-08 00:00:00 1 9
## 10 10251 84 3 1996-07-08 00:00:00 1 10
## # ℹ 7 more variables: ProductID <dbl>, Quantity <dbl>, ProductName <chr>,
## # SupplierID <dbl>, CategoryID <dbl>, Unit <chr>, Price <dbl>5.5 library(autoEDA)
5.5.1 初試啼聲之一
library(autoEDA)
x <- autoEDA(x = iris, plotContinuous = "density")## autoEDA | Setting color theme
## autoEDA | Removing constant features
## autoEDA | 0 constant features removed
## autoEDA | 0 zero spread features removed
## autoEDA | Removing features containing majority missing values
## autoEDA | 0 majority missing features removed
## autoEDA | Cleaning data
## autoEDA | Correcting sparse categorical feature levels
## autoEDA | Performing univariate analysis
## autoEDA | Visualizing data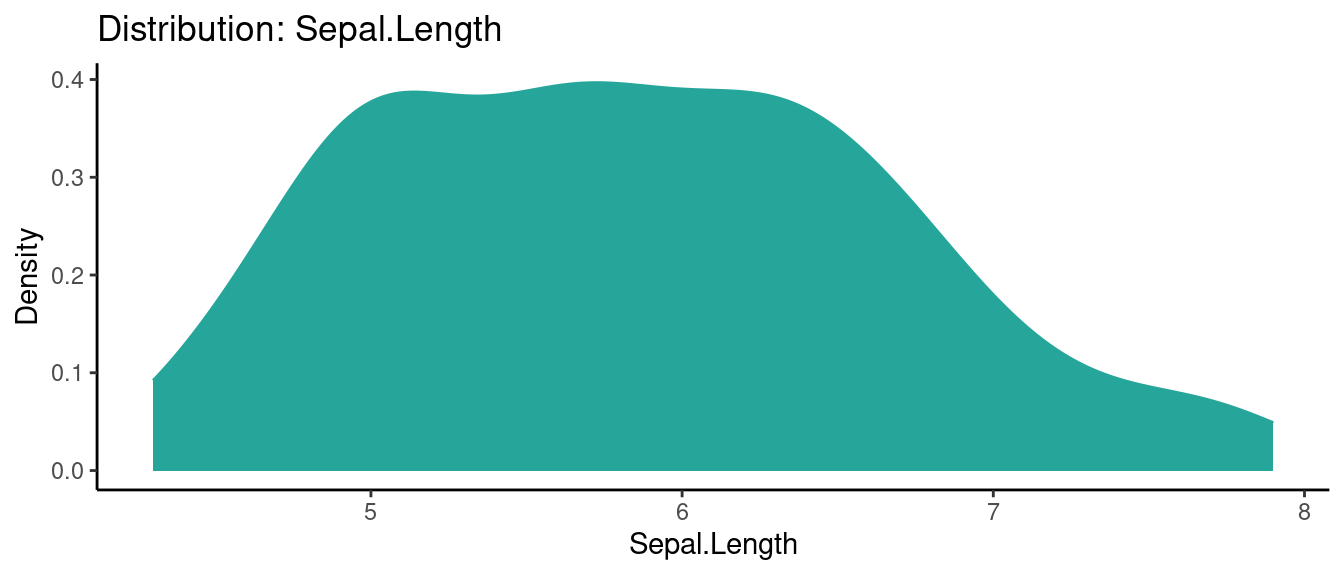
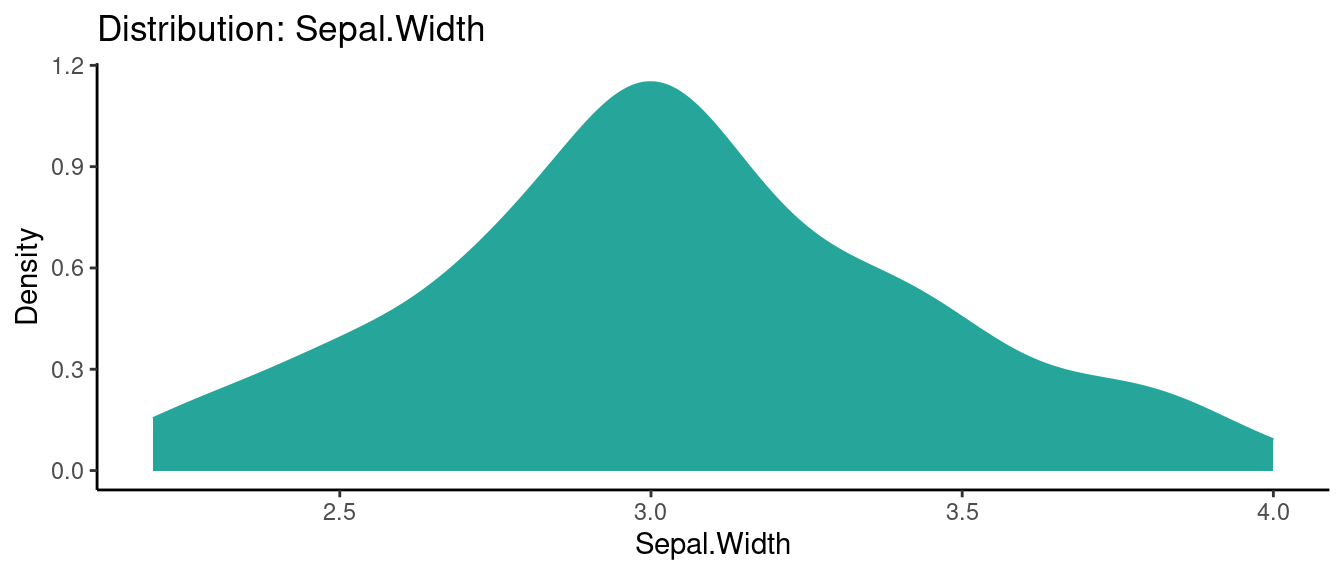
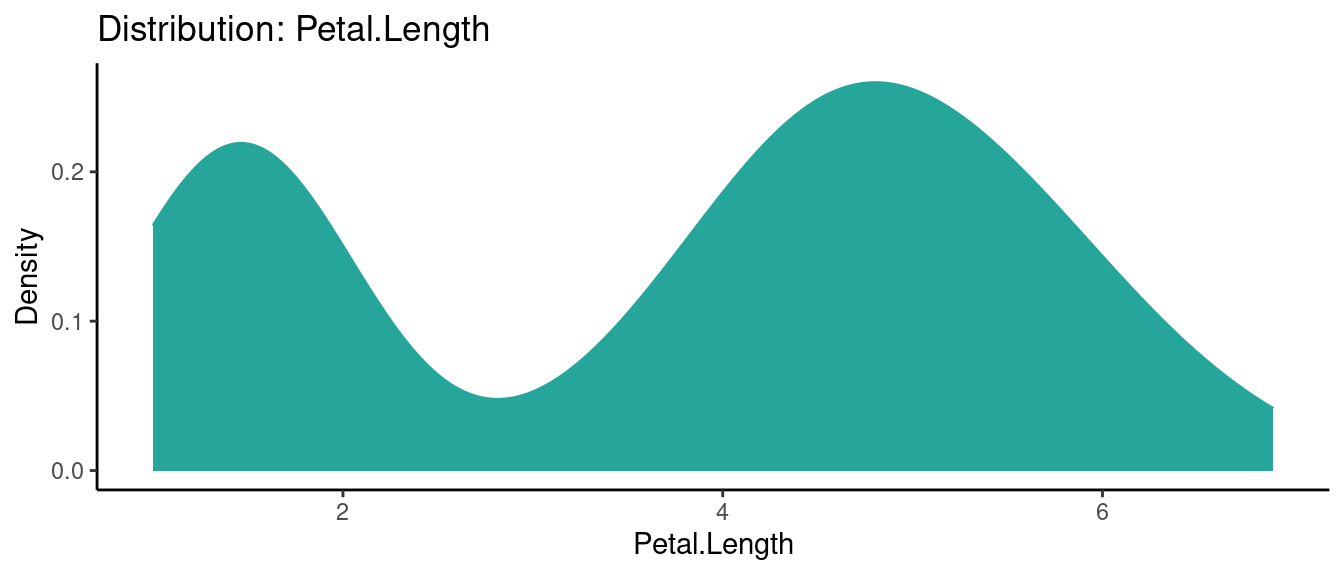
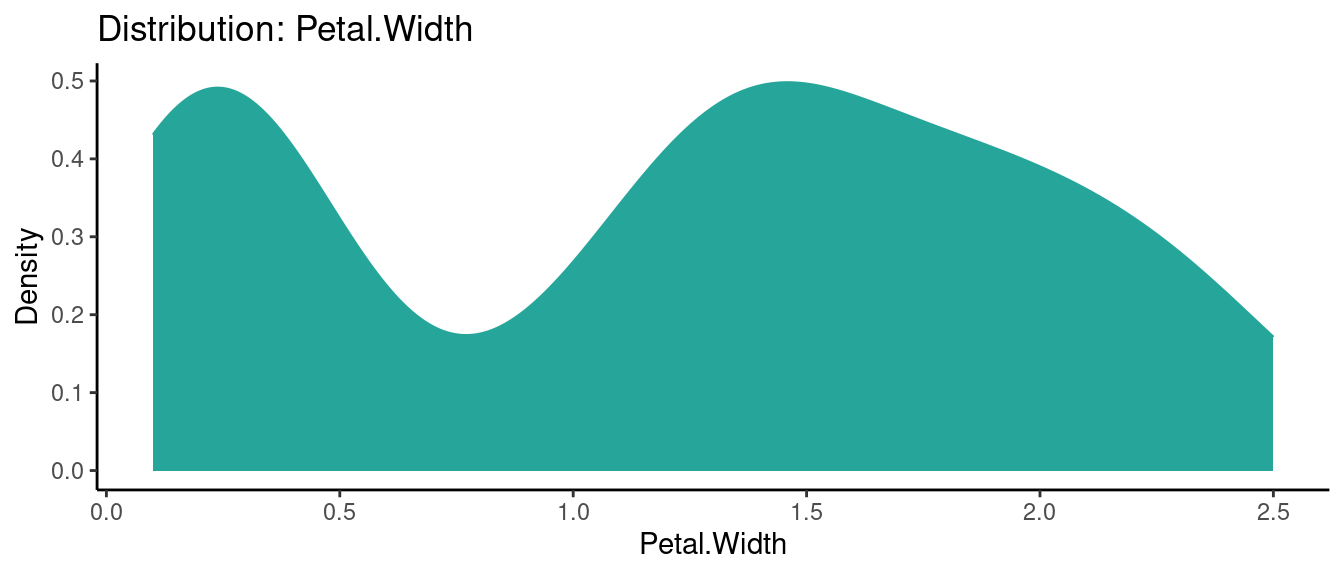
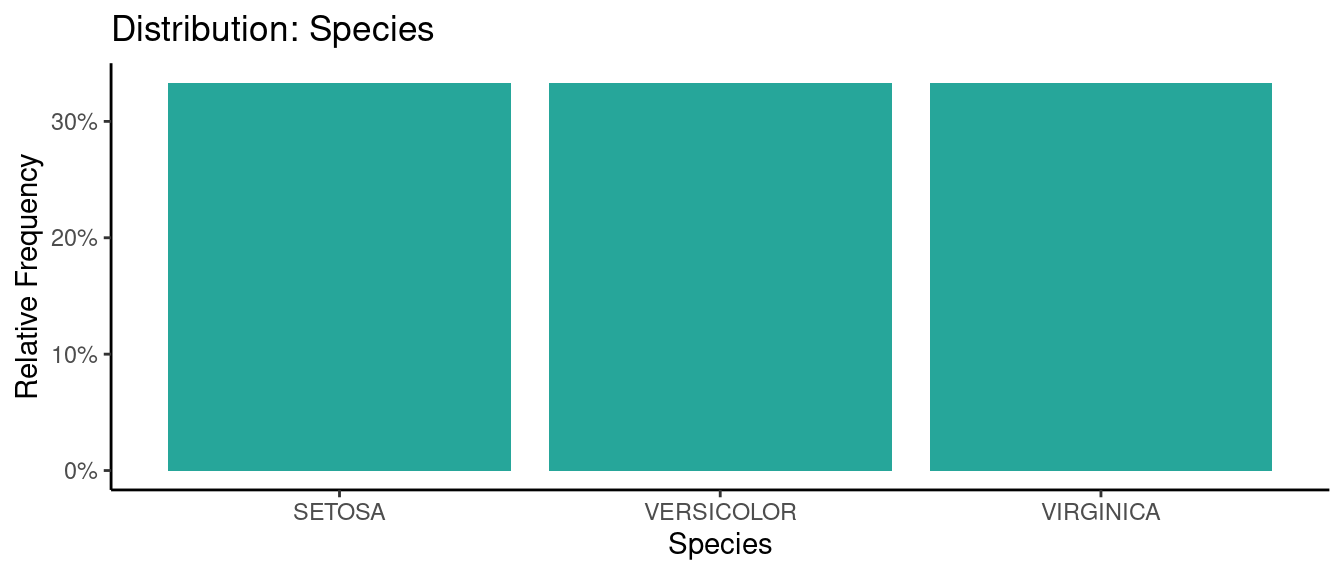
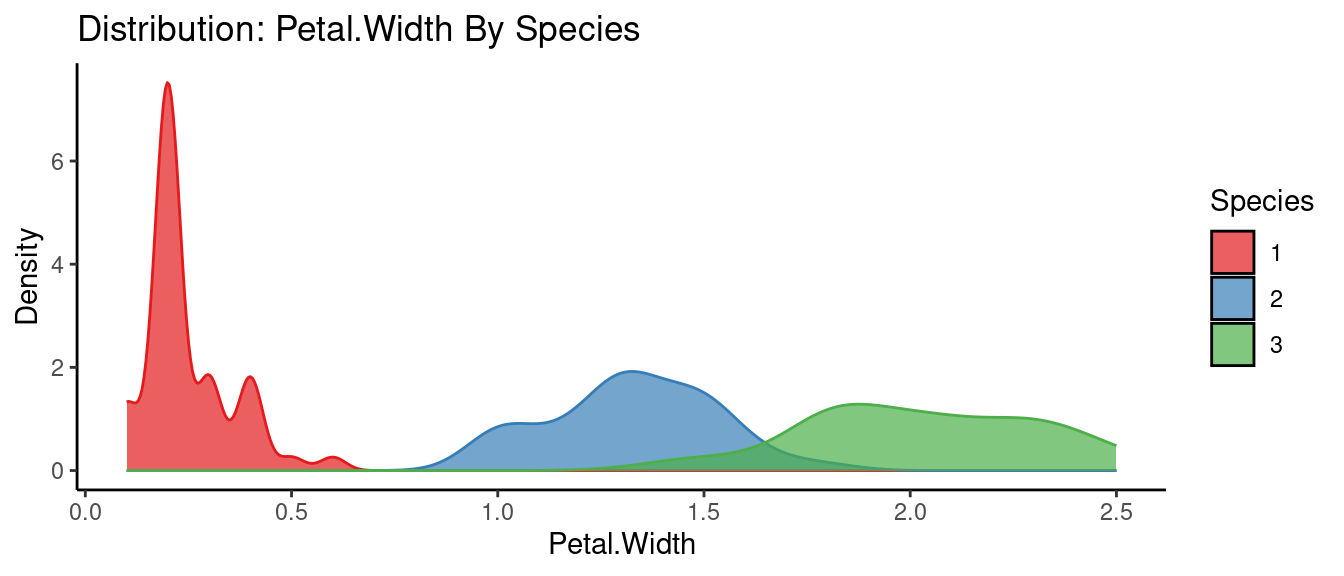
5.5.2 初試啼聲之二
library(autoEDA)
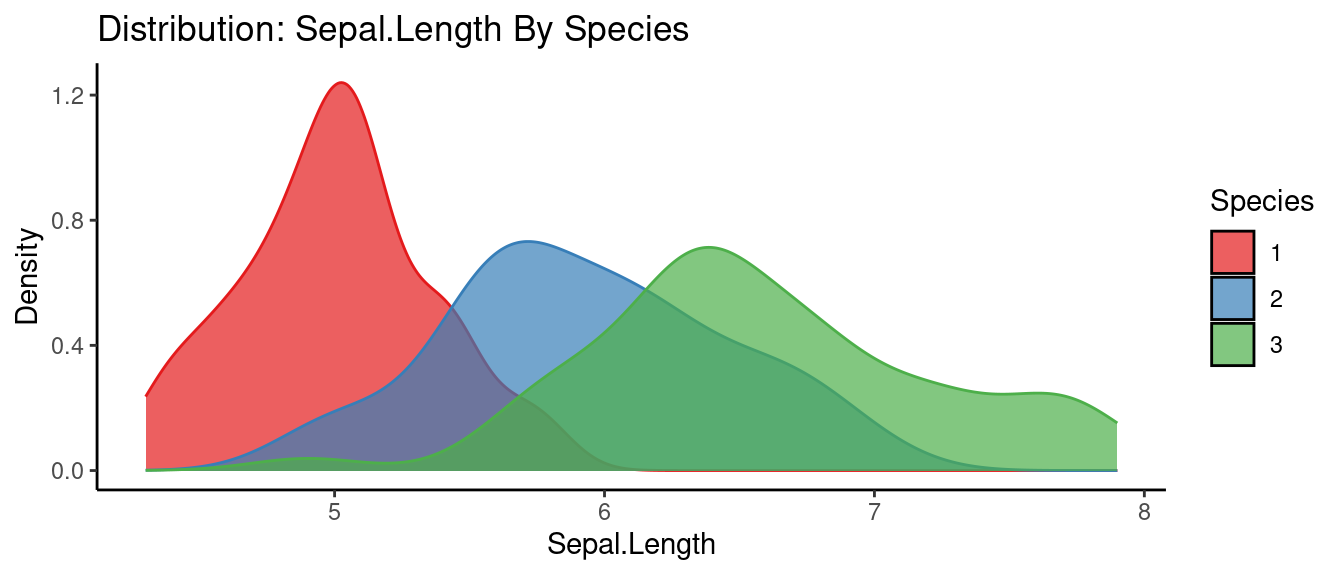
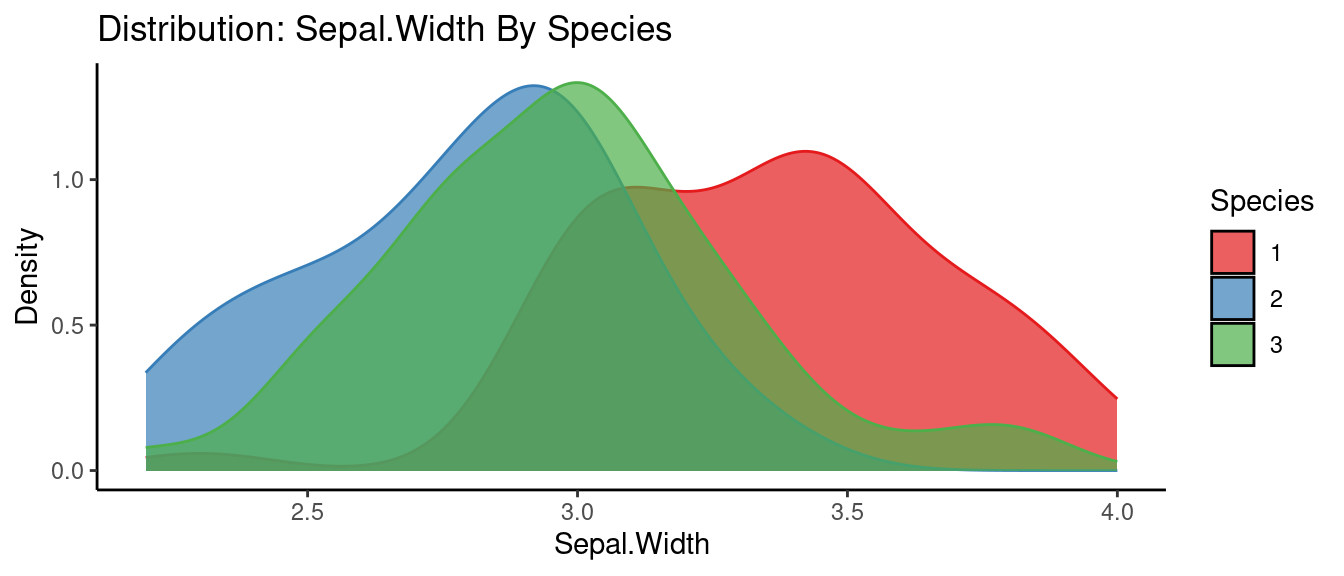
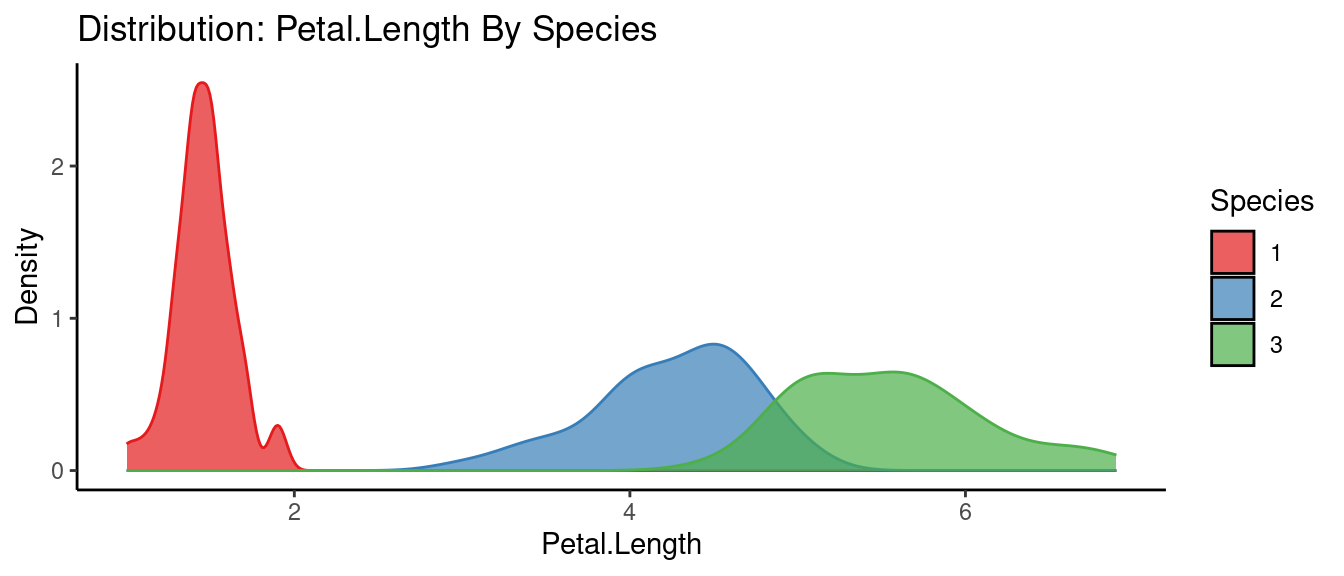
x <- autoEDA(x = iris,
y = "Species",
plotContinuous = "density",
predictivePower = FALSE)## autoEDA | Setting color theme
## autoEDA | Removing constant features
## autoEDA | 0 constant features removed
## autoEDA | Removing zero spread features
## autoEDA | 0 zero spread features removed
## autoEDA | Removing features containing majority missing values
## autoEDA | 0 majority missing features removed
## autoEDA | Cleaning data
## autoEDA | Correcting sparse categorical feature levels
## autoEDA | Sorting features
## autoEDA | Multi-class classification outcome detected
## autoEDA | Visualizing data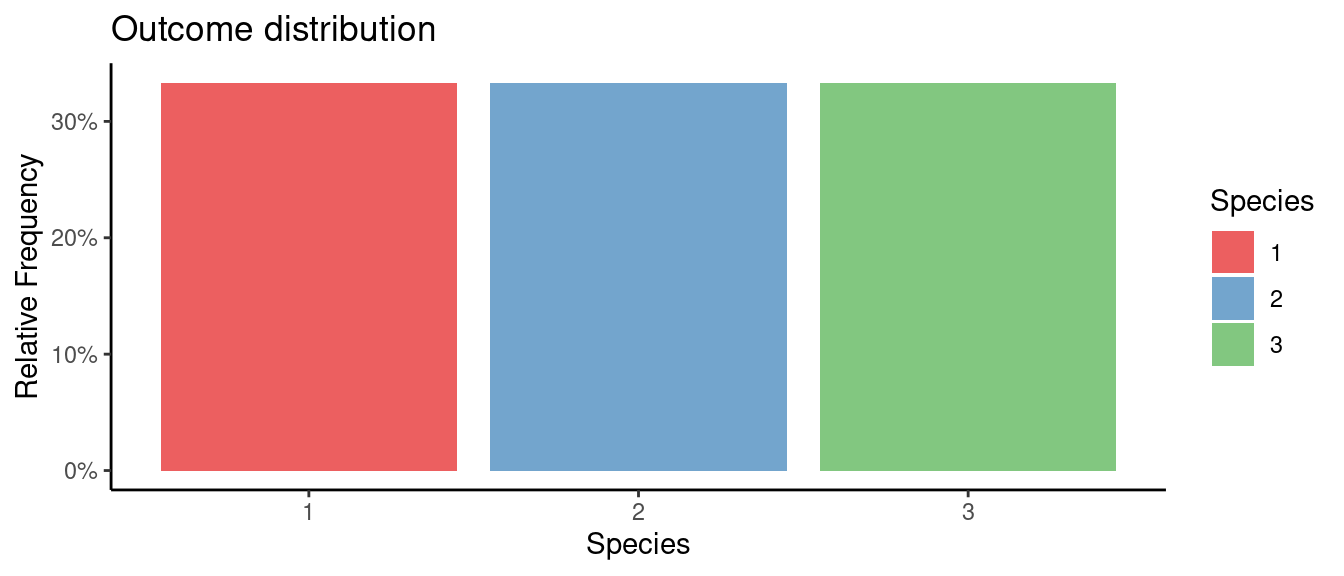
5.5.3 初試啼聲之三
autoNames <- names(x)
x <- data.table::transpose(x)
colnames(x) <- x[1,]
rownames(x) <- autoNames
x <- x[-1,]
x
## Sepal.Length Sepal.Width Petal.Length Petal.Width Species
## Observations 150 150 150 150 150
## FeatureClass numeric numeric numeric numeric character
## FeatureType Continuous Continuous Continuous Continuous Categorical
## PercentageMissing 0 0 0 0 0
## PercentageUnique 23.33 15.33 28.67 14.67 2
## ConstantFeature No No No No No
## ZeroSpreadFeature No No No No No
## LowerOutliers 0 1 0 0 0
## UpperOutliers 0 3 0 0 0
## ImputationValue 5.8 3 4.35 1.3 SETOSA
## MinValue 4.3 2 1 0.1 0
## FirstQuartile 5.1 2.8 1.6 0.3 0
## Median 5.8 3 4.35 1.3 0
## Mean 5.84 3.06 3.76 1.2 0
## Mode 5 3 1.4 0.2 SETOSA
## ThirdQuartile 6.4 3.3 5.1 1.8 0
## MaxValue 7.9 4.4 6.9 2.5 0
## LowerOutlierValue 3.15 2.05 -3.65 -1.95 0
## UpperOutlierValue 8.35 4.05 10.35 4.05 05.5.4 初試啼聲之四
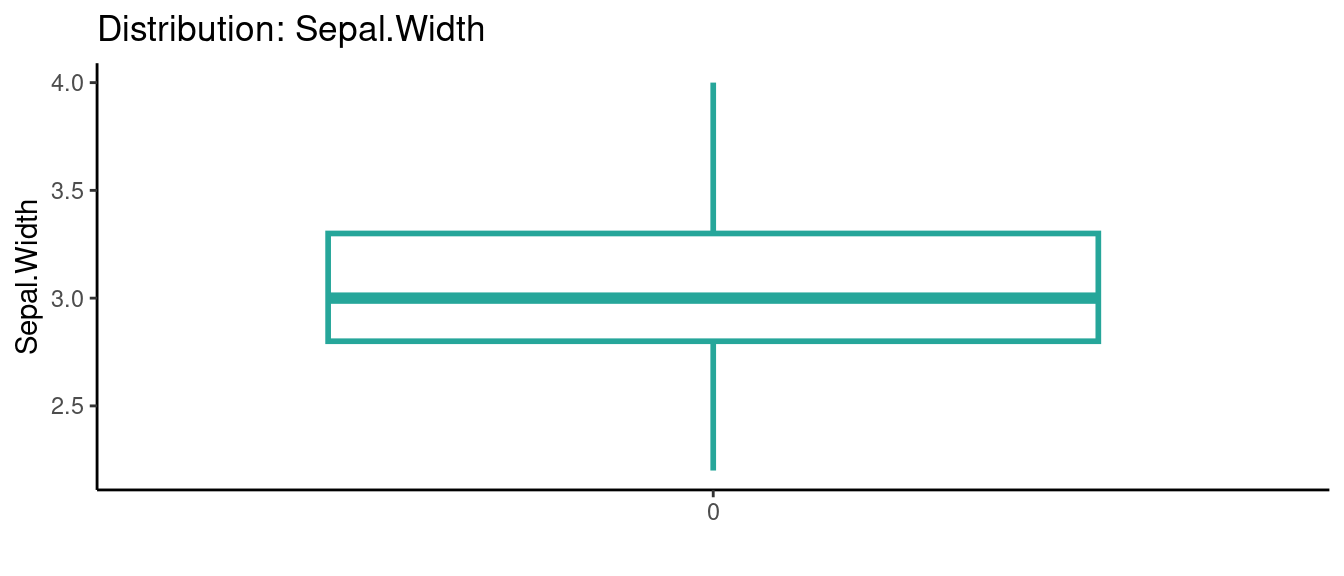
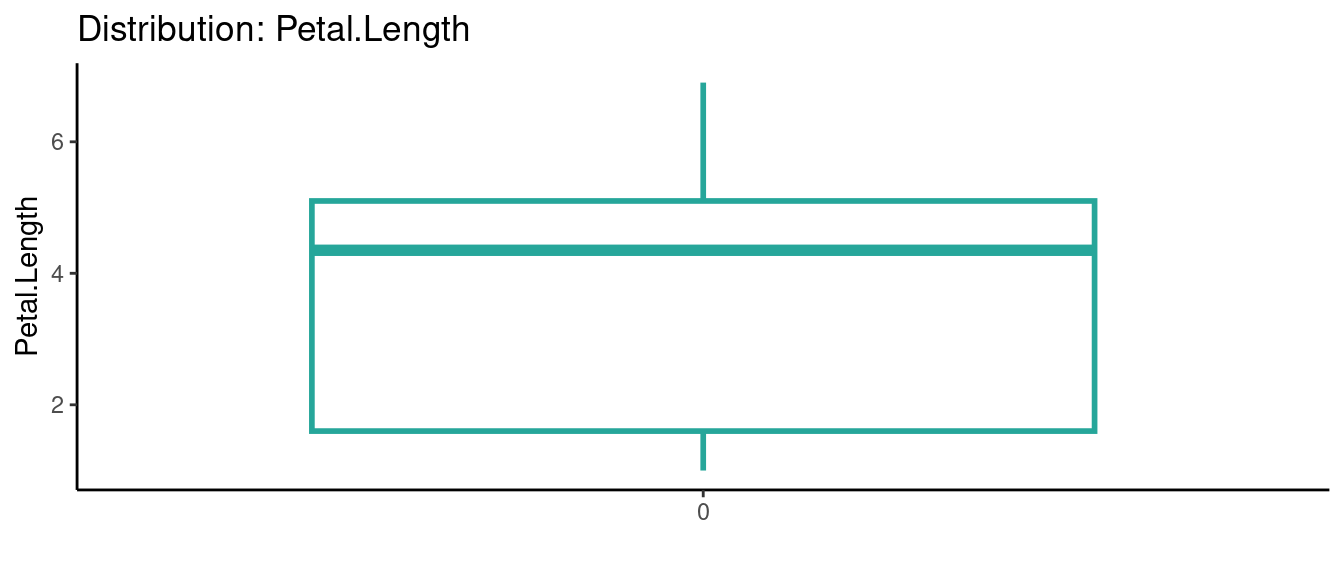
library(autoEDA)
x <- autoEDA(x = iris, plotContinuous = "boxplot")
## autoEDA | Setting color theme
## autoEDA | Removing constant features
## autoEDA | 0 constant features removed
## autoEDA | 0 zero spread features removed
## autoEDA | Removing features containing majority missing values
## autoEDA | 0 majority missing features removed
## autoEDA | Cleaning data
## autoEDA | Correcting sparse categorical feature levels
## autoEDA | Performing univariate analysis
## autoEDA | Visualizing data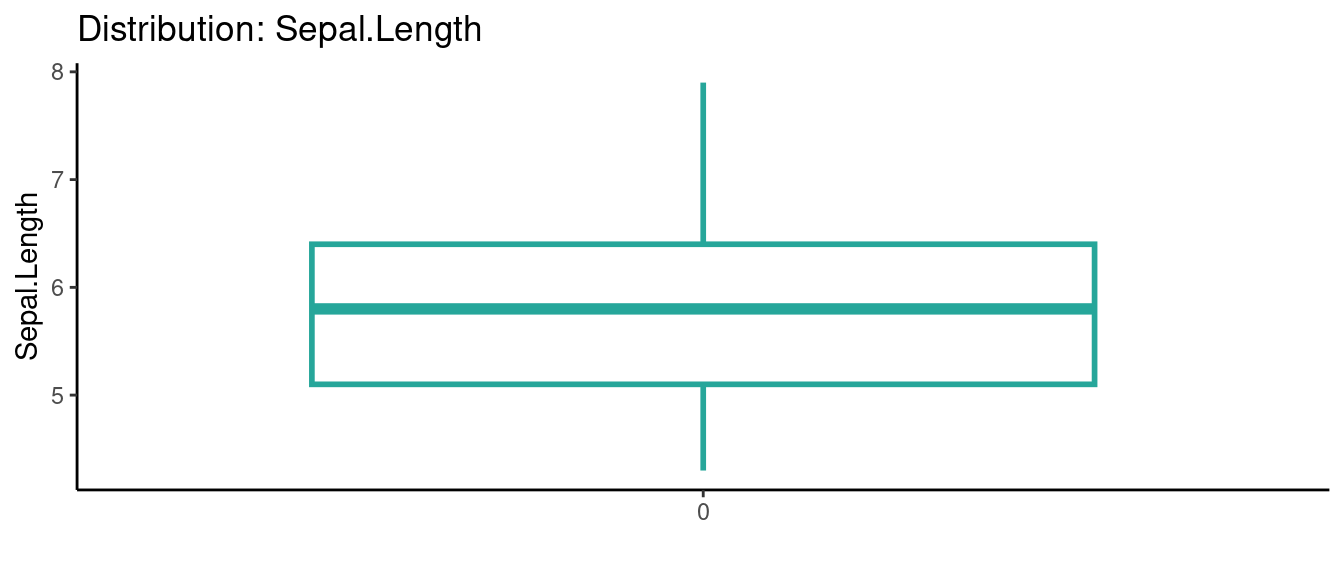
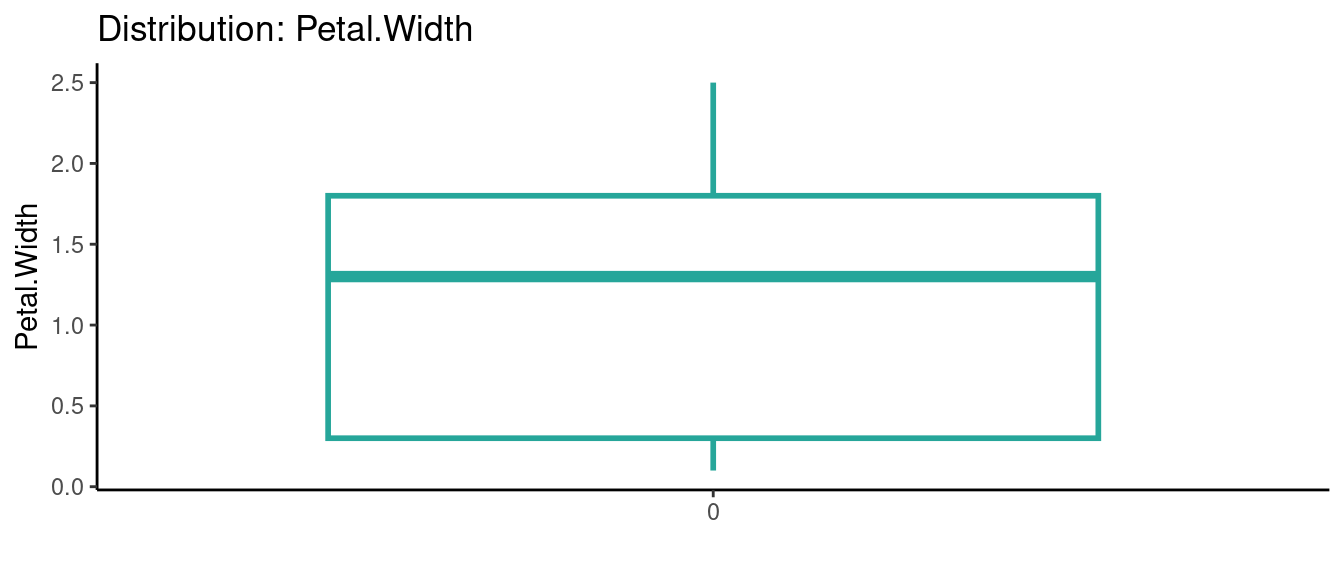
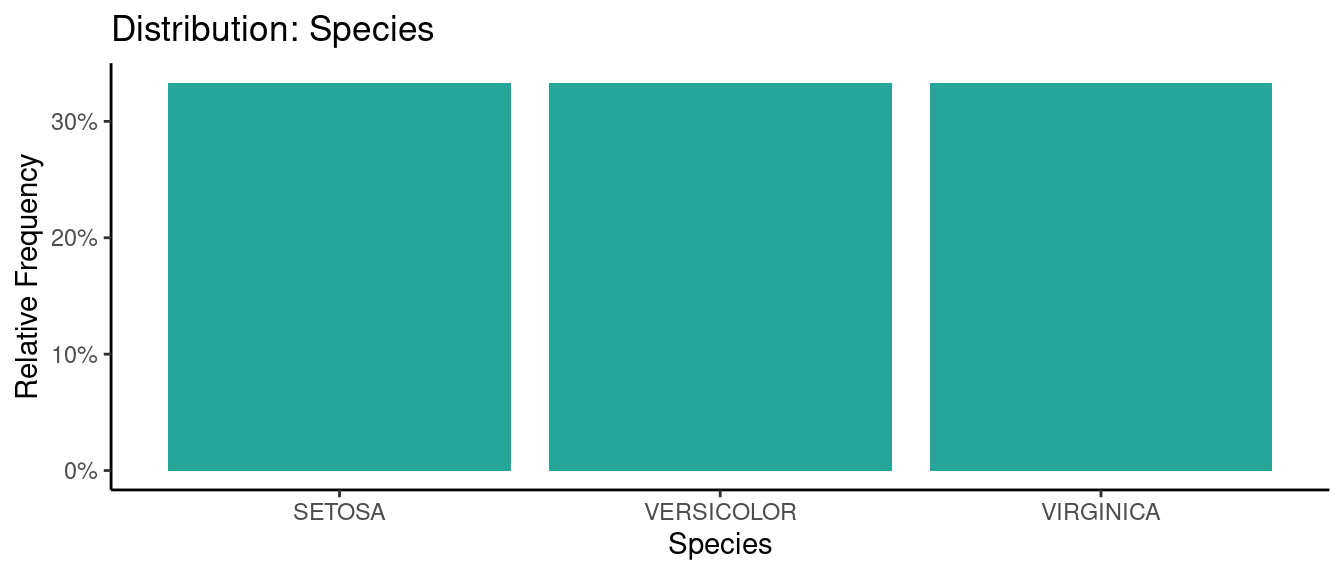
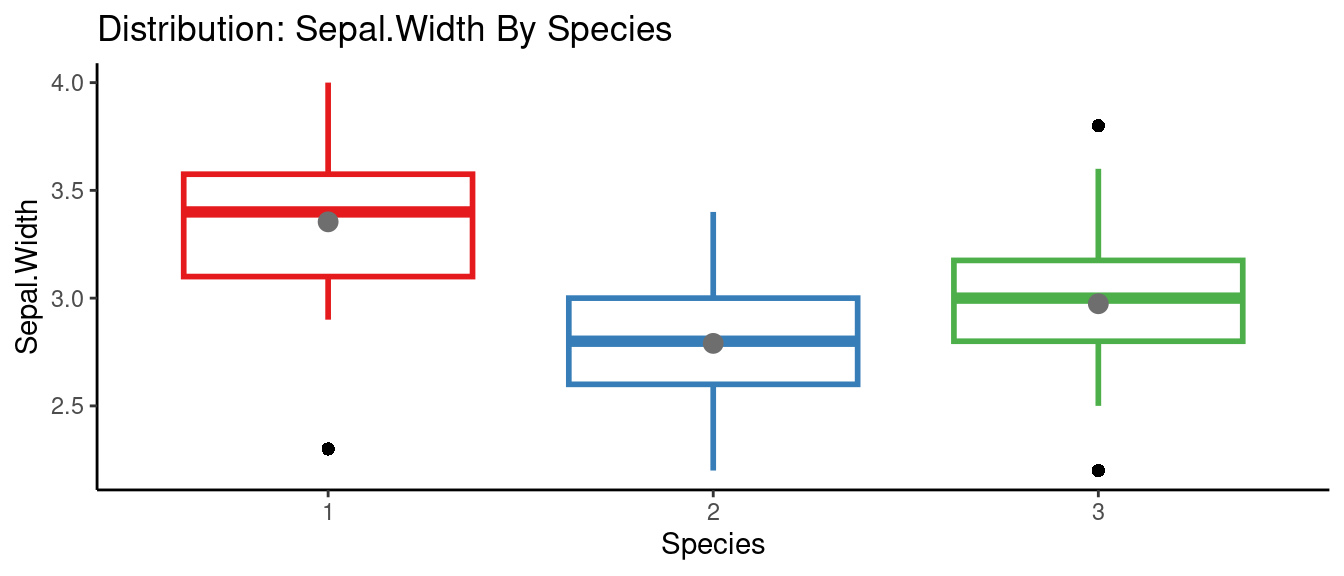
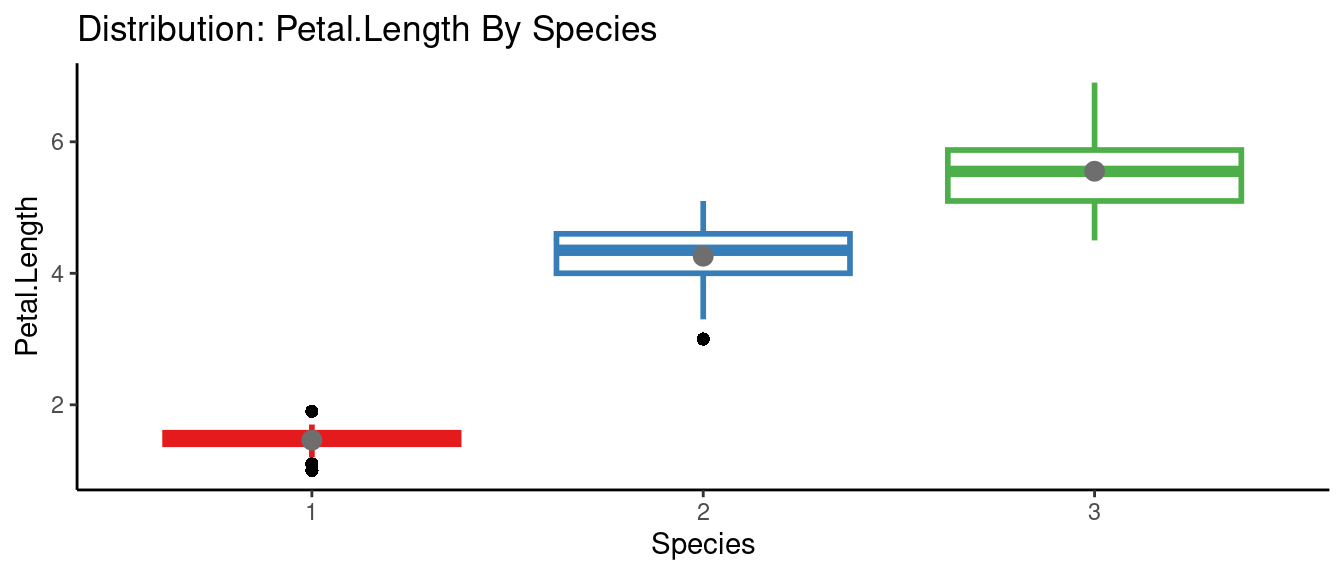
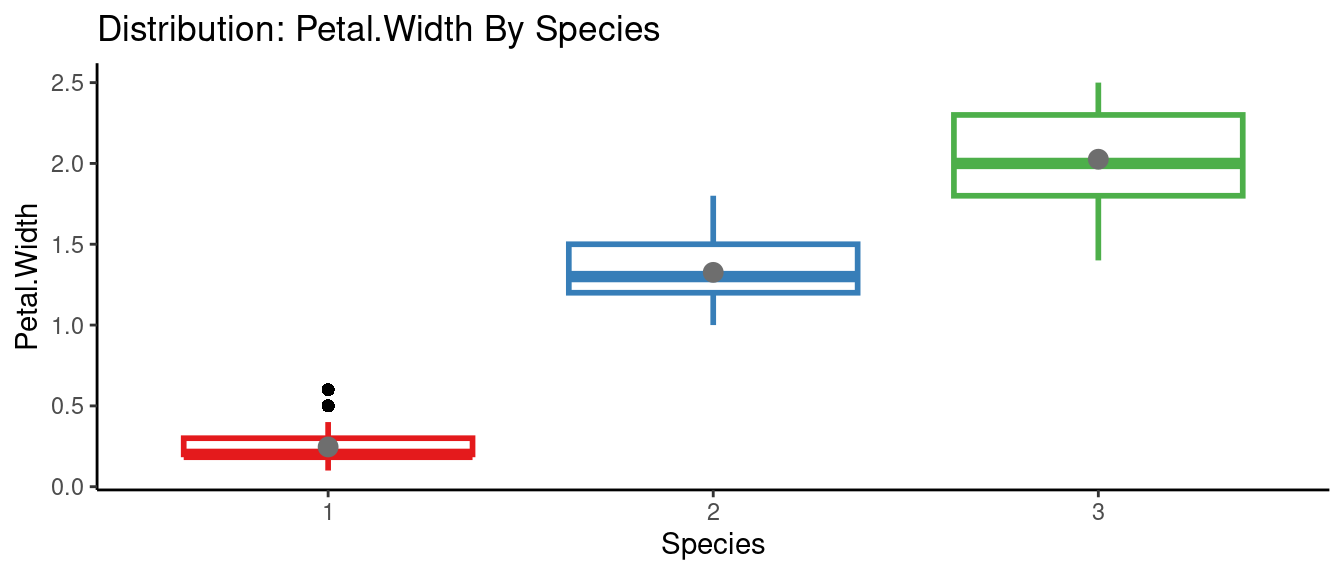
5.5.5 初試啼聲之五
library(autoEDA)
x <- autoEDA(x = iris,
             y = "Species",
             plotContinuous = "boxplot",
             predictivePower = FALSE)
## autoEDA | Setting color theme
## autoEDA | Removing constant features
## autoEDA | 0 constant features removed
## autoEDA | Removing zero spread features
## autoEDA | 0 zero spread features removed
## autoEDA | Removing features containing majority missing values
## autoEDA | 0 majority missing features removed
## autoEDA | Cleaning data
## autoEDA | Correcting sparse categorical feature levels
## autoEDA | Sorting features
## autoEDA | Multi-class classification outcome detected
## autoEDA | Visualizing data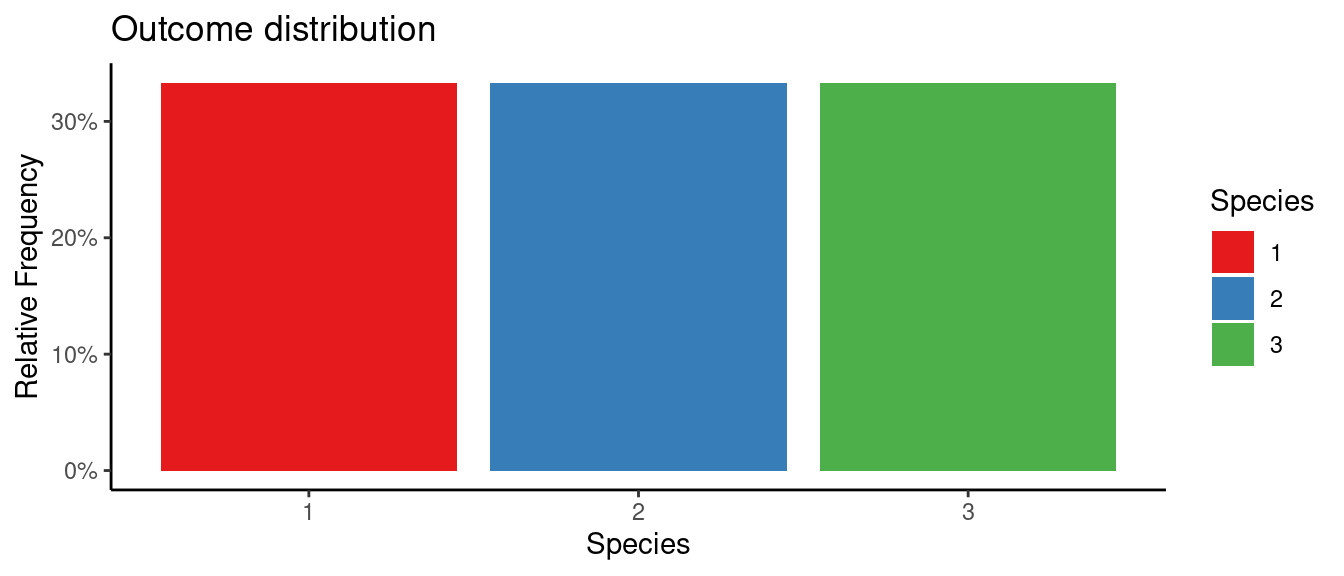
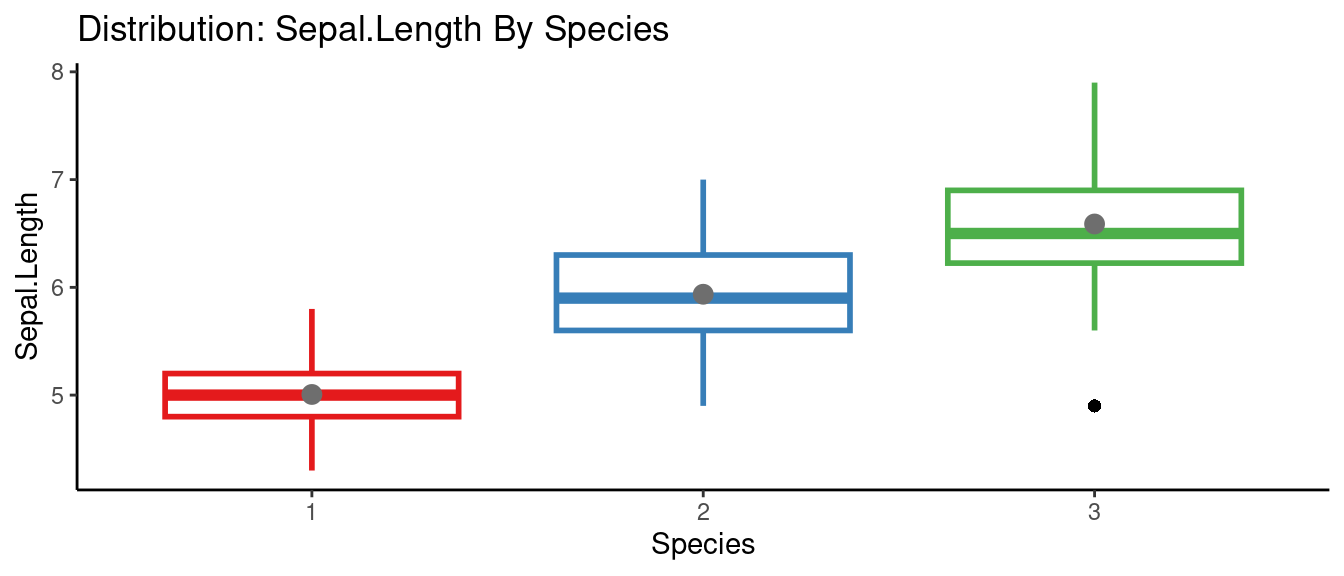
5.5.6 autoEDA的參數群
args(autoEDA)## function (x, y = NULL, IDFeats = NULL, sampleRate = 1, outcomeType = "automatic",
## maxUniques = 15, maxLevels = 25, removeConstant = TRUE, removeZeroSpread = TRUE,
## removeMajorityMissing = TRUE, imputeMissing = TRUE, clipOutliers = TRUE,
## minLevelPercentage = 0.025, predictivePower = TRUE, outlierMethod = "tukey",
## lowPercentile = 0.01, upPercentile = 0.99, plotCategorical = "stackedBar",
## plotContinuous = "histogram", bins = 20, rotateLabels = FALSE,
## colorTheme = 1, theme = 2, color = "#26A69A", transparency = 1,
## outputPath = NULL, filename = "ExploratoryPlots", returnPlotList = FALSE,
## verbose = TRUE)
## NULL5.5.7 autoEDA的使用手冊
請點選這裡。
