Chapter 12 探索式數據分析安可曲
12.1 續
我們從探索式數據分析首部曲開啟「探索式分析波士頓數據集」,先從「房價中位數」開始。走過「莖葉圖」、「次數分配表」、「相對次數分配表」、「累加次數分配表」、「累加相對次數分配表」、「許許多多種摘要統計量」跟「摘要統計量報表」。然後探索式數據分析二部曲把「房價中位數」學到的技術試圖延伸到整張表的全部欄位,繼續走到、「直方圖」、「直方圖陣列」跟整張表的「摘要統計量報表」。也修正了兩個整數變數,一個變成「名目文字」,一個變成「順序文字」,並且順勢帶出「分群、分段的摘要統計量報表」。也把「自製單變量摘要統計量報表」,透過
for迴圈
,變出整張全部連續型變數的「摘要統計量報表」,而且示範了「愛放什麼統計量就放什麼統計量」的
自由自在!
接下來,我們要把「從一到十四一個一個看」的方向,換到「一次兩個」的方向。所謂的「一次兩個」有以下三個意思:
- 一次看兩個連續型變數
- 一次看兩個離散型變數
- 一次看一個連續型變數加一個離散型變數
如果是「一次看兩個連續型變數」,就先來「一個固定在『房價中位數』,十三個取一個的自由變化,嘗試製作並分析這十三張『散佈圖』」。
「散佈圖」到底為何而生啊?
這一套微微書一開始介紹了1900年代的「莖葉圖」,接著「莖葉圖」帶出「次數分配表」,繼續帶出連續型變數的「直方圖」跟離散型變數的「長條圖」等等呈現
分配
的統計技術。看到「莖葉圖」、「直方圖」跟「長條圖」之後,我們開始學習「描述分配的各種特質」。統計學家不只嘗試使用文字,也嘗試使用數字,於是乎,統計學家創造了許許多多描述分配的數字。這些數字,叫做「敘述統計量」,也叫做「摘要統計量」。發展至此,前述提到過的技術都是所謂「單變量摘要技術」。人類不會停下來,統計學家當然也不會停下來!「單(形單影隻)」這個字的下一個就是「雙(成雙成對)」。那
為什麼想要一次看兩個連續型變數呢?
因為我們可能想
…
為了「協助掌握我們辛苦收到的數據集」,「視覺化工具」一向是首選,我們想想1900年代,Arthur Bowley先生發明了「莖葉圖」,作者小編「認為」在當時「莖葉圖」不是第一名就是第二名的統計學發明。很可惜,Arthur Bowley沒有發明「兩個變數一起看的莖葉圖」!
時鐘的秒針繼續往前走!
後來「統計學家」借用了「數學家」在1637年發明、超過380歲的Cartesian coordinate system,變出所謂的「散佈圖(Scatter plot)」這一項「視覺化兩兩變數」的工具。在這一章,作者小編除了介紹「散佈圖(Scatter plot)」,也會介紹統計學家的其他發明,諸如檢視「兩兩連續型變數」的「摘要統計量」。在諸多可能性裡頭,就屬「相關係數(Pearson correlation coefficient)」最搶眼、最流行。作者小編準備介紹R對「相關係數」的諸多支持(計算、視覺化、檢定等等)。
…
如果是「一次看兩個離散型變數」,就先看「兩兩離散型變數」之間的「列聯表」,當然會介紹「列聯表」的「獨立性檢定」跟各種「2x2列聯表」檢視一致性的測度。
…
如果是「一次看一個連續型變數加一個離散型變數」,在波士頓數據集裡,我們有機會看「雙母體的t檢定」、「單向變異數分析的F檢定」以及「雙向變異數分析的F檢定」。
…
請讀者諸君不要轉台!
…
12.3 準備工作
require(MASS) # 用「require」不用「library」,是因為如果R已經將套件MASS載入環境,就不需要再載一次。
data(Boston)
boston <- Boston
# 「不動」原始數據集,不論它有「多原始」,是R程式設計的一項絕佳習慣。
# 即便一般使用者是無法任意改變套件MASS的內容物!
DISvars <- colnames(boston)[which(sapply(boston, class) == "integer")]
CONvars <- colnames(boston)[which(sapply(boston, class) == "numeric")]
colsBostonFull<-readRDS("/home/fcu/ShinyApps/Textbooks/BOSTON/chapter02/output/data/colsBostonFull.rds")
## Error in gzfile(file, "rb"): 無法開啟連接colsBostonFull## 說明
## CRIM per capita crime rate by town
## ZN proportion of residential land zoned for lots over 25,000 sq.ft.
## INDUS proportion of non-retail business acres per town
## CHAS Charles River dummy variable (= 1 if tract bounds river; 0 otherwise)
## NOX nitric oxides concentration (parts per 10 million)
## RM average number of rooms per dwelling
## AGE proportion of owner-occupied units built prior to 1940
## DIS weighted distances to five Boston employment centres
## RAD index of accessibility to radial highways
## TAX full-value property-tax rate per $10,000
## PTRATIO pupil-teacher ratio by town
## BLACK 1000(Bk - 0.63)^2 where Bk is the proportion of blacks by town
## LSTAT % lower status of the population
## MEDV Median value of owner-occupied homes in $1000's
## 中文翻譯 中文變數名稱 內容物
## CRIM 每個城鎮人均犯罪率。 犯罪率 numeric
## ZN 超過25,000平方呎的住宅用地比例。 住宅用地比例 numeric
## INDUS 每個城鎮非零售業務英畝的比例。 非商業區比例 numeric
## CHAS 是否鄰近Charles River。 河邊宅 integer
## NOX 氮氧化合物濃度。 空汙指標 numeric
## RM 每個住宅的平均房間數。 平均房間數 numeric
## AGE 1940年之前建造的自用住宅比例。 老房子比例 numeric
## DIS 距波士頓五大商圈的加權平均距離。 加權平均距離 numeric
## RAD 環狀高速公路的可觸指標。 交通便利性 integer
## TAX 財產稅占比(每一萬美元)。 財產稅率 numeric
## PTRATIO 生師比。 生師比 numeric
## BLACK 黑人的比例。 黑人指數 numeric
## LSTAT (比較)低社經地位人口的比例。 低社經人口比例 numeric
## MEDV 以千美元計的房價中位數。 房價中位數 numeric12.4 散佈圖
作者小編在寫一系列微微書的當下,疫情持續中,但還是有好消息,就是維基百科滿20周年。不論是維基百科中文版,還是維基百科英文版都是作者小編諮詢的對象,因為Wikipedia讓作者小編可以快速回顧數學、統計與資訊相關的專業知識,也借此深入發現數學、統計與資訊相關的專業知識,更可以補充作者小編與時俱增的數學、統計與資訊相關的專業知識。Wikipedia絕對是作者小編一系列微微書的好朋友。那
什麼是「散佈圖」呢?
先看Wikipedia怎麼說?
A scatter plot (also called a scatterplot, scatter graph, scatter chart, scattergram, or scatter diagram) is a type of plot or mathematical diagram using Cartesian coordinates to display values for typically two variables for a set of data.
knitr::include_url("https://en.wikipedia.org/wiki/Scatter_plot")…
先來幾個簡單的範例:
plot(x = 0:9, y = 0:9)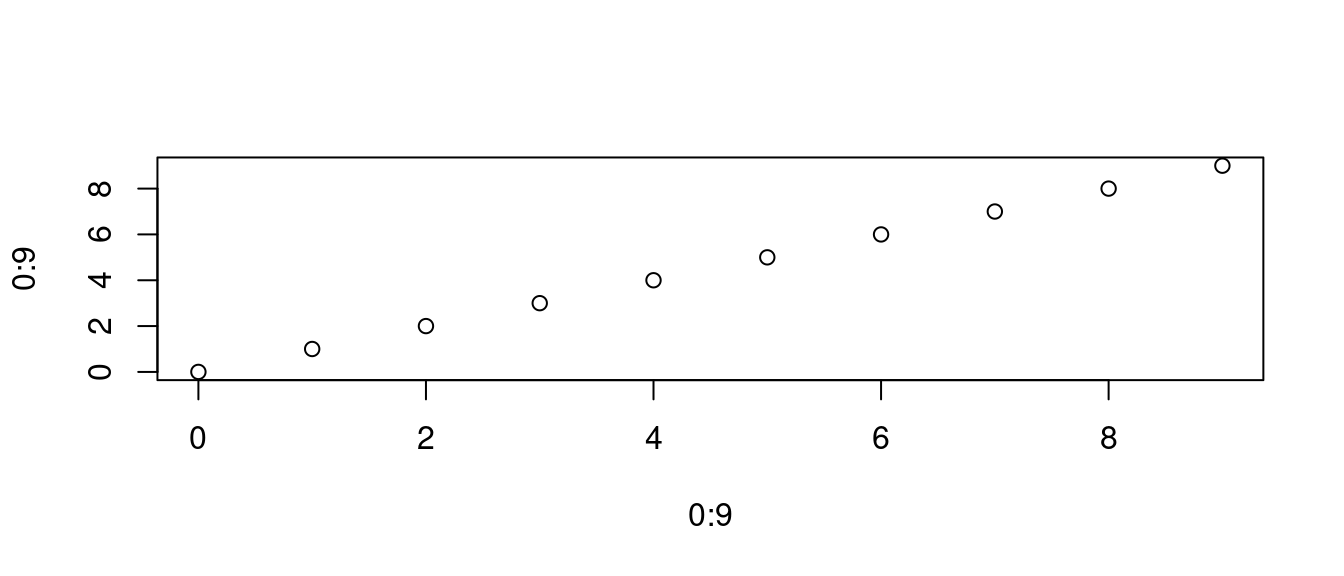
plot(x = 0:9, y = 0:9, xlim = c(-1, 10), ylim = c(-1, 10))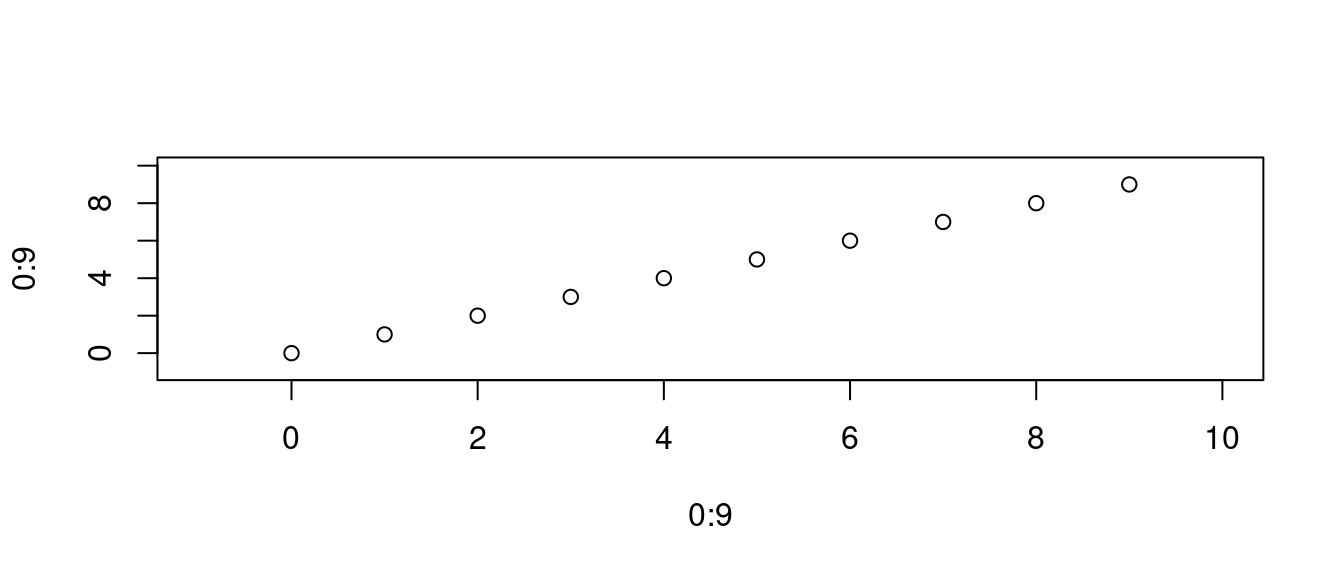
讓作者小編加幾條「輔助線」,協助大家「好看、易看」:
plot(x = 0:9, y = 0:9, xlim = c(-1, 10), ylim = c(-1, 10))
for (i in 0:9) {
  lines(c(i, i), c(-1, i+1), lty = 1)
  lines(c(-1, i+1), c(i, i), lty = 2)
}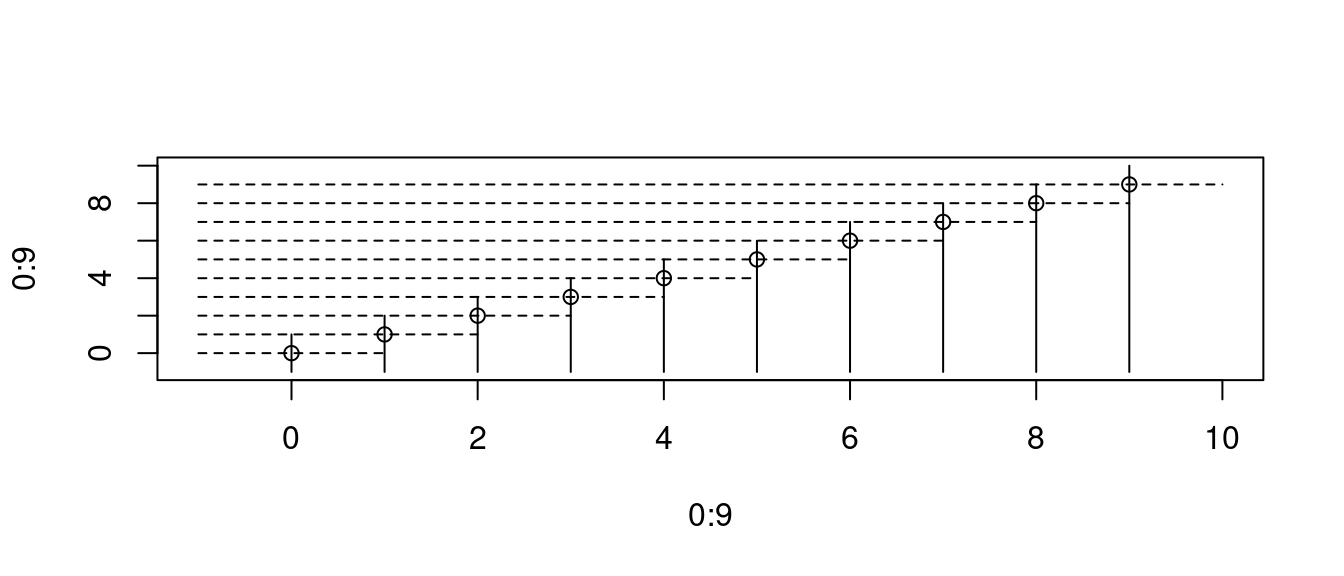
這樣,我們就可以確定、保證圖上的「座標」是
data.frame(x = 0:9, y = 0:9)## x y
## 1 0 0
## 2 1 1
## 3 2 2
## 4 3 3
## 5 4 4
## 6 5 5
## 7 6 6
## 8 7 7
## 9 8 8
## 10 9 9「散佈圖」也可以清楚表達數學方程式的部分「圖像」,這是「sin(x)」,一種週期循環的數學方程式:
x <- seq(0,8*pi,length.out=100)
y <- sin(x)
plot(x, y, type = "l")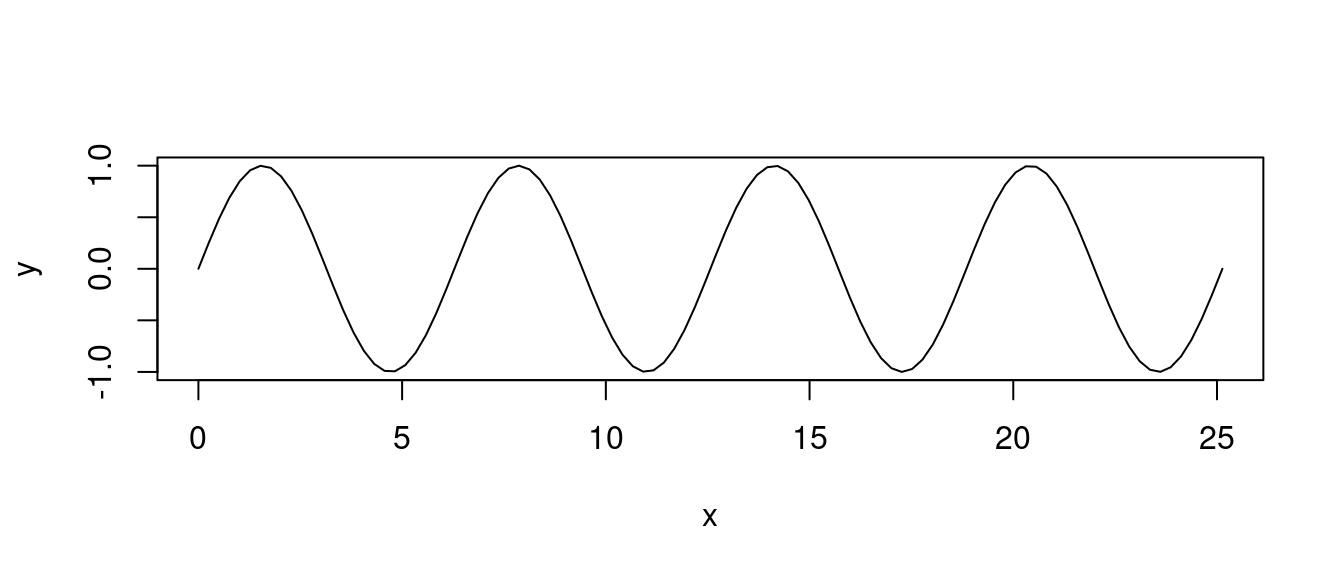
12.4.1 DIY
根據維基百科的定義,基本上,統計學裡的「散佈圖」借用「解析幾何的平面座標技術」。比如說,
- 抓波士頓數據集的第一個欄位,per capita crime rate by town,當作是「x座標」。再
- 抓波士頓數據集的房價中位數,Median value of owner-occupied homes in $1000’s,當作是「y座標」。然後,
- 同一個觀察值編號的「x座標」跟「y座標」形成「二維平面上的點座標(x, y)」,並且打上「二維平面」直到打完全部的點座標。
請看
plot(boston[, "crim"], boston[, "medv"])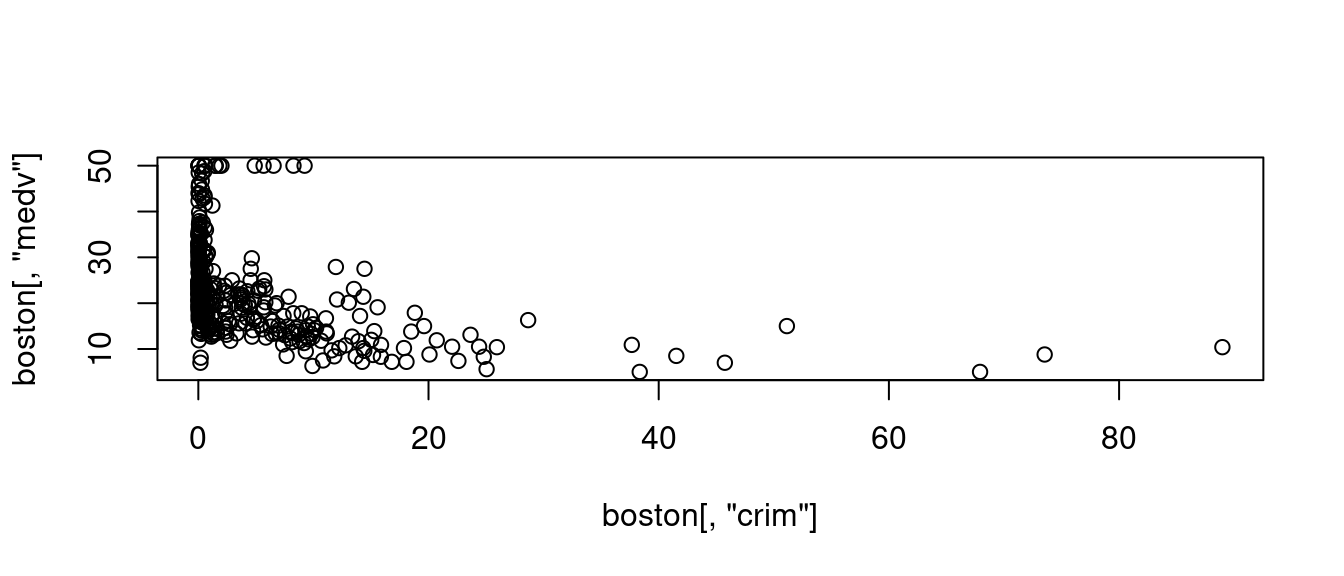
這就是一張「最簡單的散佈圖」。據業界人士的觀察與建議,R是畫圖高手。如果讀者諸君想深入繪圖相關技術,請前進The R Graph Gallery繼續研習、繼續努力、繼續鑽研。接下來,作者小編為上述「最簡單的散佈圖」加味加料:
plot(boston[, "crim"], boston[, "medv"],
     xlab = "犯罪率",
     ylab = "房價中位數",
     main = "犯罪率 vs 房價中位數的散佈圖")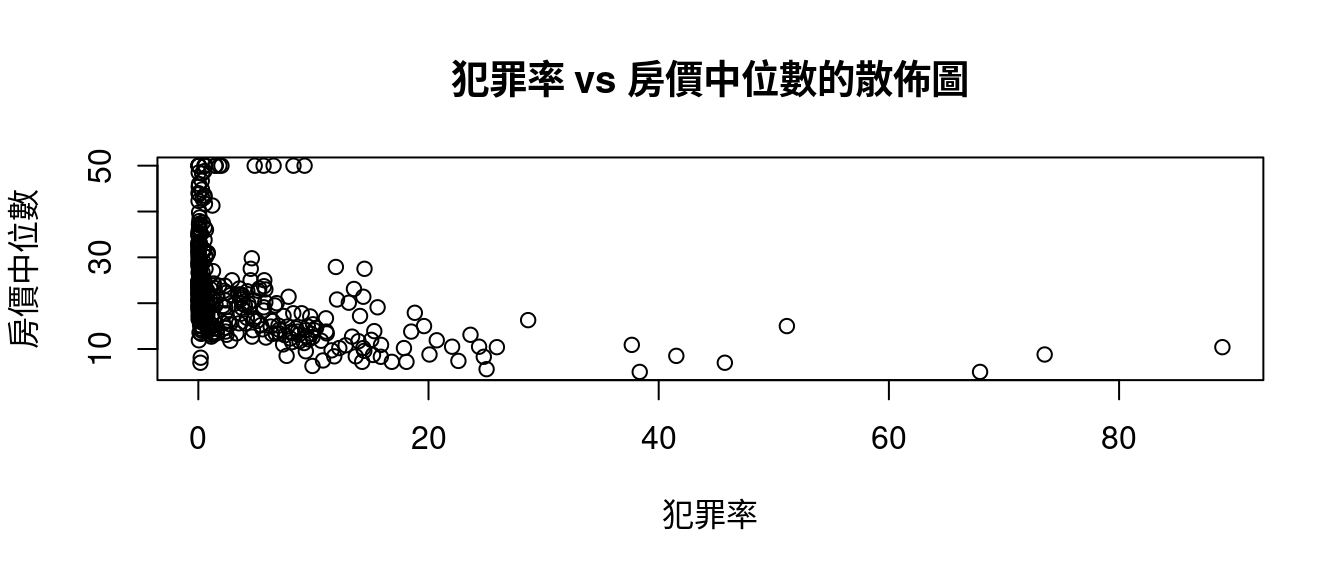
也可以根據「是否『是河岸宅』」加顏色:
plot(boston[, "crim"], boston[, "medv"],
     xlab = "犯罪率",
     ylab = "房價中位數",
     main = "犯罪率 vs 房價中位數的散佈圖",
     col = boston[, "chas"] + 5)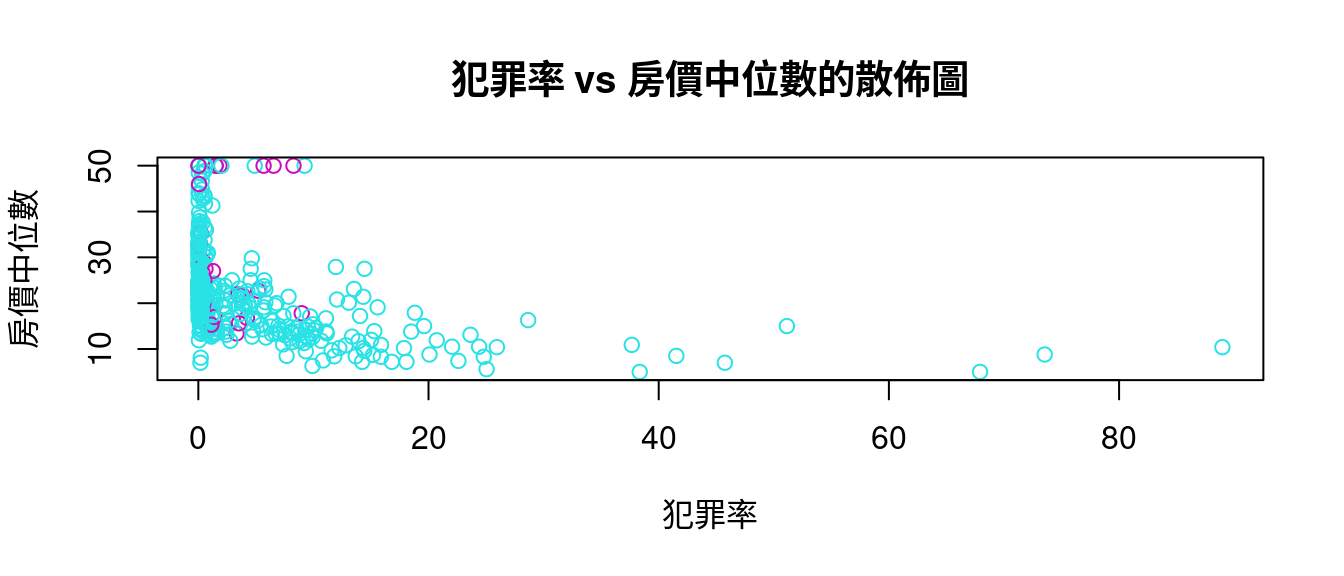
作者小編必須說,R的「圖學」確實是、已經是一門專門的學問了,讀者諸君如果想深入這一門學問,建議前進
…
12.4.2 專家的意見
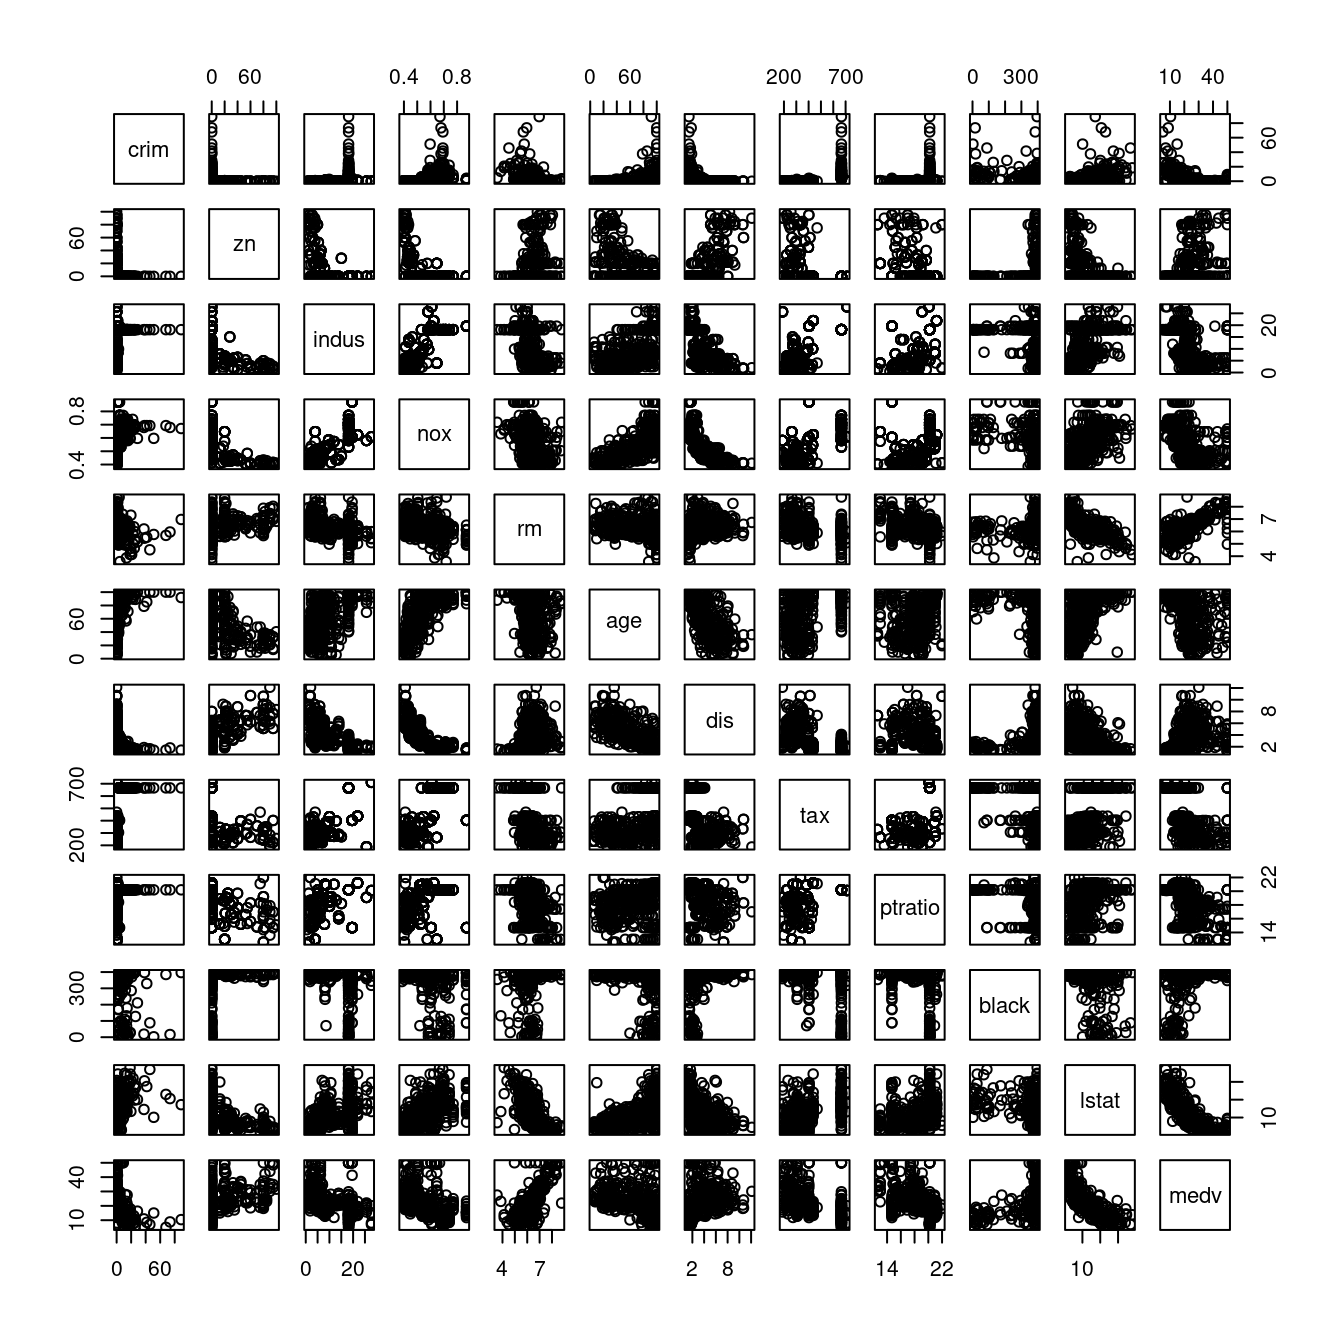
接下來,作者小編請來專家套件「caret」,讓我們快速取得波士頓數據集全部連續變數對上「房價中位數」的「散佈圖」。
require(caret)- 繪製全部連續變數對上「房價中位數」的「散佈圖」。
CONvars## [1] "crim" "zn" "indus" "nox" "rm" "age" "dis"
## [8] "tax" "ptratio" "black" "lstat" "medv"featurePlot(x = boston[, CONvars[-12]],
y = boston$medv)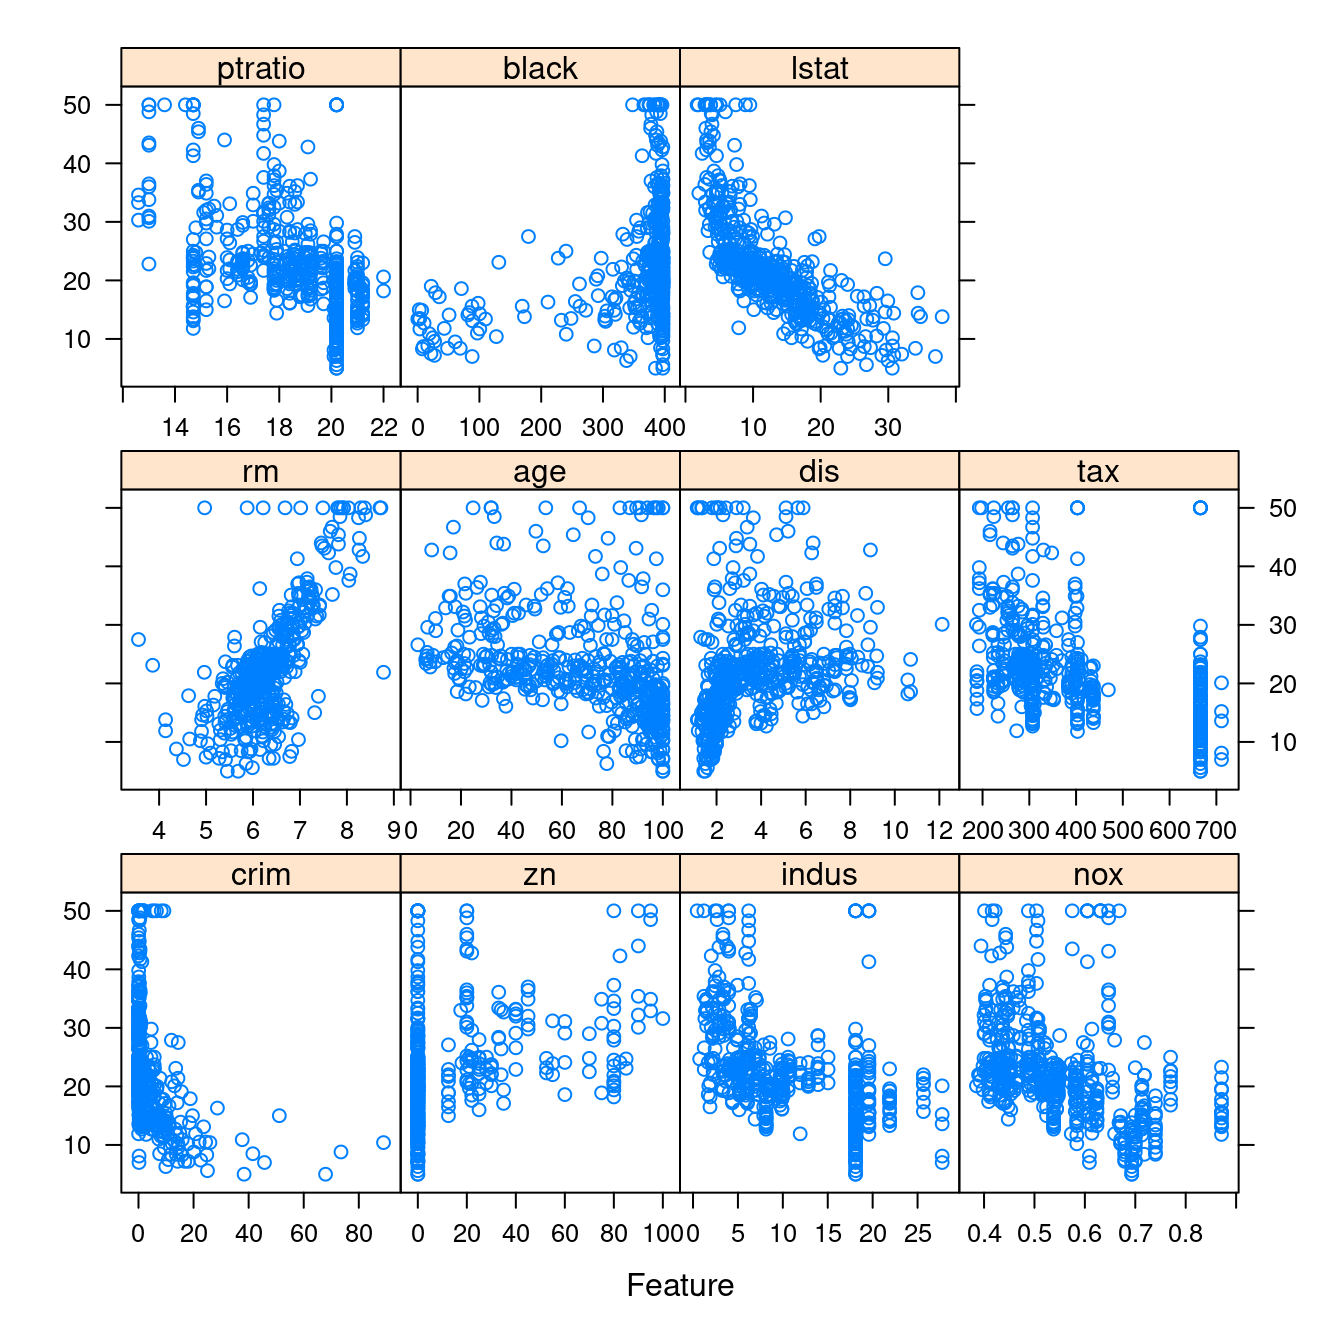
- 依據是否「是河岸宅」繪製全部連續變數對上「房價中位數」的「散佈圖」。「否」的畫一張、「是」的畫一張。
featurePlot(x = boston[which(boston$chas == 0), CONvars[-12]],
            y = boston$medv[which(boston$chas == 0)])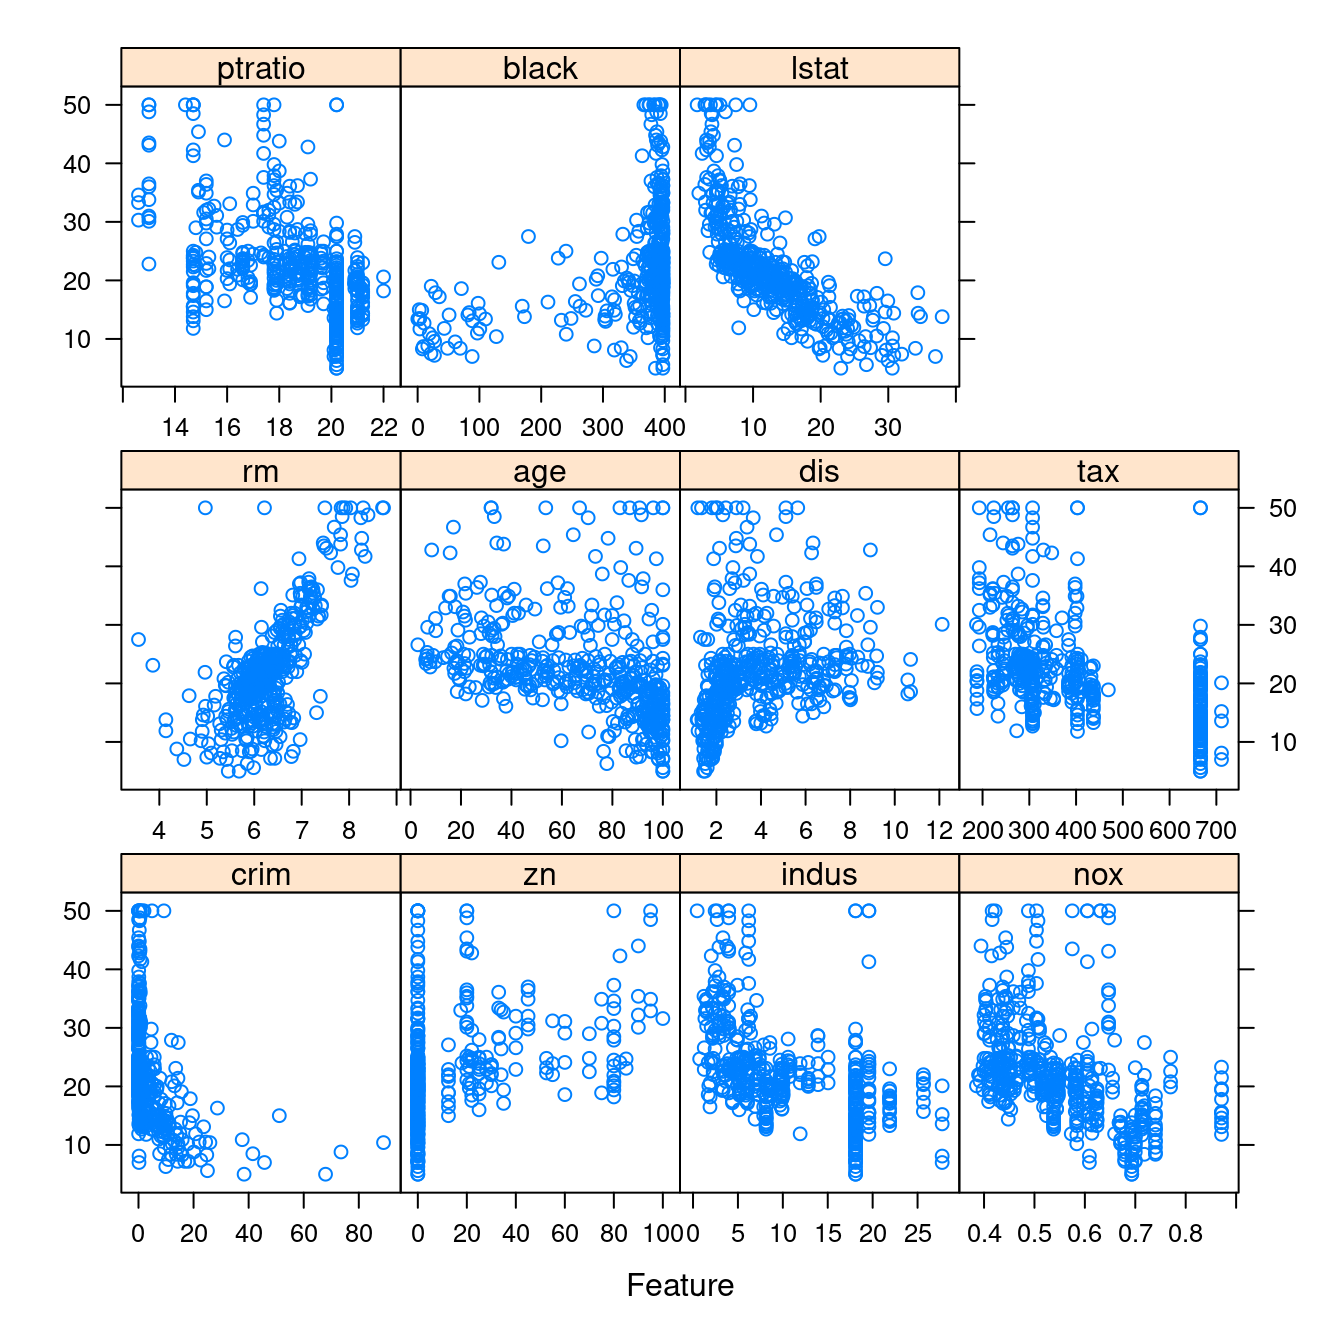
featurePlot(x = boston[which(boston$chas == 1), CONvars[-12]],
            y = boston$medv[which(boston$chas == 1)])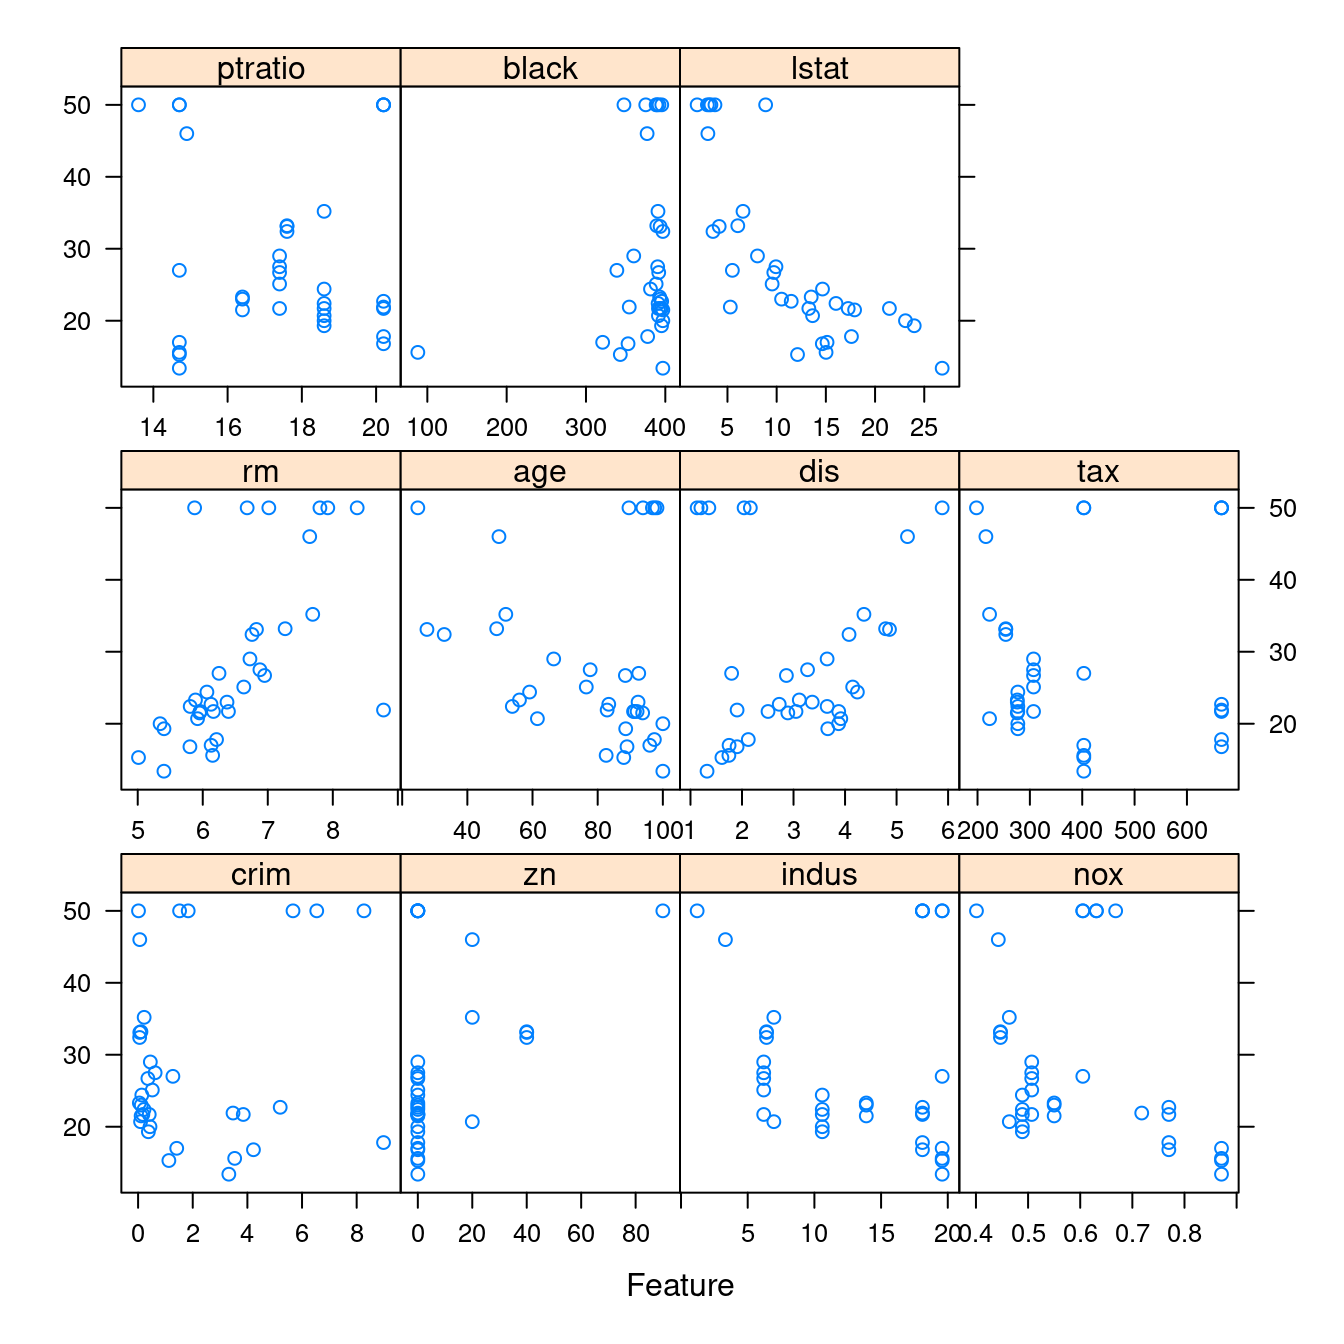
…
12.4.3 抓分群、分段的部分數據集
請讀者諸君再一次注意到
連戲
作者小編在編寫
依據是否「是河岸宅」繪製全部連續變數對上「房價中位數」的「散佈圖」。
時,先抓取了
繪製全部連續變數對上「房價中位數」的「散佈圖」。
的程式碼,下一步,我們一定會面臨這一個問題:
『是河岸宅』的數據在哪裡?『不是河岸宅』的數據在哪裡?
這個問題的答案是「which」,就是「which one」或是「which ones」,請先看官方使用手冊
knitr::include_url("https://www.rdocumentation.org/packages/base/versions/3.6.2/topics/which")…
作者小編抓官方提供的範例為各位解釋(作者小編加料)「which」的力道:
### 範例一:
which(LETTERS == "R") # R這一個英文字母是第幾個英文字母?
## [1] 18### 範例二:
which(LL <- c(TRUE, FALSE, TRUE, NA, FALSE, FALSE, TRUE)) # 「TRUE」的位置在哪裡?## [1] 1 3 7names(LL) <- letters[seq(LL)] # 命名。
LL # 作者小編加的,呼叫出來看看結果變成什麼樣?## a b c d e f g
## TRUE FALSE TRUE NA FALSE FALSE TRUEwhich(LL)## a c g
## 1 3 7### 範例三:
which((0:9)%%2 == 0) # 哪幾個是偶數?作者小編把「原1:12」改成「0:9」避免把位置誤解為數字。## [1] 1 3 5 7 9### 範例四:
which(1:10 > 3, arr.ind = TRUE) # 哪幾個位置的數字大於3?## [1] 4 5 6 7 8 9 10### 範例五:
(m <- matrix(1:12, 3, 4)) # 先創造一個3x4的矩陣。在最外圈加上「小括號()」R就會主動把結果顯示在螢幕上。## [,1] [,2] [,3] [,4]
## [1,] 1 4 7 10
## [2,] 2 5 8 11
## [3,] 3 6 9 12div.3 <- m %% 3 == 0 # 哪裡有3的倍數?
div.3## [,1] [,2] [,3] [,4]
## [1,] FALSE FALSE FALSE FALSE
## [2,] FALSE FALSE FALSE FALSE
## [3,] TRUE TRUE TRUE TRUEwhich(div.3) # 這種位置資訊不清楚,## [1] 3 6 9 12which(div.3, arr.ind = TRUE) # 所以,加上「arr.ind = TRUE」這樣可以顯示「列」跟「行」的資訊。## row col
## [1,] 3 1
## [2,] 3 2
## [3,] 3 3
## [4,] 3 4rownames(m) <- paste("Case", 1:3, sep = "_")
m## [,1] [,2] [,3] [,4]
## Case_1 1 4 7 10
## Case_2 2 5 8 11
## Case_3 3 6 9 12which(m %% 5 == 0, arr.ind = TRUE) # 哪裡有5的倍數?## row col
## Case_2 2 2
## Case_1 1 4### 範例六:
dim(m) <- c(2, 2, 3); m # 把原本矩陣m切成三個2x2矩陣。如果想要兩句話寫在同一行,兩句間要加上「;」。## , , 1
##
## [,1] [,2]
## [1,] 1 3
## [2,] 2 4
##
## , , 2
##
## [,1] [,2]
## [1,] 5 7
## [2,] 6 8
##
## , , 3
##
## [,1] [,2]
## [1,] 9 11
## [2,] 10 12div.3 <- m %% 3 == 0 # 哪裡有3的倍數?為原範例補上這兩句。
div.3## , , 1
##
## [,1] [,2]
## [1,] FALSE TRUE
## [2,] FALSE FALSE
##
## , , 2
##
## [,1] [,2]
## [1,] FALSE FALSE
## [2,] TRUE FALSE
##
## , , 3
##
## [,1] [,2]
## [1,] TRUE FALSE
## [2,] FALSE TRUEwhich(div.3, arr.ind = FALSE) # 記得一定要加上「arr.ind = TRUE」。## [1] 3 6 9 12which(div.3, arr.ind = TRUE)## dim1 dim2 dim3
## [1,] 1 2 1
## [2,] 2 1 2
## [3,] 1 1 3
## [4,] 2 2 3### 範例七:
vm <- c(m)
vm## [1] 1 2 3 4 5 6 7 8 9 10 11 12dim(vm) <- length(vm) #-- funny thing with length(dim(...)) == 1
vm## [1] 1 2 3 4 5 6 7 8 9 10 11 12div.3 <- vm %% 3 == 0 # 哪裡有3的倍數?為原範例補上這兩句。
which(div.3, arr.ind = FALSE)## [1] 3 6 9 12which(div.3, arr.ind = TRUE) # 這裡不一定需要加上「arr.ind = TRUE」。## dim1
## [1,] 3
## [2,] 6
## [3,] 9
## [4,] 1212.5 相關係數
請原諒作者小編「無(多)知(汁)」,讓我先抓維基百科的第一段為各位開場「相關係數」這一段:
In statistics, the Pearson correlation coefficient (PCC, pronounced /ˈpɪərsən/) is also referred to as Pearson’s r, the Pearson product-moment correlation coefficient (PPMCC), or the bivariate correlation.
作者小編喜歡「PPMCC」這一個縮寫,因為它「對稱」加上
which(LETTERS == "R")## [1] 18which(LETTERS == "P")## [1] 16which(LETTERS == "P")## [1] 16which(LETTERS == "M")## [1] 13which(LETTERS == "C")## [1] 3which(LETTERS == "C")## [1] 3…
12.5.1 共變異數
在認識「相關係數」之前,作者小編先介紹一個數字
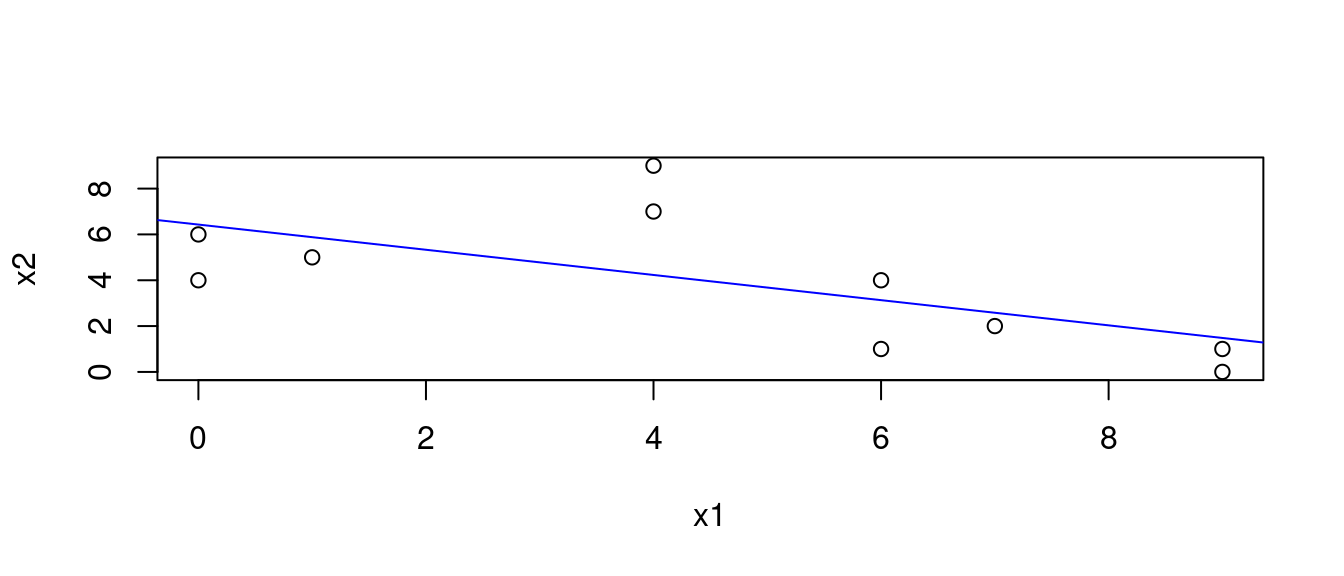
「共變異數」,是「變異數」前面加了一個「共」,統計學家企圖用這一個數字衡量,「兩變數『一起協同共變化』的程度」。為了介紹「共變異數」,我們先借用「鳶尾花數據集(iris)」製作一些假數據,然後用「電算手算」示範如何計算「共變異數」。
12.5.1.1 創造示範數據
data("iris")
x <- iris[,c("Sepal.Length", "Sepal.Width")] # 抓到其中兩個欄位。作者小編相信鳶尾花「sepal」的長跟寬應該有「協同變化」的現象。
head(x, 10)
## Sepal.Length Sepal.Width
## 1 5.1 3.5
## 2 4.9 3.0
## 3 4.7 3.2
## 4 4.6 3.1
## 5 5.0 3.6
## 6 5.4 3.9
## 7 4.6 3.4
## 8 5.0 3.4
## 9 4.4 2.9
## 10 4.9 3.1x <- (x*10) %% 10 # 抓第一個小數。
head(x, 10)## Sepal.Length Sepal.Width
## 1 1 5
## 2 9 0
## 3 7 2
## 4 6 1
## 5 0 6
## 6 4 9
## 7 6 4
## 8 0 4
## 9 4 9
## 10 9 1x <- x[!duplicated(x),] # 抓不重複的觀察值(左右各一個加起來)。
head(x, 10)## Sepal.Length Sepal.Width
## 1 1 5
## 2 9 0
## 3 7 2
## 4 6 1
## 5 0 6
## 6 4 9
## 7 6 4
## 8 0 4
## 10 9 1
## 11 4 7x <- x[1:10,] # 抓前十個。
head(x, 10)## Sepal.Length Sepal.Width
## 1 1 5
## 2 9 0
## 3 7 2
## 4 6 1
## 5 0 6
## 6 4 9
## 7 6 4
## 8 0 4
## 10 9 1
## 11 4 7rownames(x) <- 1:dim(x)[1] # 順號「觀察值編號」。
head(x, 10)## Sepal.Length Sepal.Width
## 1 1 5
## 2 9 0
## 3 7 2
## 4 6 1
## 5 0 6
## 6 4 9
## 7 6 4
## 8 0 4
## 9 9 1
## 10 4 7colnames(x) <- c("x1", "x2") # 換名字,避免困擾。
head(x, 10) # 呼叫答案,檢查最後的答案。## x1 x2
## 1 1 5
## 2 9 0
## 3 7 2
## 4 6 1
## 5 0 6
## 6 4 9
## 7 6 4
## 8 0 4
## 9 9 1
## 10 4 712.5.1.3 計算SSCP矩陣
mean(x$x1) # 「x1」的平均數。## [1] 4.6mean(x$x2) # 「x2」的平均數。## [1] 3.9x$x1mod <- x$x1 - mean(x$x1) # 平移到平均數。
x$x2mod <- x$x2 - mean(x$x2)
x## x1 x2 x1mod x2mod
## 1 1 5 -3.6 1.1
## 2 9 0 4.4 -3.9
## 3 7 2 2.4 -1.9
## 4 6 1 1.4 -2.9
## 5 0 6 -4.6 2.1
## 6 4 9 -0.6 5.1
## 7 6 4 1.4 0.1
## 8 0 4 -4.6 0.1
## 9 9 1 4.4 -2.9
## 10 4 7 -0.6 3.1x$ssx1 <- x$x1mod^2 # 「x1」的平方。
x$ssx2 <- x$x2mod^2 # 「x2」的平方。
x## x1 x2 x1mod x2mod ssx1 ssx2
## 1 1 5 -3.6 1.1 12.96 1.21
## 2 9 0 4.4 -3.9 19.36 15.21
## 3 7 2 2.4 -1.9 5.76 3.61
## 4 6 1 1.4 -2.9 1.96 8.41
## 5 0 6 -4.6 2.1 21.16 4.41
## 6 4 9 -0.6 5.1 0.36 26.01
## 7 6 4 1.4 0.1 1.96 0.01
## 8 0 4 -4.6 0.1 21.16 0.01
## 9 9 1 4.4 -2.9 19.36 8.41
## 10 4 7 -0.6 3.1 0.36 9.61x$scpx1x2 <- x$x1mod*x$x2mod # 「x1」跟「x2」的交叉積。
x## x1 x2 x1mod x2mod ssx1 ssx2 scpx1x2
## 1 1 5 -3.6 1.1 12.96 1.21 -3.96
## 2 9 0 4.4 -3.9 19.36 15.21 -17.16
## 3 7 2 2.4 -1.9 5.76 3.61 -4.56
## 4 6 1 1.4 -2.9 1.96 8.41 -4.06
## 5 0 6 -4.6 2.1 21.16 4.41 -9.66
## 6 4 9 -0.6 5.1 0.36 26.01 -3.06
## 7 6 4 1.4 0.1 1.96 0.01 0.14
## 8 0 4 -4.6 0.1 21.16 0.01 -0.46
## 9 9 1 4.4 -2.9 19.36 8.41 -12.76
## 10 4 7 -0.6 3.1 0.36 9.61 -1.86SSCP <- apply(x[,c(5,7,7,6)], 2, sum) # 計算總和。
SSCP## ssx1 scpx1x2 scpx1x2.1 ssx2
## 104.4 -57.4 -57.4 76.9SSCP <- matrix(SSCP, 2, 2) # 變成、排成2x2矩陣。
SSCP## [,1] [,2]
## [1,] 104.4 -57.4
## [2,] -57.4 76.9dimnames(SSCP) <- list(names(x)[1:2], names(x)[1:2]) # 取名字。
SSCP # 這就是「SSCP = sum of squares and cross-product」矩陣。## x1 x2
## x1 104.4 -57.4
## x2 -57.4 76.912.5.1.4 取得變異數-共變異數矩陣
S <- SSCP/(NROW(x) - 1)
S # 呼叫答案檢查答案
## x1 x2
## x1 11.600000 -6.377778
## x2 -6.377778 8.544444var(x$x1)## [1] 11.6var(x$x2)## [1] 8.544444cov(x$x1, x$x2)## [1] -6.377778cov(x$x2, x$x1)## [1] -6.377778var(x[, c("x1", "x2")])## x1 x2
## x1 11.600000 -6.377778
## x2 -6.377778 8.54444412.5.2 什麼是相關係數?
我們先看「示範數據」的「相關係數」:
cor(x = x$x1, y = x$x2)## [1] -0.640617SSCP## x1 x2
## x1 104.4 -57.4
## x2 -57.4 76.9SSCP[1,2]/sqrt(SSCP[1,1] * SSCP[2,2])## [1] -0.640617SSCP[2,1]/sqrt(SSCP[1,1] * SSCP[2,2])## [1] -0.640617「電算手算」大成功!因為「電算手算」的答案跟「電算」的答案一模一樣!
…
12.5.2.1 性質一:平移變數不會改變相關係數
請看電算程式「cor」的示範:
cor(x$x1, x$x2)## [1] -0.640617cor(x$x1mod, x$x2)## [1] -0.640617cor(x$x1, x$x2mod)## [1] -0.640617cor(x$x1mod, x$x2mod)## [1] -0.64061712.5.2.2 性質二:個別變大變小變數不會改變相關係數
請看電算程式「cor」的示範:
cor(x$x1, x$x2)## [1] -0.640617cor(x$x1, 3 * x$x2)## [1] -0.640617cor(3 * x$x1, x$x2)## [1] -0.640617cor(3 * x$x1, 3 * x$x2)## [1] -0.64061712.5.2.3 幾組波士頓數據集連續型變數的相關係數
觀察過至少一輪「不分x變數跟y變數的散佈圖」的結果之後,作者小編決定先看看以下這兩組變數的相關係數:
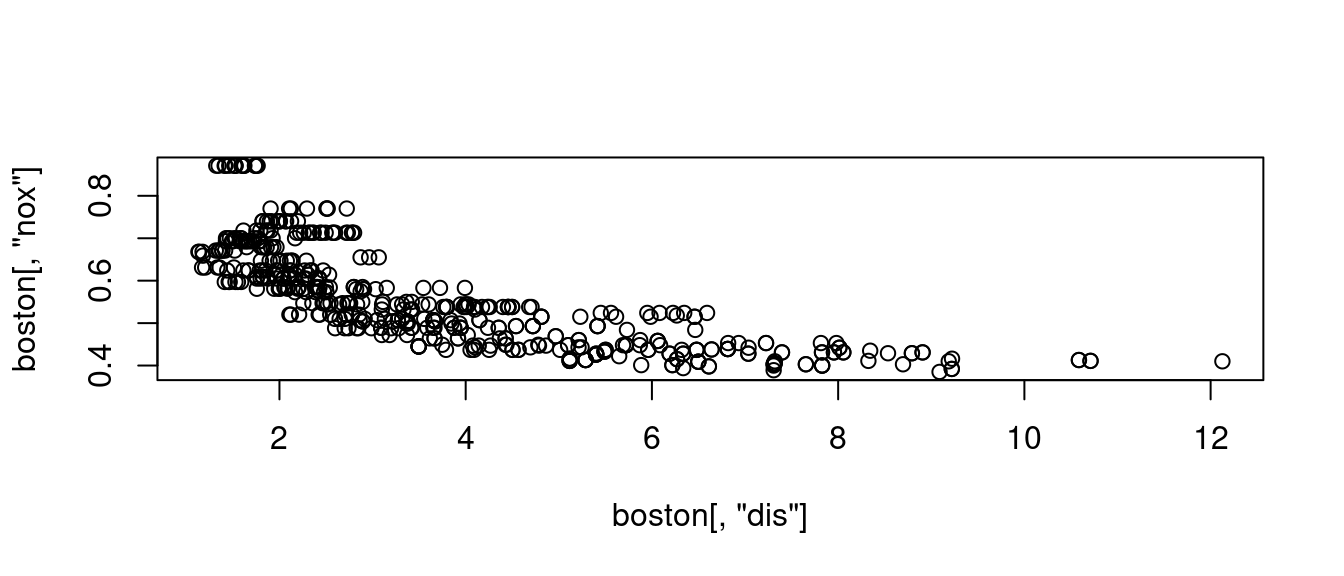
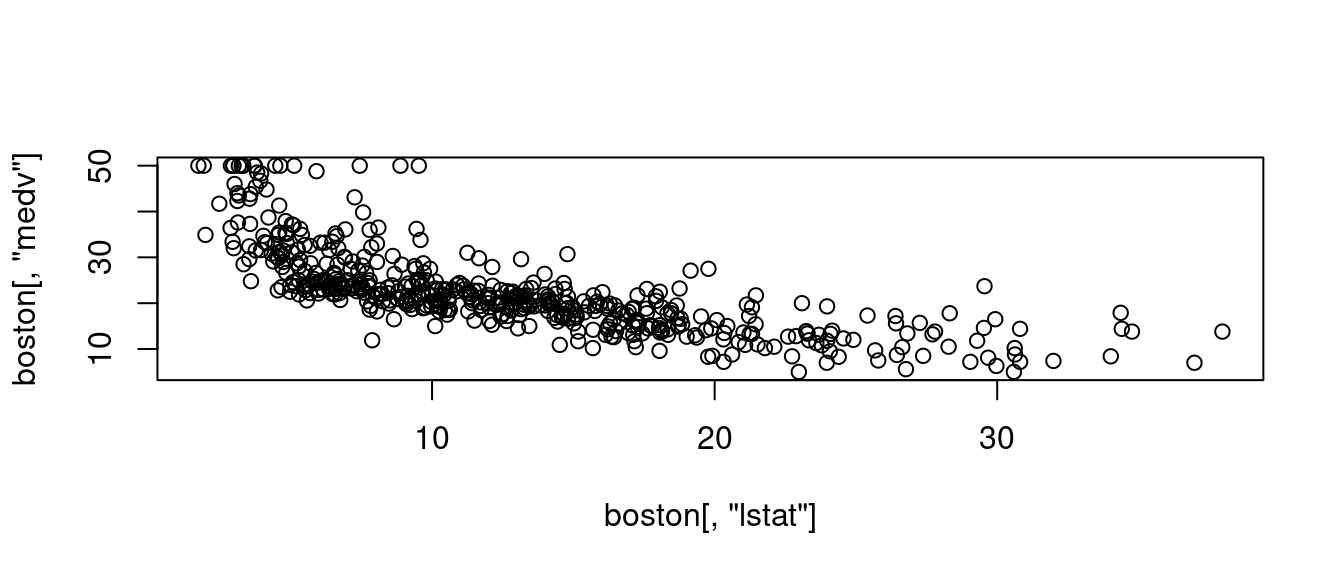
cor(boston[, "dis"], boston[, "nox"])## [1] -0.7692301cor(boston[, "lstat"], boston[, "medv"])## [1] -0.7376627其中
- 「負號(
-)」代表「x變數越大y變數越小」、 - 「數字越靠近
1」代表「點點越靠近某一條直線」。
接下來,這一張維基百科提供的例子,補充了作者小編想像不到的可能性:
knitr::include_graphics("www/800px-Correlation_examples2.png")## Error in knitr::include_graphics("www/800px-Correlation_examples2.png"): Cannot find the file(s): "www/800px-Correlation_examples2.png"看過之後,作者小編再一次確認「相關係數(Pearson correlation coefficient)」這一個數字確實是一個
「衡量」兩連續型變數「線性關係強度」的數字。
那,「相關係數(Pearson correlation coefficient)」怎麼算出來的呢?定義如下:
\[\frac{\sum (x - \bar x)(y - \bar y)}{\sqrt{\sum (x - \bar x)^2 \sum (y - \bar y)^2}}\]
其中「\(\bar x\)」是「x變數」的「平均數」,「\(\bar y\)」是「y變數」的「平均數」。「分子」是「交叉積和」,「分母」是「兩平方和乘積的正方根」。讓我們再抓一組變數來瞧瞧
plot(boston[, "age"], boston[, "dis"])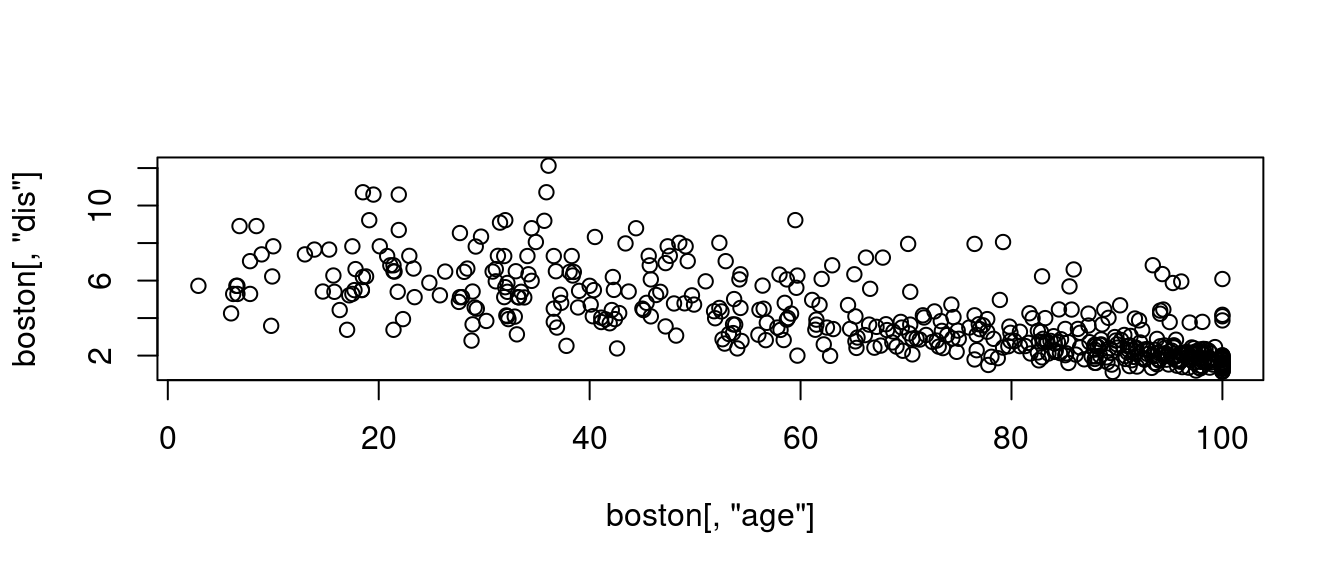
cor(boston[, "age"], boston[, "dis"])## [1] -0.7478805很幸運,我們抓到「強度接近」,都是「0.7多」,而且都是「負向」的「相關係數」。作者小編決定把它們放在一起,應該可以「強化」我們對「相關係數」的印象、理解、認識。
par(mfrow = c(1,3))
plot(boston[, "dis"], boston[, "nox"])
title(paste0("相關係數", " = ", cor(boston[, "dis"], boston[, "nox"])))
plot(boston[, "lstat"], boston[, "medv"])
title(paste0("相關係數", " = ", cor(boston[, "lstat"], boston[, "medv"])))
plot(boston[, "age"], boston[, "dis"])
title(paste0("相關係數", " = ", cor(boston[, "age"], boston[, "dis"])))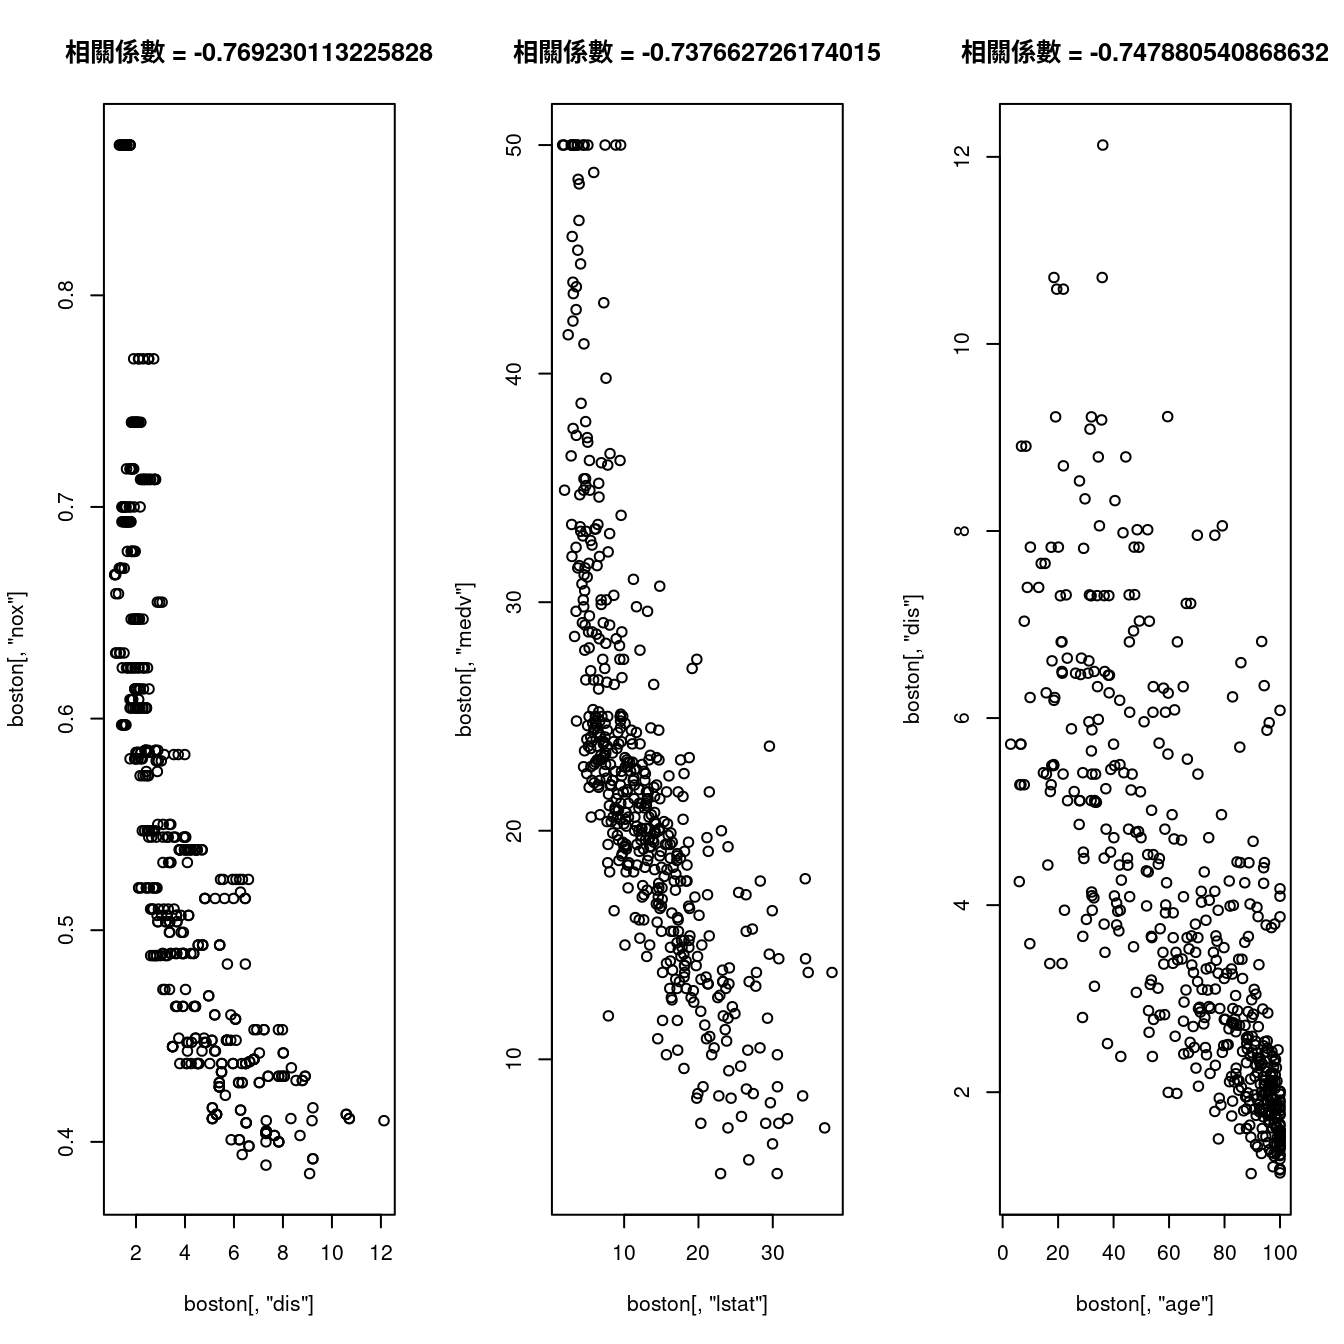
請注意,作者小編正在示範如何透過程式促進我們對某一件事情的理解程度。
12.5.2.4 計算波士頓數據集內11個連續型變數與房價中位數的相關係數
cor(x = boston[, CONvars[-12]], y = boston[, "medv"])## [,1]
## crim -0.3883046
## zn 0.3604453
## indus -0.4837252
## nox -0.4273208
## rm 0.6953599
## age -0.3769546
## dis 0.2499287
## tax -0.4685359
## ptratio -0.5077867
## black 0.3334608
## lstat -0.7376627我們發現(連戲)
CORmedv <- cor(x = boston[, CONvars[-12]], y = boston[, "medv"])
rownames(CORmedv)[which(abs(CORmedv[,1]) <= 0.3)] # 小於0.3。
## [1] "dis"rownames(CORmedv)[which(abs(CORmedv[,1]) > 0.3 & abs(CORmedv[,1]) <= 0.5)] # 大於0.3且小於0.5。## [1] "crim" "zn" "indus" "nox" "age" "tax" "black"rownames(CORmedv)[which(abs(CORmedv[,1]) > 0.5 & abs(CORmedv[,1]) <= 0.7)] # 大於0.5且小於0.7。## [1] "rm" "ptratio"rownames(CORmedv)[which(abs(CORmedv[,1]) > 0.7)] # 大於0.7。## [1] "lstat"也發現
rownames(CORmedv)[which.max(abs(CORmedv[,1]))] # 最大相關係數發生在哪一個變數?## [1] "lstat"因為這個發現,作者小編寫了這一段
maxCOR <- rownames(CORmedv)[which.max(abs(CORmedv[,1]))]
plot(boston[, maxCOR], boston[, "medv"],
     xlab = maxCOR,
     ylab = "房價中位數")
title(paste0("相關係數", " = ",
             cor(boston[, maxCOR],
                 boston[, "medv"])))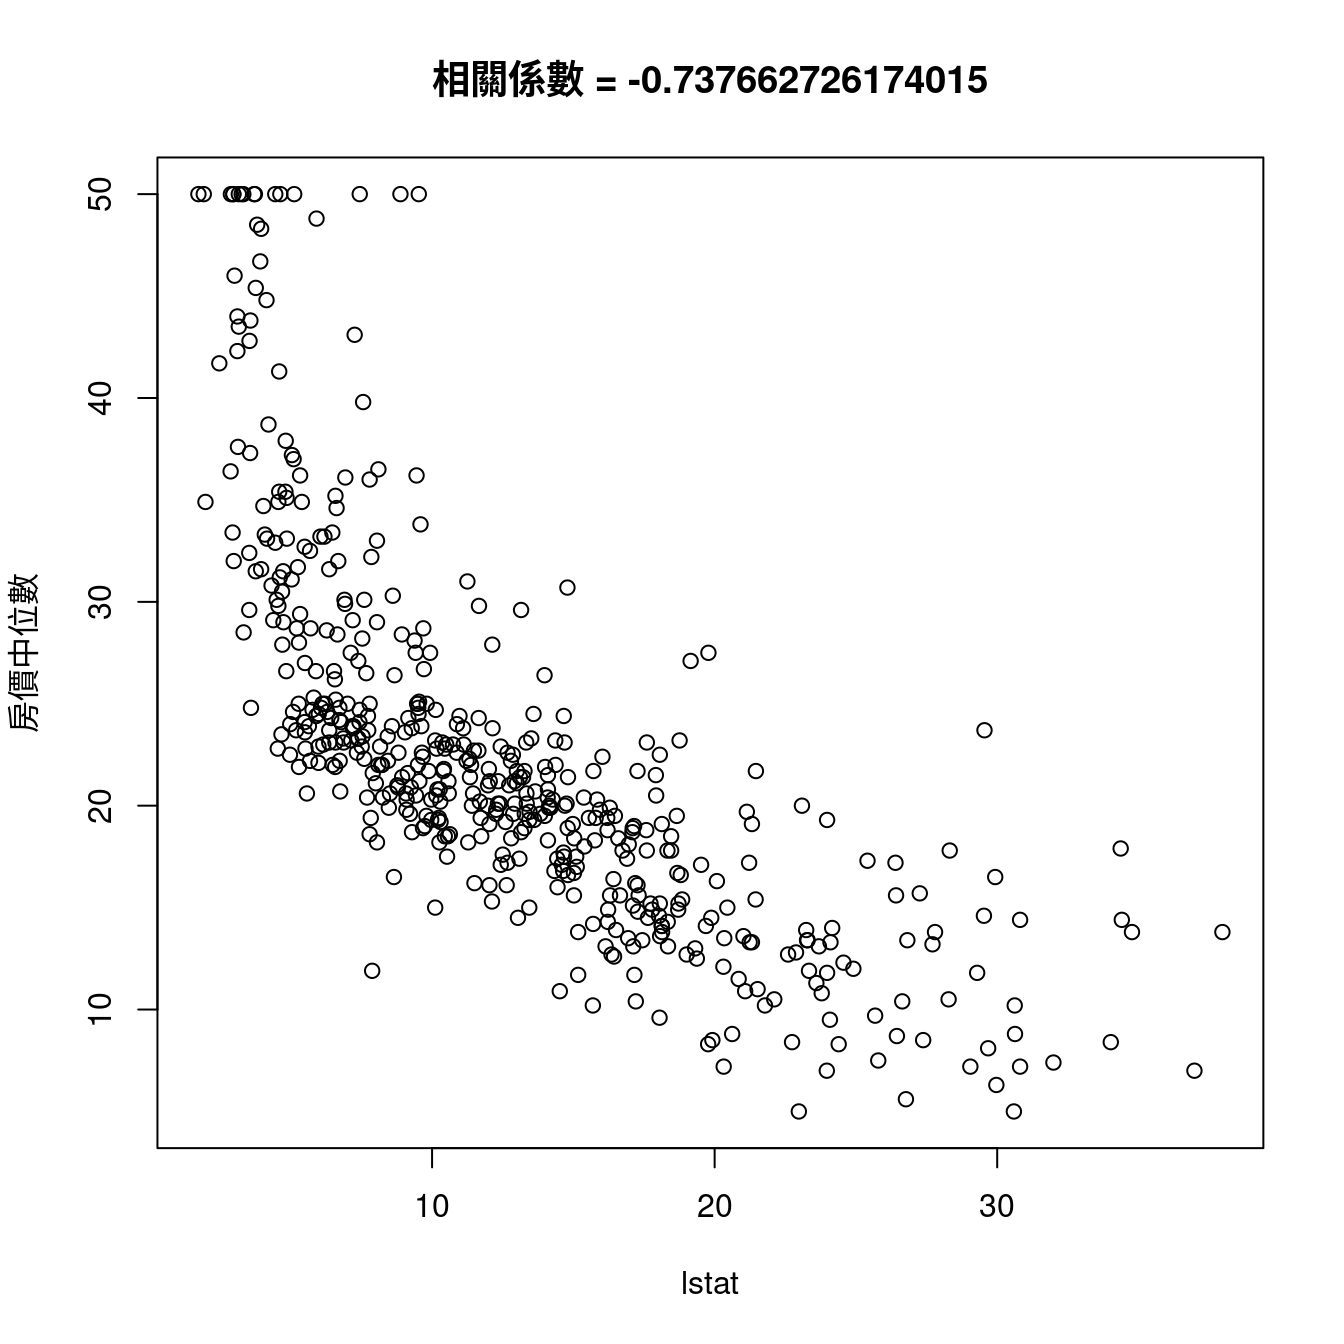
12.5.3 相關係數矩陣
以下這張表是波士頓數據集全部連續型變數,「兩兩之間」「cor」算出來的相關係數,比如說
- 「列名稱 =
crim」跟「行名稱 =crim」的相關係數是「1.00」。 - 「列名稱 =
crim」跟「行名稱 =zn」的相關係數是「-0.20」。 - 「列名稱 =
zn」跟「行名稱 =crim」的相關係數是「-0.20」。
as.data.frame.matrix(round(cor(boston[, CONvars]), 2))## crim zn indus nox rm age dis tax ptratio black lstat
## crim 1.00 -0.20 0.41 0.42 -0.22 0.35 -0.38 0.58 0.29 -0.39 0.46
## zn -0.20 1.00 -0.53 -0.52 0.31 -0.57 0.66 -0.31 -0.39 0.18 -0.41
## indus 0.41 -0.53 1.00 0.76 -0.39 0.64 -0.71 0.72 0.38 -0.36 0.60
## nox 0.42 -0.52 0.76 1.00 -0.30 0.73 -0.77 0.67 0.19 -0.38 0.59
## rm -0.22 0.31 -0.39 -0.30 1.00 -0.24 0.21 -0.29 -0.36 0.13 -0.61
## age 0.35 -0.57 0.64 0.73 -0.24 1.00 -0.75 0.51 0.26 -0.27 0.60
## dis -0.38 0.66 -0.71 -0.77 0.21 -0.75 1.00 -0.53 -0.23 0.29 -0.50
## tax 0.58 -0.31 0.72 0.67 -0.29 0.51 -0.53 1.00 0.46 -0.44 0.54
## ptratio 0.29 -0.39 0.38 0.19 -0.36 0.26 -0.23 0.46 1.00 -0.18 0.37
## black -0.39 0.18 -0.36 -0.38 0.13 -0.27 0.29 -0.44 -0.18 1.00 -0.37
## lstat 0.46 -0.41 0.60 0.59 -0.61 0.60 -0.50 0.54 0.37 -0.37 1.00
## medv -0.39 0.36 -0.48 -0.43 0.70 -0.38 0.25 -0.47 -0.51 0.33 -0.74
## medv
## crim -0.39
## zn 0.36
## indus -0.48
## nox -0.43
## rm 0.70
## age -0.38
## dis 0.25
## tax -0.47
## ptratio -0.51
## black 0.33
## lstat -0.74
## medv 1.00請讀者諸君注意,「cor」給我們的成果、輸出,確實是一張「矩陣」,經過作者小編「化了幾筆妝」
- 四捨五入到兩位小數,「
round(, 2)」、 - 變身為一張表,「
as.data.frame.matrix()」。
才讓各位看到上述這一張「美美的樣子」。
12.5.4 相關係數圖
「視覺化」相關係數矩陣是趨勢,原因是,實務上上述「相關係數矩陣」都很大,於是乎,統計學家再度出動,撰寫了套件「corrplot」。讓作者小編告訴大家如何用在波士頓數據集的相關係數矩陣:
- 呼叫套件「
corrplot」。
require(corrplot)- 準備波士頓數據集內連續型變數的相關係數矩陣。
corr <- round(cor(boston[, CONvars]), 2)- 繪製相關係數圖。把一切都交給
corrplot::corrplot決定。如果你關注第一個連續型變數「crim」與其他連續型變數的相關係數之間的「相對大小」與「正負號」,在最左邊類似「觀察值編號」的那一排名字找到「crim」,然後往右看,遇上「紅色圈圈」表示「負的相關係數」,遇上「藍色圈圈」表示「正的相關係數」,「圈圈越大」或是「顏色越深」,表示「數值越大」。
corrplot(corr)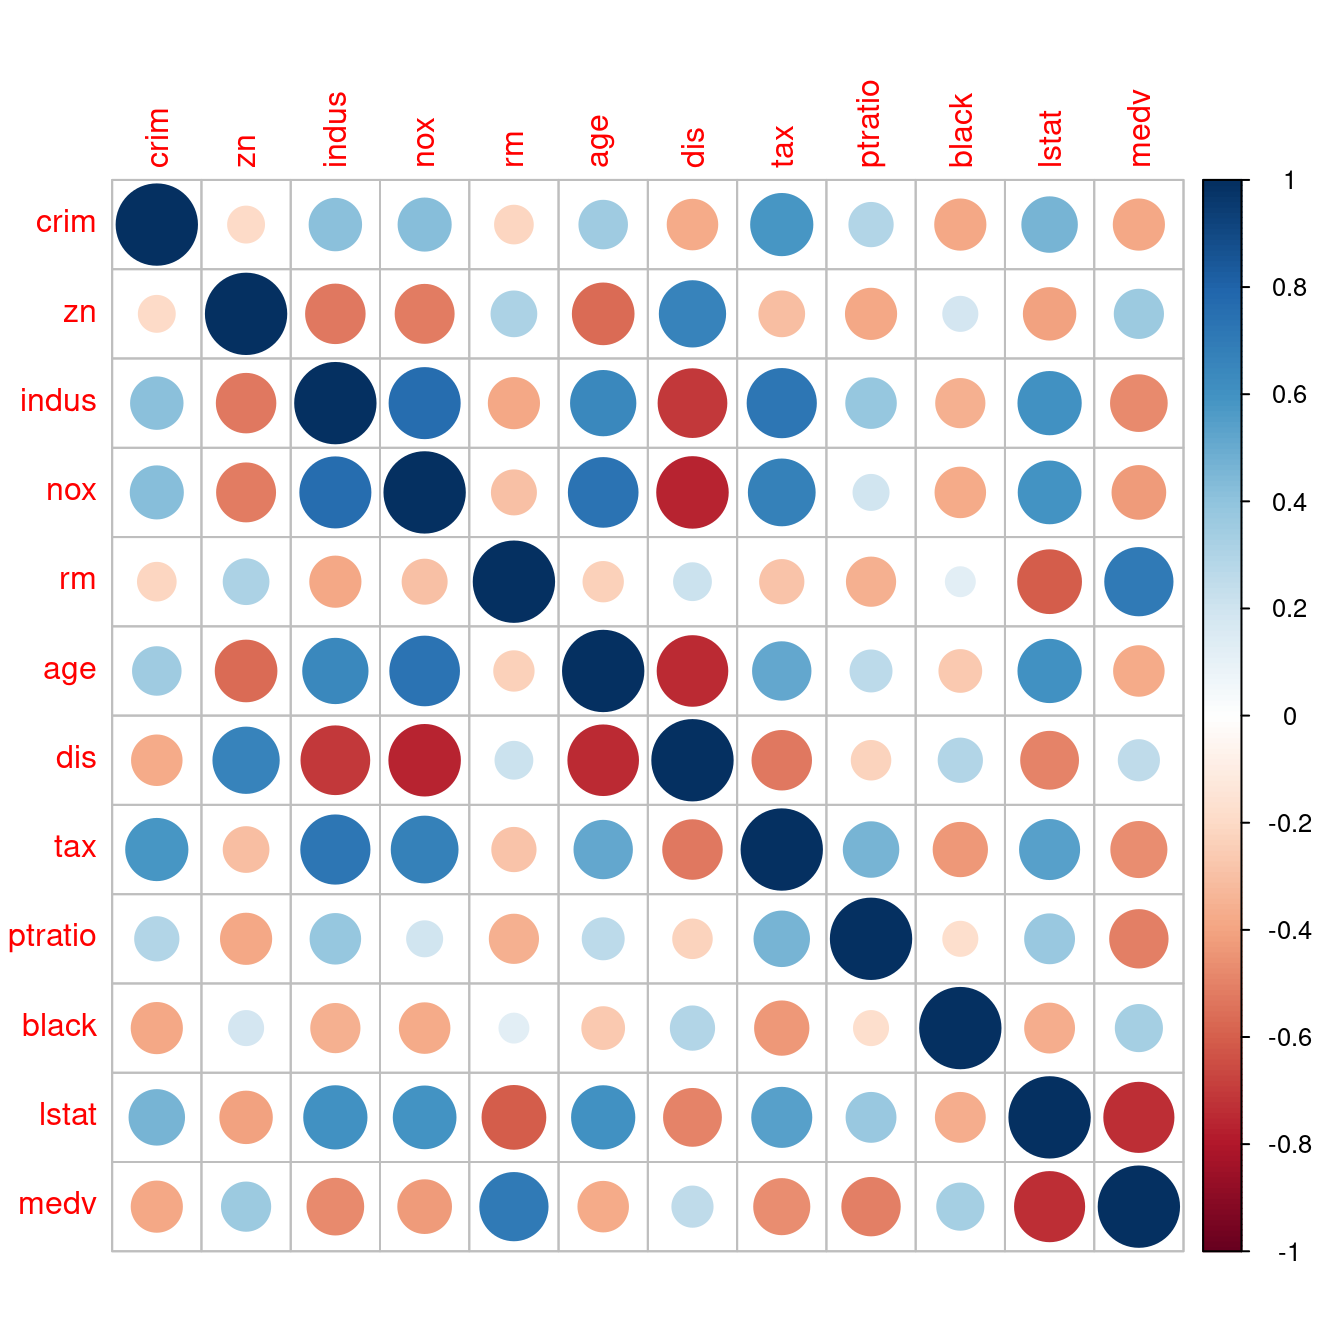
- 解決問題一:既然相關係數矩陣是對稱的,可以只看一半嗎?
corrplot::corrplot讓你加一句「type = "upper"」看「上半矩陣」;如果是「type = "lower"」看「下半矩陣」。
corrplot(corr, type = "upper")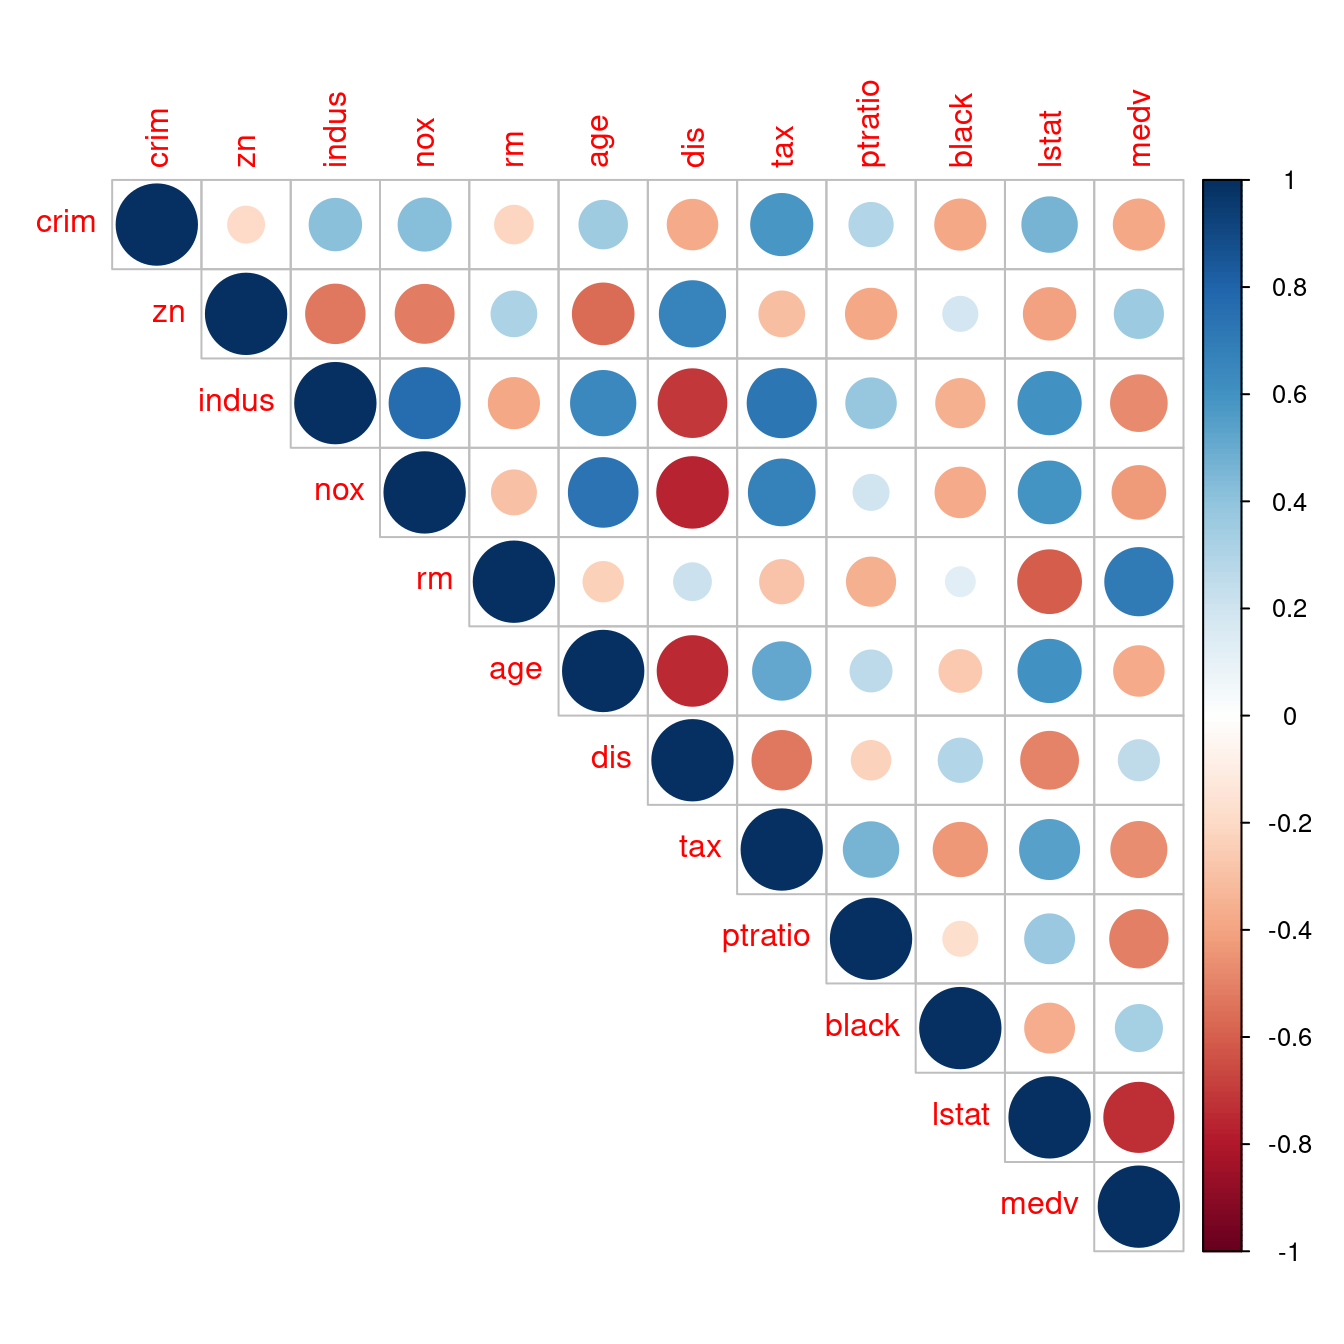
corrplot(corr, type = "lower")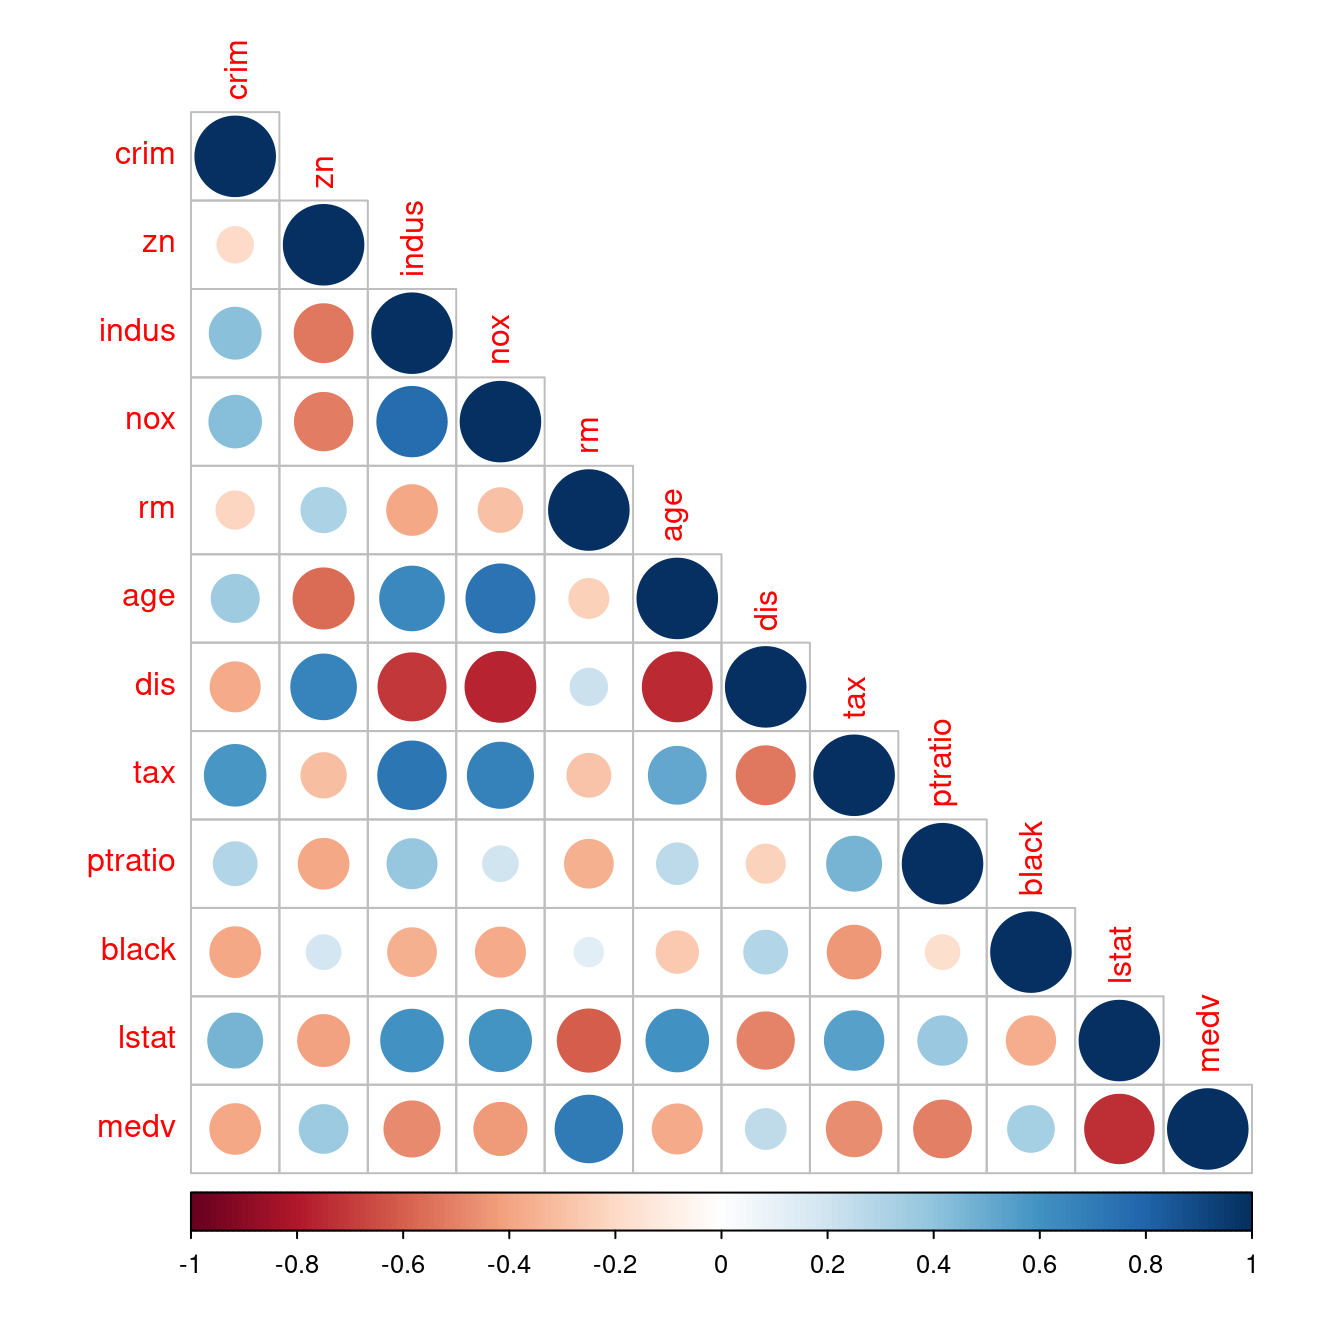
- 解決問題二:可以根據與房價中位數的相關係數大小排序嗎?因為「房價中位數」是第十二個變數,所以在「列方向」與「行方向」都加一句「
order(corr[12,])」,就可以維持「相關係數矩陣是對稱的」這一項性質。請讀者諸君專注在「最後一列」跟「最後一行」。完美!而且我們可以很輕鬆知道「全部連續型變數(lstat, ptratio, indus, tax, nox, crim, age, dis, black, zn, rm, medv)」與「房價中位數」的相關係數的「排行榜」!當然也可以有「按相關係數數值大小的排行榜」!作者小編認為第二個排行榜應該有助於「多個x變數的建模策略」,將在第八章實作、實驗這一項臆測!
corr <- corr[order(corr[12,]), order(corr[12,])]
corrplot(corr)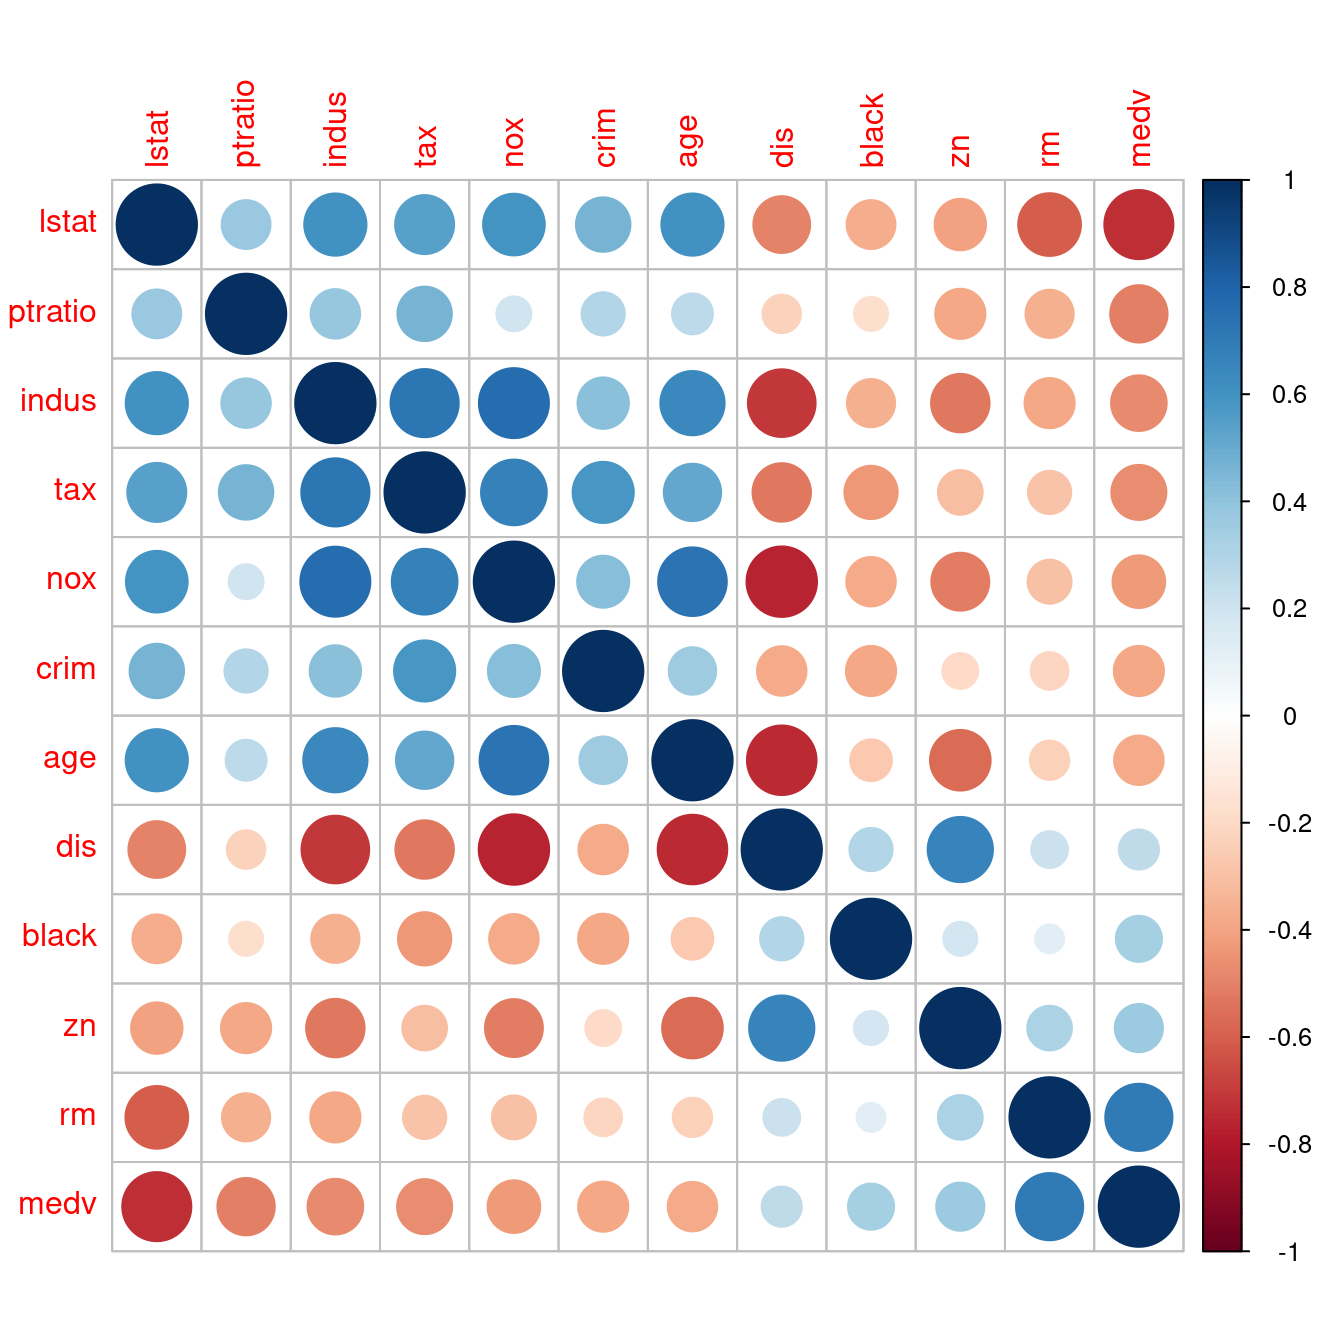
corr <- corr[order(abs(corr[12,])), order(abs(corr[12,]))]
corrplot(corr)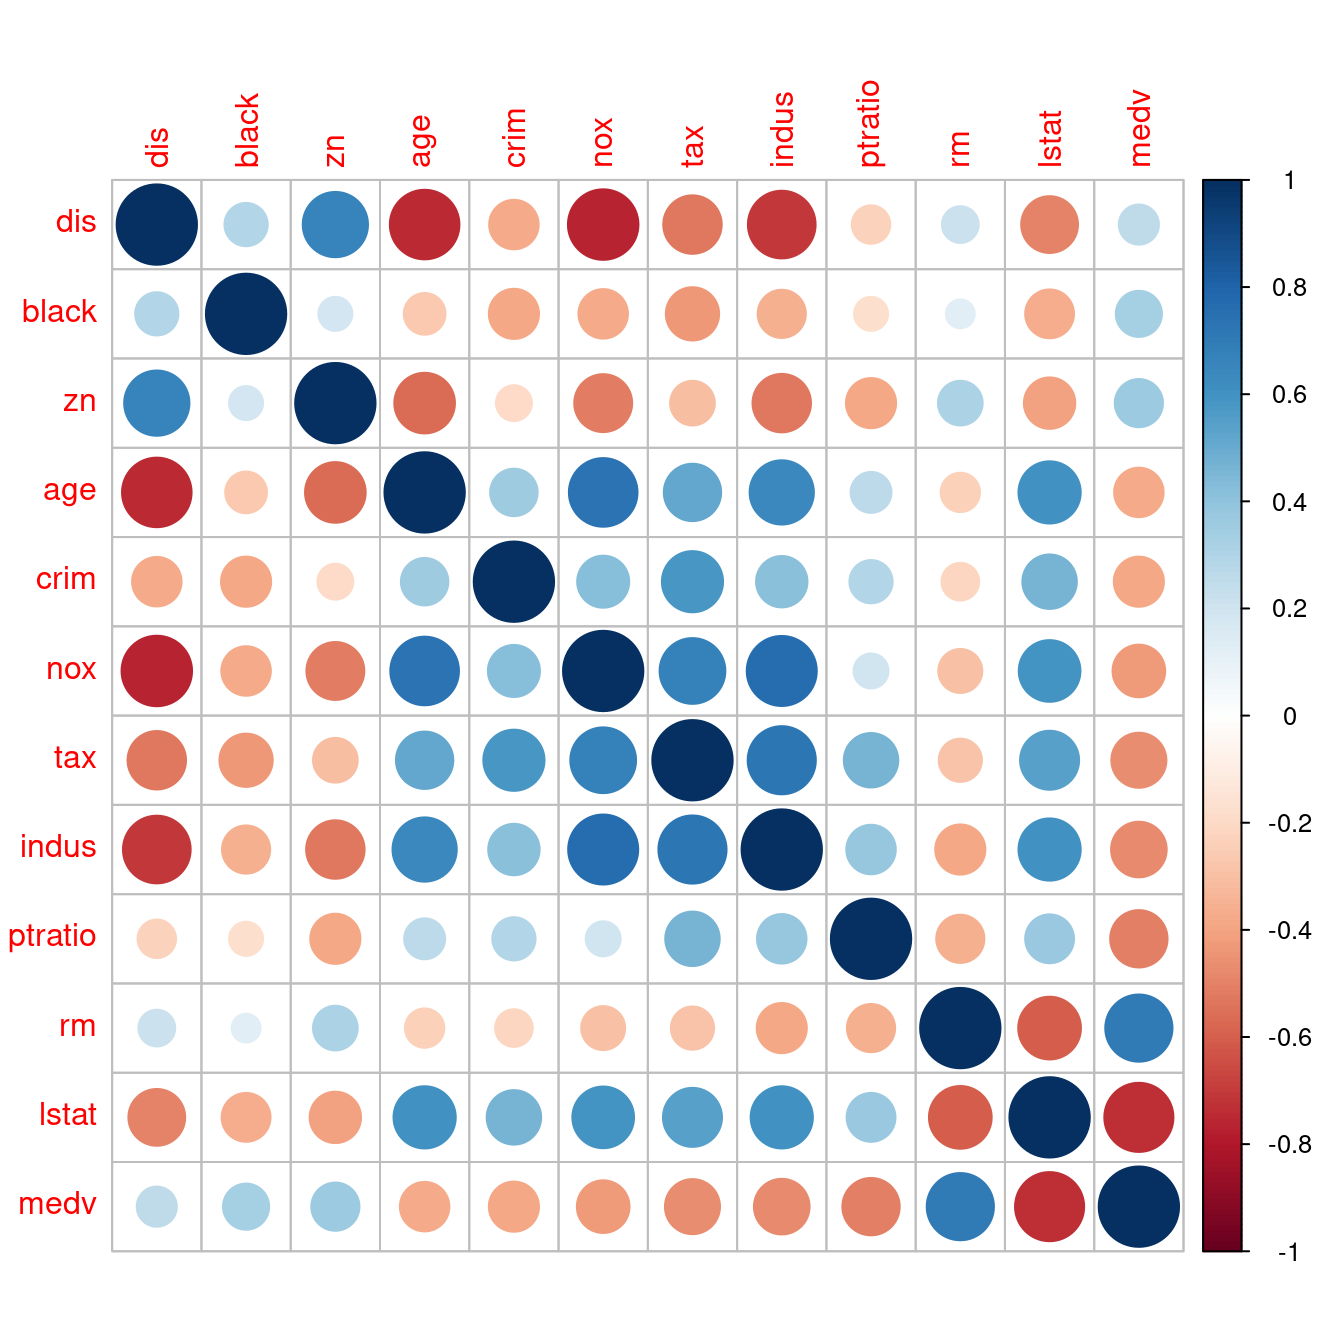
- 解決問題三:可以把全部變數分類掉、分開來嗎?讓我們一小群一小群觀察嗎?請讀者諸君仔細看,可以發現「四大區塊」,至於「四大區塊」可以為我們在搜尋「1970年代波士頓都會區的最佳『hedonic housing price model』」,幫上什麼忙?就指日可待!!!
corrplot(corr, order = "FPC")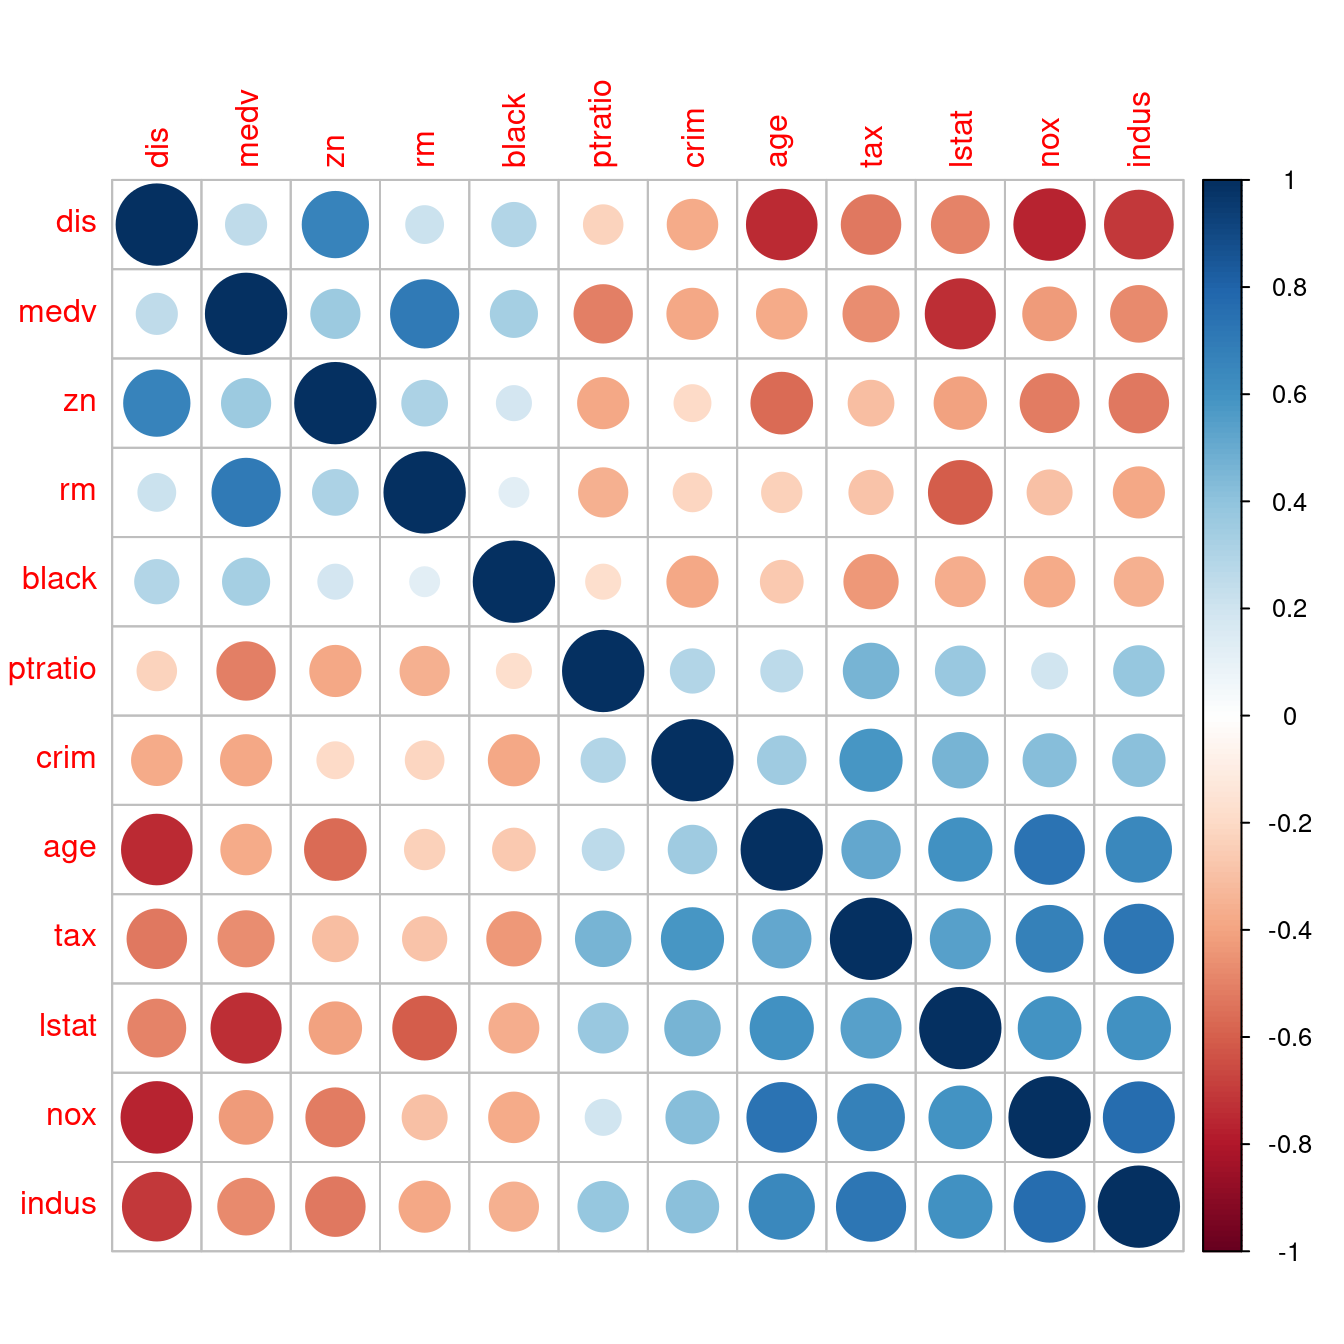
corrplot(corr, order = "hclust")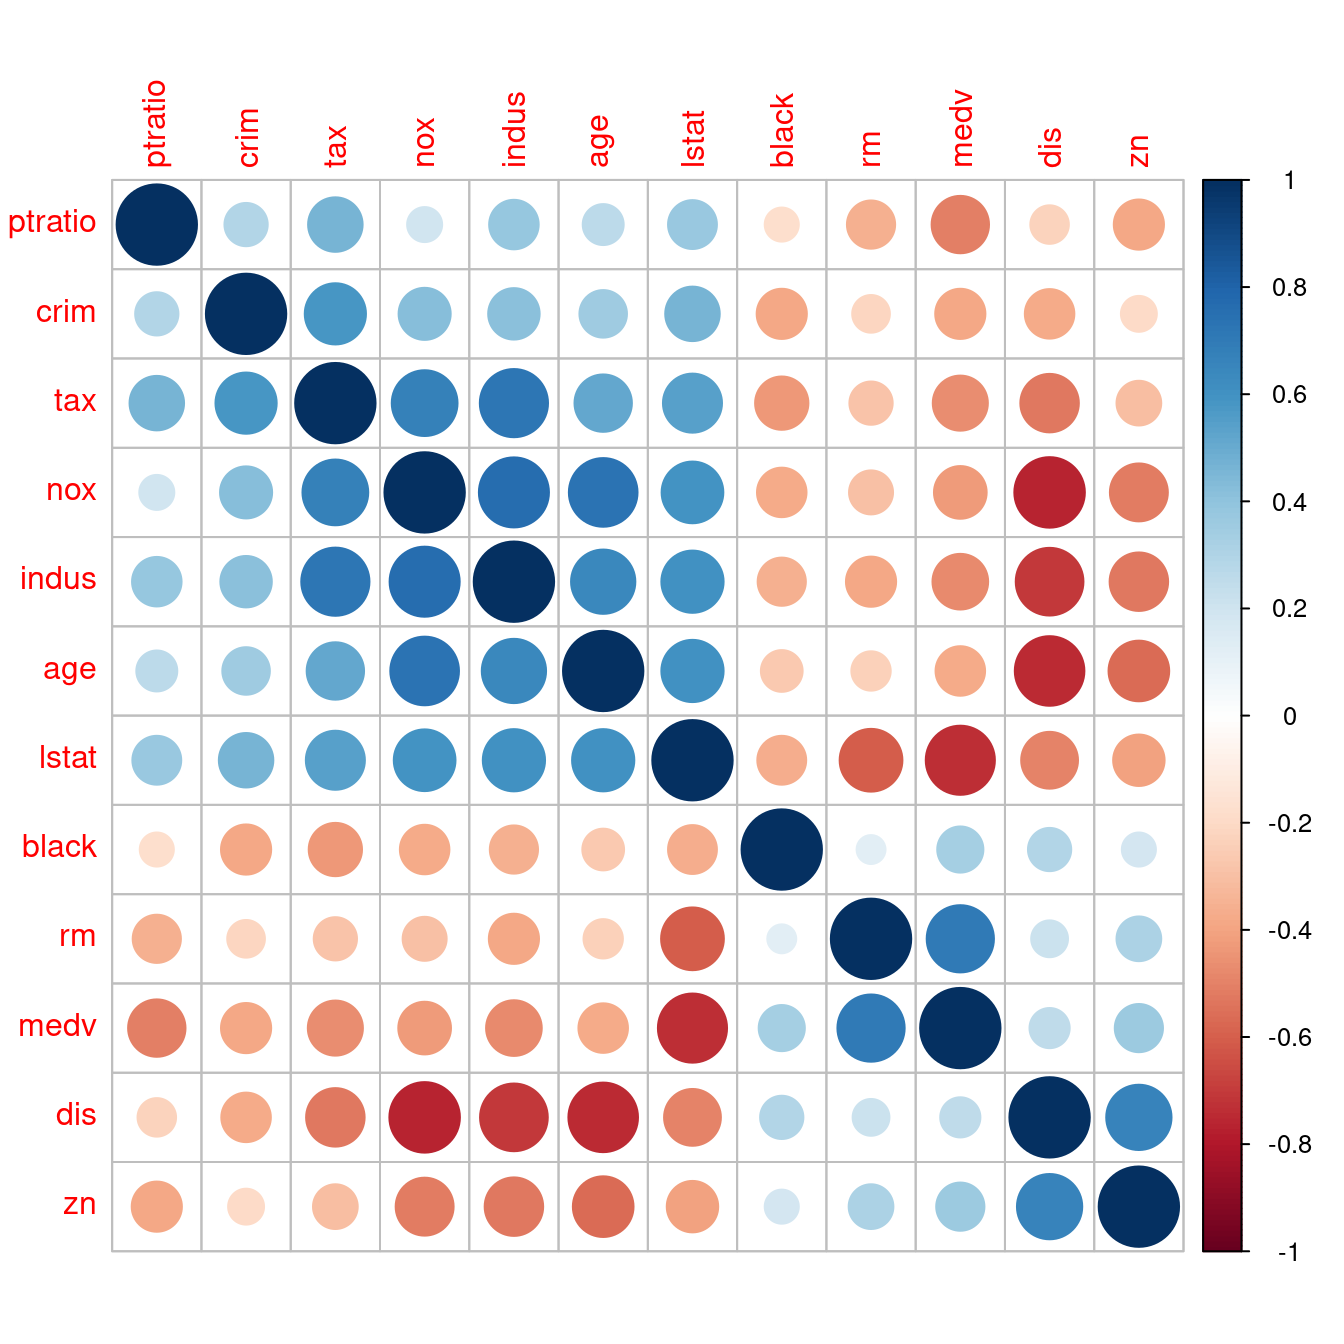
到此,我們已經學過、看過
- 直方圖
- 密度圖
- 散佈圖
- 相關係數
- (還缺)相關係數檢定
- (還缺)修勻
透過下述這一個套件「PerformanceAnalytics」的「chart.Correlation」,可以把這六項技術整合在一張大圖裡。請看…
require(PerformanceAnalytics)
chart.Correlation(boston[, CONvars],
                  histogram = TRUE,
                  pch = 8)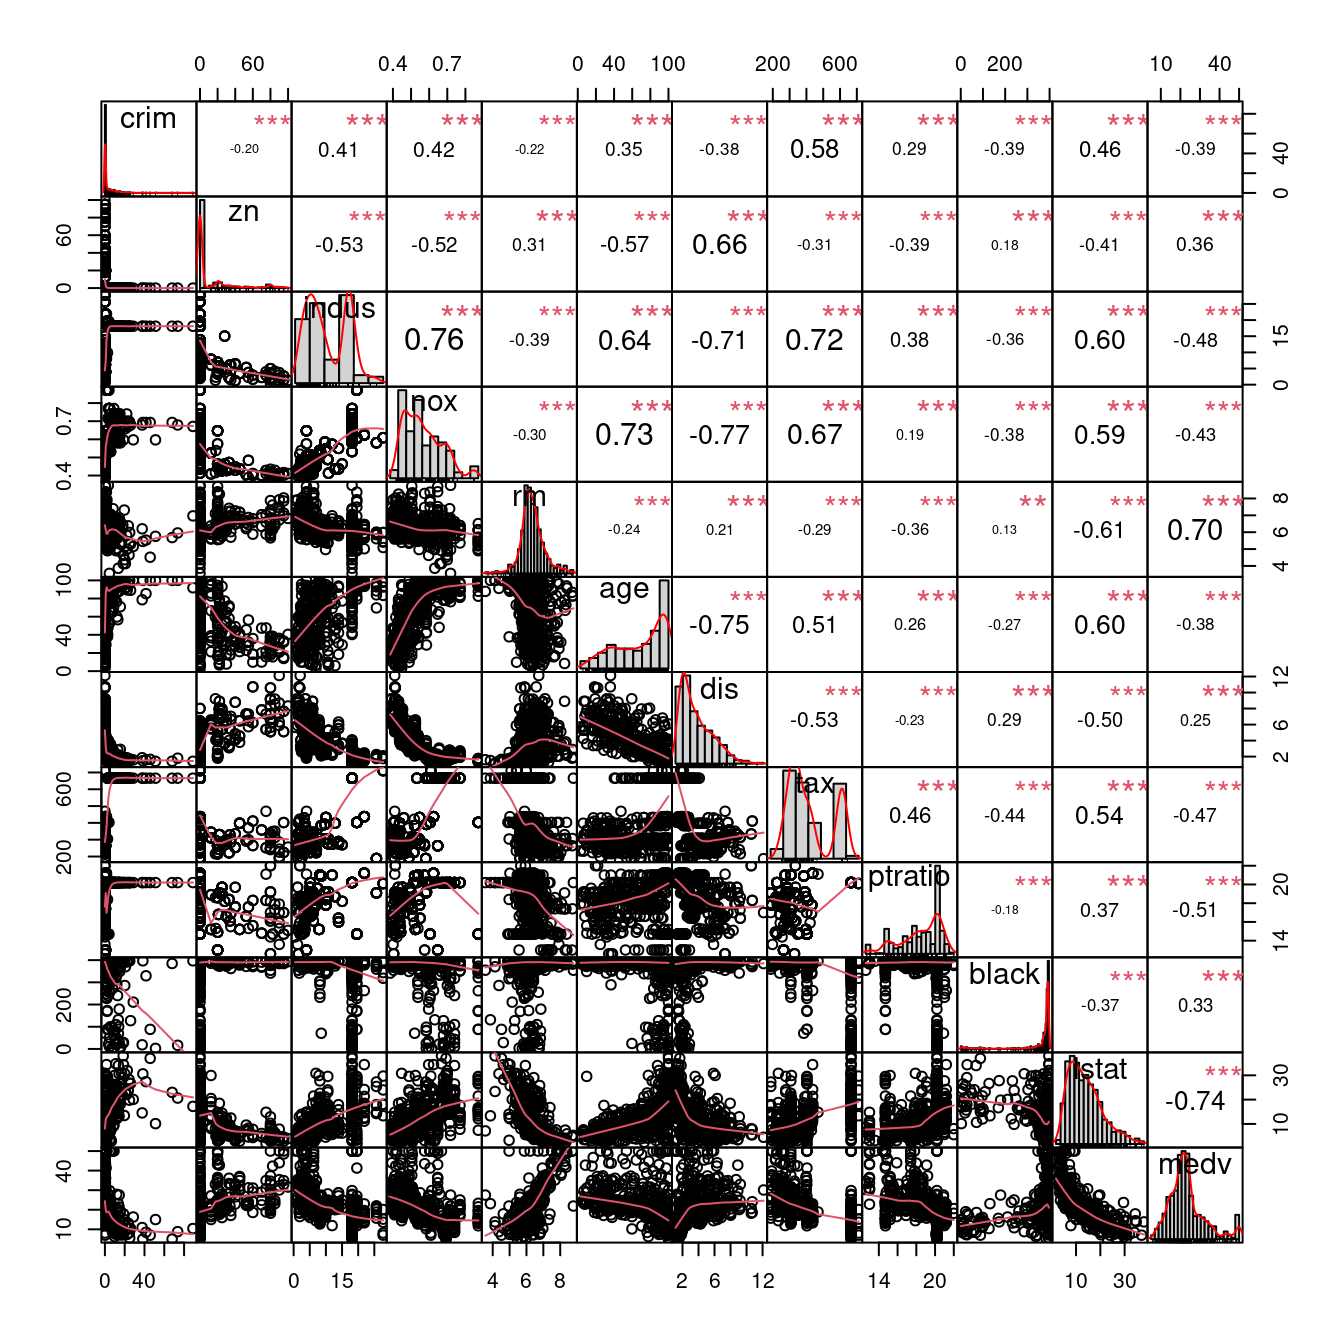
12.5.5 相關係數檢定
我們已經會算「一個兩兩連續型變數的相關係數」,也會算「全部連續型變數的相關係數矩陣」,算完之後,也會交給corrplot::corrplot跟PerformanceAnalytics::chart.Correlation取得相關係數矩陣的視覺化分析輔助圖。接下來,有人問了統計學家一個問題:
這一個相關係數真的不是
0嗎?
於是乎,統計學家再度出發,建議了一種「假設檢定」的手法,協助驗證「這一個相關係數真的不是0嗎?」。以下是R提供的使用手冊。
knitr::include_url("https://www.rdocumentation.org/packages/stats/versions/3.6.2/topics/cor.test")12.5.5.1 原始數據之相關係數檢定
我們已經看過,也知道怎麼透過R取得「兩兩連續型變數的相關係數」,或是「多個連續型變數的相關係數矩陣」,我們再一次回顧當時的作法、寫法:
as.data.frame.matrix(round(cor(boston[, CONvars]), 2))## crim zn indus nox rm age dis tax ptratio black lstat
## crim 1.00 -0.20 0.41 0.42 -0.22 0.35 -0.38 0.58 0.29 -0.39 0.46
## zn -0.20 1.00 -0.53 -0.52 0.31 -0.57 0.66 -0.31 -0.39 0.18 -0.41
## indus 0.41 -0.53 1.00 0.76 -0.39 0.64 -0.71 0.72 0.38 -0.36 0.60
## nox 0.42 -0.52 0.76 1.00 -0.30 0.73 -0.77 0.67 0.19 -0.38 0.59
## rm -0.22 0.31 -0.39 -0.30 1.00 -0.24 0.21 -0.29 -0.36 0.13 -0.61
## age 0.35 -0.57 0.64 0.73 -0.24 1.00 -0.75 0.51 0.26 -0.27 0.60
## dis -0.38 0.66 -0.71 -0.77 0.21 -0.75 1.00 -0.53 -0.23 0.29 -0.50
## tax 0.58 -0.31 0.72 0.67 -0.29 0.51 -0.53 1.00 0.46 -0.44 0.54
## ptratio 0.29 -0.39 0.38 0.19 -0.36 0.26 -0.23 0.46 1.00 -0.18 0.37
## black -0.39 0.18 -0.36 -0.38 0.13 -0.27 0.29 -0.44 -0.18 1.00 -0.37
## lstat 0.46 -0.41 0.60 0.59 -0.61 0.60 -0.50 0.54 0.37 -0.37 1.00
## medv -0.39 0.36 -0.48 -0.43 0.70 -0.38 0.25 -0.47 -0.51 0.33 -0.74
## medv
## crim -0.39
## zn 0.36
## indus -0.48
## nox -0.43
## rm 0.70
## age -0.38
## dis 0.25
## tax -0.47
## ptratio -0.51
## black 0.33
## lstat -0.74
## medv 1.0012.5.5.1.1 兩兩連續型變數的相關係數檢定
先看lstat跟medv的相關係數檢定。我們會看到一張統計報表。找到「p-value < 2.2e-16」,這意思是說,「檢定的p值很小」,所以我們有信心「拒絕相關係數是0的虛無假設」。作者小編在這裡測試一下,cor.test的「能耐」,讓它幫我們檢定「自己跟自己的相關係數1是否等於0?」
cor.test(boston[, "lstat"], boston[, "medv"])##
## Pearson's product-moment correlation
##
## data: boston[, "lstat"] and boston[, "medv"]
## t = -24.528, df = 504, p-value < 0.00000000000000022
## alternative hypothesis: true correlation is not equal to 0
## 95 percent confidence interval:
## -0.7749982 -0.6951959
## sample estimates:
## cor
## -0.7376627cor.test(boston[, "medv"], boston[, "medv"])##
## Pearson's product-moment correlation
##
## data: boston[, "medv"] and boston[, "medv"]
## t = Inf, df = 504, p-value < 0.00000000000000022
## alternative hypothesis: true correlation is not equal to 0
## 95 percent confidence interval:
## 1 1
## sample estimates:
## cor
## 1實驗結果告訴我們,「房價中位數自身的相關係數1等於0的檢定p值很小」,p-value < 2.2e-16,所以我們有信心認為「房價中位數自身的相關係數等於1」。
12.5.5.1.2 許多組兩兩連續型變數的相關係數檢定
接下來,我們要面對「11」個相關係數檢定,所以會有剛剛那種報表「11」張,也就是說我們需要「一支程式」整理這「11」張報表。以下這一段程式碼,是作者小編無意間發現一件事後寫出來的,因為意外發現了「相關係數檢定報表」背後的「資料結構」,也就是說,發現了「檢定的相關資料是怎麼擺的?」
- 無意間的發現。當面對「一變多」的時候,作者小編習慣用「迴圈」重複「一組同樣的動作」,不是用「
for」就是用「apply」家族。就像下面這一段,只是用「1:11」而不是用「1」。作者小編編寫這一段的時候,突然發現R的輸出跟前述的「檢定報表」完全不同。說實在的,如果沒有這個發現,各位只會在這裡看到「11」張跟上述報表一樣的報表,只有一個字「慘」!作者小編因為這個發現,燃起「一絲脫離這個『慘』字的希望」!請讀者諸君一定要欣賞這一段的「發展」!
x <- sapply(1, function(w){
  cor.test(boston[, "lstat"], boston[, "medv"])
})
x # 好像是一個「矩陣」?
## [,1]
## statistic -24.5279
## parameter 504
## p.value 0.0000000000000000000000000000000000000000000000000000000000000000000000000000000000000005081103
## estimate -0.7376627
## null.value 0
## alternative "two.sided"
## method "Pearson's product-moment correlation"
## data.name "boston[, "lstat"] and boston[, "medv"]"
## conf.int numeric,2- 深入檢查。曾經有一位同校的長官問過作者小編一個問題,這位長官問說:「你怎麼知道某一個R物件到底是什麼,R程式碼不像『Fortran』、『C』、『C++』、『JAVA』、『Python』,並沒有『宣告』的區段,不是嗎?」作者小編不假思索地回長官說,「檢查就知道了!」
class(x) # 檢查外觀。## [1] "matrix" "array"mode(x) # 檢查內在。## [1] "list"typeof(x) # 檢查內在。## [1] "list"dim(x) # 矩陣的維度,多少乘以多少?## [1] 9 1dimnames(x) # 矩陣的列名稱跟行名稱。## [[1]]
## [1] "statistic" "parameter" "p.value" "estimate" "null.value"
## [6] "alternative" "method" "data.name" "conf.int"
##
## [[2]]
## NULLattributes(x) # 檢查「屬性」可以取得上述兩項資訊。## $dim
## [1] 9 1
##
## $dimnames
## $dimnames[[1]]
## [1] "statistic" "parameter" "p.value" "estimate" "null.value"
## [6] "alternative" "method" "data.name" "conf.int"
##
## $dimnames[[2]]
## NULLsapply(x, class) # 檢查內容物。## [1] "numeric" "integer" "numeric" "numeric" "numeric" "character"
## [7] "character" "character" "numeric"### 因為「x的最後一列」出現作者小編第一次看到的「樣子」,「Numeric,2」。
sapply(x, is.vector) ## [1] TRUE TRUE TRUE TRUE TRUE TRUE TRUE TRUE FALSE# 是不是向量?請注意最後一列那個「怪怪的東西、物件」不是向量。
# 另外「矩陣(matrix)由向量(vector)構成」,這是「線性代數基本原則」,但是...
sapply(x, is.list) # 所以,作者小編進一步檢查是不是「譜(list)」?## [1] FALSE FALSE FALSE FALSE FALSE FALSE FALSE FALSE FALSE### 因為統計學的「信賴區間」必須有三項資訊:下界、上界跟顯著水準。
### 於是乎,作者小編決定抓幾個「x矩陣的內容物」來瞧瞧!
x["statistic",1] # [1,1]。似乎有三層的名字!## $statistic
##        t
## -24.5279x["conf.int",1] # [9,1]。兩個數字加一個「attr(,"conf.level")」。似乎有兩層的名字!## $conf.int
## [1] -0.7749982 -0.6951959
## attr(,"conf.level")
## [1] 0.95class(x["statistic",1]) # 為了釐清「怪怪的物件」,再一次檢查「class」。## [1] "list"class(x["conf.int",1]) # 竟然是「譜(list)」!!!## [1] "list"### 到這裡,作者小編就知道怎麼「抓」了!
x["statistic",1]$statistic["t"] # 根據猜測寫三層!## t
## -24.5279x["conf.int",1]$conf.int[1] # 根據猜測寫兩層加「前一」!## [1] -0.7749982x["conf.int",1]$conf.int[2] # 根據猜測寫兩層加「後二」!## [1] -0.6951959attr(x["conf.int",1]$conf.int, which = "conf.level") # 抓信賴區間的顯著水準!## [1] 0.95- 既然會抓了,接下來,作者小編開始「創作」自己的報表。根據在前述「相關係數圖」的經驗,也堅持作者小編的「連戲學習法」,我們先依據「相關係數的數值大小」「重排那11個連續型變數的名字」。
CONvars # 先檢視那些名字。## [1] "crim" "zn" "indus" "nox" "rm" "age" "dis"
## [8] "tax" "ptratio" "black" "lstat" "medv"corr <- round(cor(boston[, CONvars]), 2) # 取得相關係數矩陣。
CONvars <- CONvars[order(abs(corr[12,]))] # 排序。
CONvars # 呼叫出來再檢視一次。## [1] "dis" "black" "zn" "age" "crim" "nox" "tax"
## [8] "indus" "ptratio" "rm" "lstat" "medv"bostonCORtest <- data.frame(statistic = numeric(0),
p.value = numeric(0),
estimate = numeric(0),
L.conf.int = numeric(0),
R.conf.int = numeric(0),
level = numeric(0),
testing = character(0),
stringsAsFactors = FALSE) # 準備空表。
for (i in 1:11) {
x <- sapply(i, function(w){
cor.test(boston[, CONvars[w]], boston[, "medv"])
}) # 迴圈「for」內的迴圈「sapply」。
### 抓各種統計量,並且四捨五入到三位小數。
statistic <- round(x["statistic",1]$statistic["t"],3)
p.value <- round(x["p.value",1]$p.value,3)
estimate <- round(x["estimate",1]$estimate,3)
L.conf.int <- round(x["conf.int",1]$conf.int,3)[1]
R.conf.int <- round(x["conf.int",1]$conf.int,3)[2]
level <- attr(x["conf.int",1]$conf.int, which = "conf.level")
### 判斷是否拒絕虛無假設 = 相關係數等於0。
testing <- ifelse(p.value < 1 - level, "Reject", "Not Reject")
### 裝起來這一次檢定的表。
bostonCORtest0 <- data.frame(statistic = statistic,
p.value = p.value,
estimate = estimate,
L.conf.int = L.conf.int,
R.conf.int = R.conf.int,
level = level,
testing = testing,
stringsAsFactors = FALSE)
rownames(bostonCORtest0) <- CONvars[i] # 給名字。
bostonCORtest <- rbind(bostonCORtest, bostonCORtest0) # 疊起來。
}
bostonCORtest # 呼叫檢查結果。## statistic p.value estimate L.conf.int R.conf.int level testing
## dis 5.795 0 0.250 0.166 0.330 0.95 Reject
## black 7.941 0 0.333 0.254 0.409 0.95 Reject
## zn 8.675 0 0.360 0.282 0.434 0.95 Reject
## age -9.137 0 -0.377 -0.449 -0.300 0.95 Reject
## crim -9.460 0 -0.388 -0.460 -0.312 0.95 Reject
## nox -10.611 0 -0.427 -0.496 -0.353 0.95 Reject
## tax -11.906 0 -0.469 -0.534 -0.398 0.95 Reject
## indus -12.408 0 -0.484 -0.548 -0.414 0.95 Reject
## ptratio -13.233 0 -0.508 -0.570 -0.440 0.95 Reject
## rm 21.722 0 0.695 0.647 0.738 0.95 Reject
## lstat -24.528 0 -0.738 -0.775 -0.695 0.95 Reject- (插曲)作者小編一開始發現「
x」之後,以為只要把「1」改成「1:11」,加上把「cor.test」的輸出給「x」,然後按照「步驟二」的抓取動作就能輕鬆造表,但卻一直「鬼打牆」,還花了一個早上四處搜尋幫手跟實驗,雖然最後成功造出美美的表,但是「無法連戲」,「無法用步驟二的抓法抓資訊」!!!作者小編再一次回頭檢視程式碼,才驚覺步驟二的「x」是「sapply」的輸出,並不是「cor.test」的輸出,這才完成「步驟三」的程式碼,並且得到美美的自創表(data.frame)。因為作者小編認為早上的冤枉路,有著不錯的幫手,特別另闢「插曲」,為各位示範一下這幾個有用的套件(package)跟函式(function)。
x <- cor(boston[, c("rm", "lstat", "medv")]) # 取得波士頓數據集的部分相關係數矩陣。
x
## rm lstat medv
## rm 1.0000000 -0.6138083 0.6953599
## lstat -0.6138083 1.0000000 -0.7376627
## medv 0.6953599 -0.7376627 1.0000000round(x, 2) # 四捨五入到兩位小數。## rm lstat medv
## rm 1.00 -0.61 0.70
## lstat -0.61 1.00 -0.74
## medv 0.70 -0.74 1.00x <- formatC(x, digits = 2, width = 5, format = "f")
# 把相關係數用「五個符號,含兩位小數」的文字表示之。
x## rm lstat medv
## rm " 1.00" "-0.61" " 0.70"
## lstat "-0.61" " 1.00" "-0.74"
## medv " 0.70" "-0.74" " 1.00"x[lower.tri(x, diag = FALSE)] <- " " # 換成空白文字讓資訊減半!注意,空白絕不會是數字!
x## rm lstat medv
## rm " 1.00" "-0.61" " 0.70"
## lstat " " " 1.00" "-0.74"
## medv " " " " " 1.00"require(gt)
x <- as.data.frame.matrix(x) # 把矩陣變成表。請注意印出來時小數點沒對齊。
x## rm lstat medv
## rm 1.00 -0.61 0.70
## lstat 1.00 -0.74
## medv 1.00x <- gt(x) # 變出「gt」物件。請注意印出來時小數點沒對齊。
x| rm | lstat | medv |
|---|---|---|
| 1.00 | -0.61 | 0.70 |
| 1.00 | -0.74 | |
| 1.00 |
cols_align(x, align = "right", columns = TRUE) # 右邊靠齊。| rm | lstat | medv |
|---|---|---|
| 1.00 | -0.61 | 0.70 |
| 1.00 | -0.74 | |
| 1.00 |
12.5.5.2 常態轉換數據之相關係數檢定
相關係數檢定的檢定統計量,被R冠上「t」這個名字,根據統計學的習慣,
一定要檢定統計量的抽樣分配服從「t分配」,統計量的名字才會冠上「
t」。
作者小編查了一下Wikipedia,找到
knitr::include_url("https://zh.wikipedia.org/wiki/斯皮爾曼等級相關係數")…
找到了「t」:
\[t = r \times \sqrt{\frac{n - 2}{1 - r^2}}\]
作者小編在這一小節,想要測試「兩兩連續型變數」與「兩兩連續型常態變數」的「可能的差異」,同時介紹一個在「2020-06-08」出版的套件bestNormalize,一個可以讓我們把「非常態分配變數的數據」轉換為「接近常態分配變數的數據」。請讀者諸君繼續看下去,…
- 載入套件
bestNormalize。
require(bestNormalize)- 從波士頓數據集取出兩個欄位,
medv跟lstat。
medv <- boston[, "medv"]
lstat <- boston[, "lstat"]- 檢查
medv跟lstat是不是常態變數?
par(mfrow = c(1,2))
qqnorm(medv)
qqline(medv, col = 2)
qqnorm(lstat)
qqline(lstat, col = 2)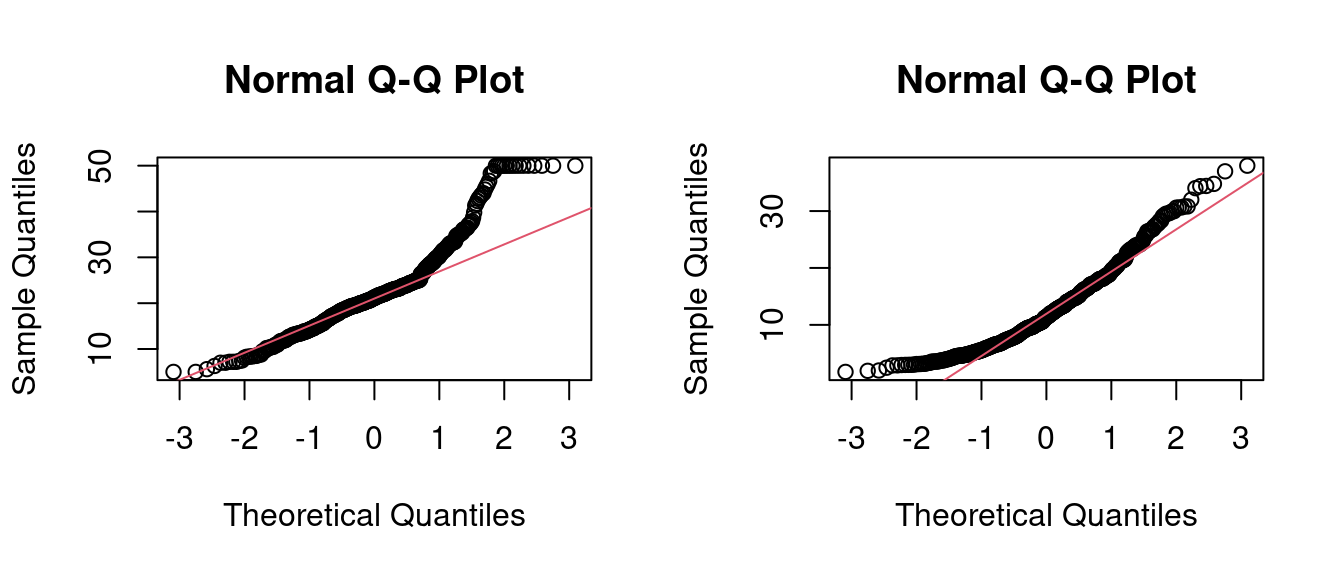
- 常態變數變換。
medv2 <- bestNormalize(medv)
lstat2 <- bestNormalize(lstat)- 檢查常態變數變換後
medv跟lstat是不是比較接近常態變數?
par(mfrow = c(1,2))
qqnorm(medv2[["x.t"]])
qqline(medv2[["x.t"]], col = 2)
qqnorm(lstat2[["x.t"]])
qqline(lstat2[["x.t"]], col = 2)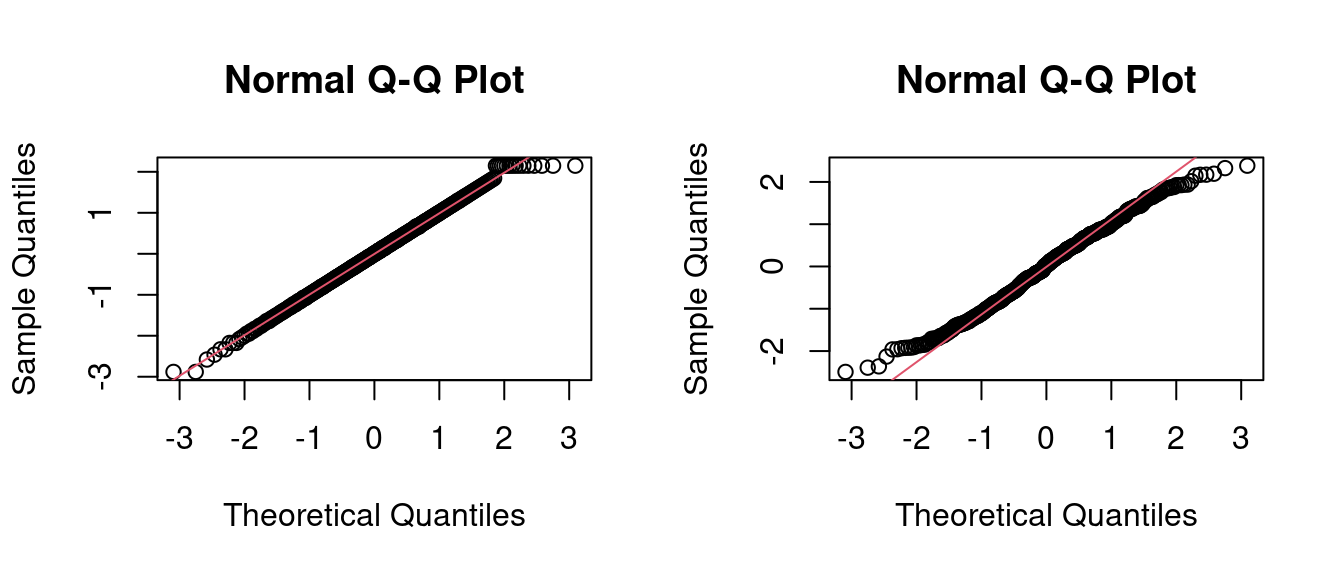
- 計算四組相關係數。竟然變大了!
cor(lstat, medv)## [1] -0.7376627cor(lstat, medv2[["x.t"]])## [1] -0.81234cor(lstat2[["x.t"]], medv)## [1] -0.803444cor(lstat2[["x.t"]], medv2[["x.t"]])## [1] -0.843996412.10 補充資料
為了讓讀者諸君先初步認識什麼是「相關係數(Pearson correlation coefficient)」,作者小編先請Wikipedia幫忙:
knitr::include_url("https://en.wikipedia.org/wiki/Pearson_correlation_coefficient")…
knitr::include_graphics("www/800px-Correlation_coefficient.png")## Error in knitr::include_graphics("www/800px-Correlation_coefficient.png"): Cannot find the file(s): "www/800px-Correlation_coefficient.png"…
