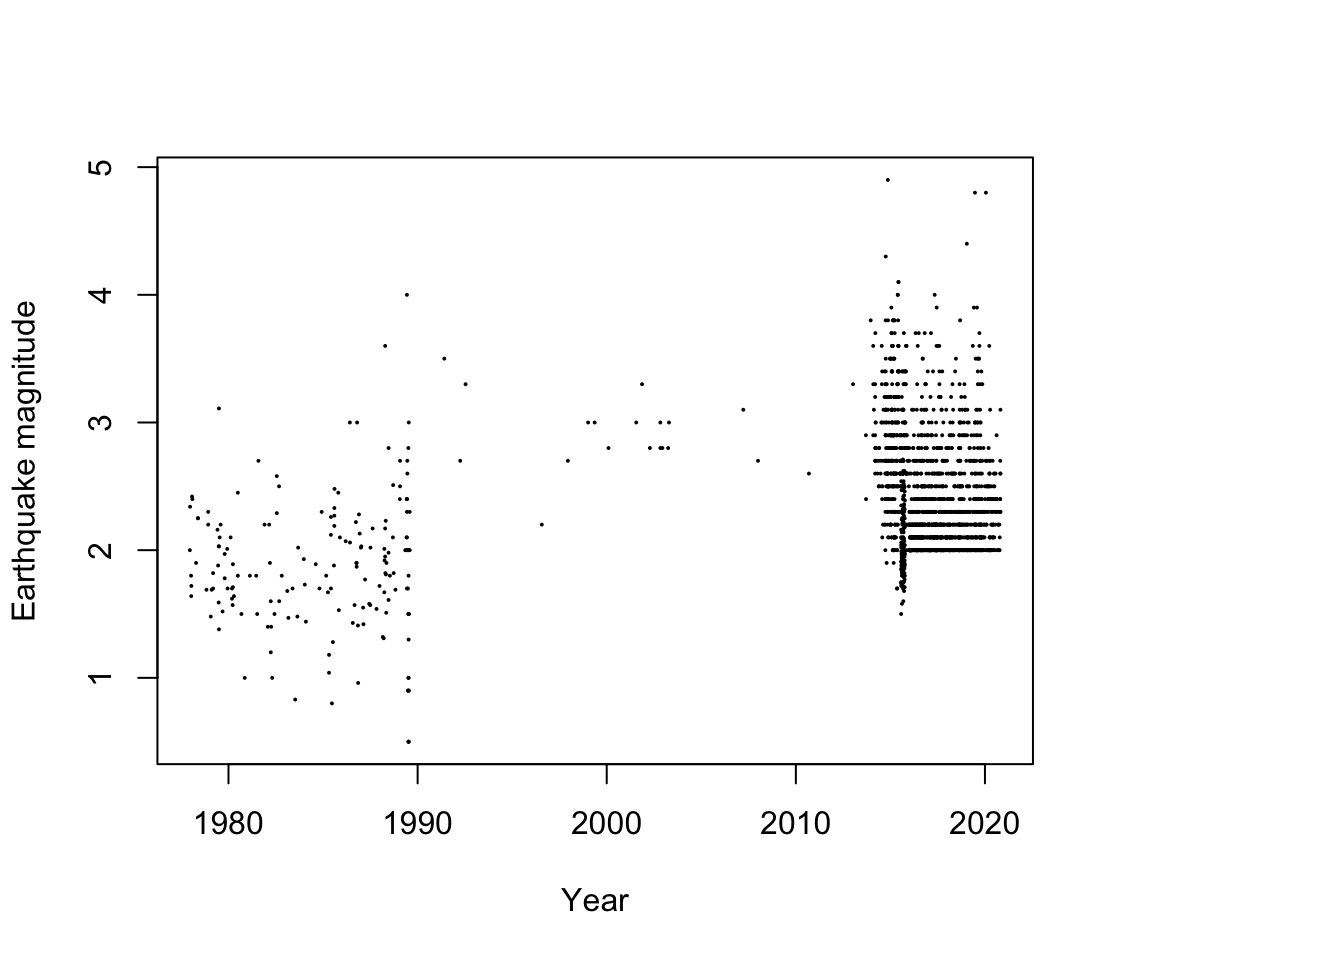
Earthquake data from Kansas
library(lubridate)
library(maps)
library(maptools)
library(raster)
library(animation)
library(gifski)


# Get map of Kansas
map.kansas <- map("state", "kansas", fill = TRUE, plot = FALSE)
crs <- CRS("+proj=longlat +datum=WGS84 +no_defs +ellps=WGS84 +towgs84=0,0,0")
sf.kansas <- map2SpatialPolygons(map.kansas, IDs = map.kansas$names, proj4string = crs)

# Load earthquake data
url <- "https://www.dropbox.com/s/9qzxe2xbxvoiipb/ks_earthquake_data.csv?dl=1"
df.eq <- read.csv(url)
df.eq$Date.time <- ymd_hms(df.eq$Date.time)
pts.eq <- SpatialPointsDataFrame(coords = df.eq[, c(3, 2)], data = df.eq[, c(1,
    4)], proj4string = crs)

# Plot spatial map earthquake data
par(mar = c(5.1, 4.1, 4.1, 8.1), xpd = TRUE)
plot(sf.kansas, main = "")
points(pts.eq, col = rgb(0.4, 0.8, 0.5, 0.3), pch = 21, cex = pts.eq$Magnitude/3)
legend("right", inset = c(-0.25, 0), legend = c(1, 2, 3, 4, 5), bty = "n", text.col = "black",
    pch = 21, cex = 1.3, pt.cex = c(1, 2, 3, 4, 5)/3, col = rgb(0.4, 0.8, 0.5,
        0.6))


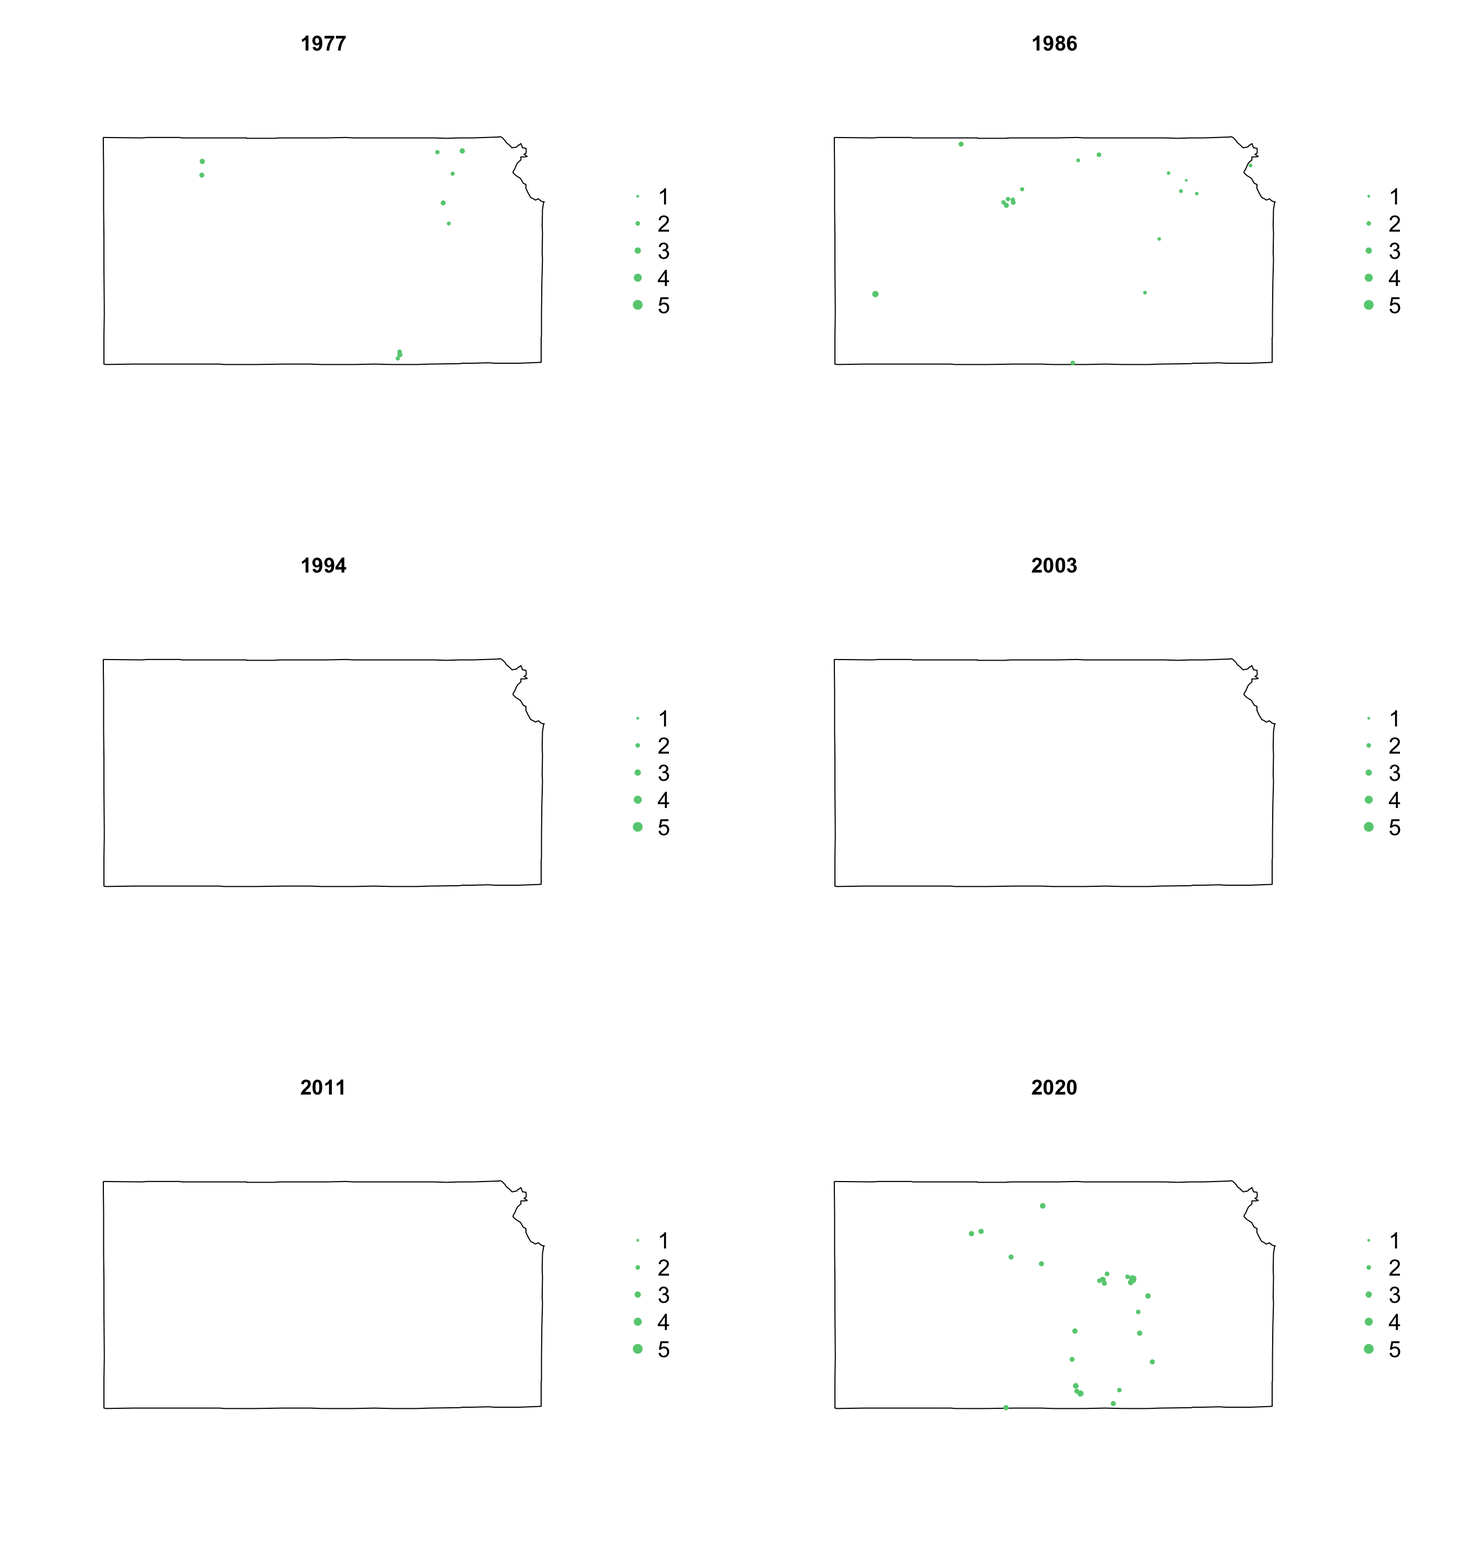
- Animation of Kansas Earthquake data
# Make animation of earthquake data
date <- seq(as.Date("1977-1-1"), as.Date("2020-10-31"), by = "year")
t <- round(time_length(interval(min(date), pts.eq$Date.time), "year"))

for (i in 1:length(date)) {
    par(mar = c(5.1, 4.1, 4.1, 8.1), xpd = TRUE)
    plot(sf.kansas, main = year(date[i]))
    legend("right", inset = c(-0.25, 0), legend = c(1, 2, 3, 4, 5), bty = "n",
        text.col = "black", pch = 20, cex = 1.3, pt.cex = c(1, 2, 3, 4, 5)/3,
        col = rgb(0.4, 0.8, 0.5, 1))
    if (length(which(t == i)) > 0) {
        points(pts.eq[which(t == i), ], col = rgb(0.4, 0.8, 0.5, 1), pch = 20,
            cex = pts.eq[which(t == i), ]$Magnitude/3)
    }
}


