27 Assignment 1
The goal of this assignment is to show you three tools that can help you make reproducible documents that contain text, figures, and computer code. We will be using R, RStudio, and R Markdown throughout the course. You will be using these three programs to make assignments (and other documents) that involve reporting the results obtained from R reproducible. In the most basic sense, this is equivalent to “showing your work” as you would for assignments with analytical components.
If you have experience using software other than R, RStudio, and R Markdown to make similar documents, then I am open to you using those instead. If you choose to use software other than R, RStudio, and R Markdown I may be unable to help you with any challenges you encounter.
Install R and RStudio on your computer. If you wish to produce PDF files then you will also need MiKTeX (for Windows) or MacTeX (for OS X) on a computer. See the resources page on the course website for links to download the software.
In RStudio, create a new R Markdown file. Change the default output format to PDF.
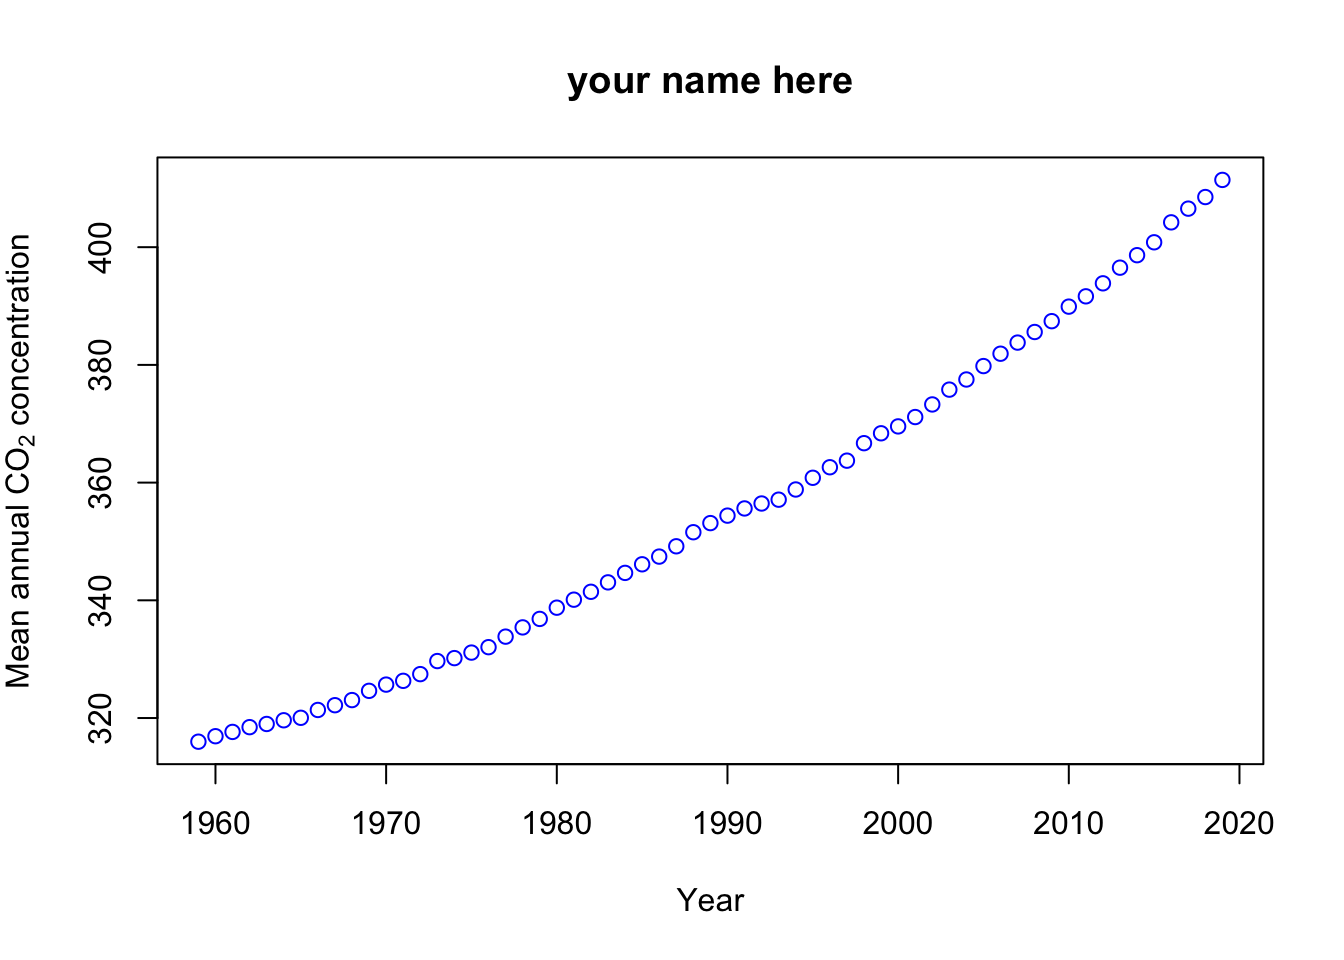
Within the new R markdown file, delete the existing code and text (be carful to retain the top four lines which R markdown requires). Using the code below, download the annual \(\text{CO}_{2}\) concentrations from Mt. Loa. With the code provided, plot the data.
url <- "ftp://aftp.cmdl.noaa.gov/products/trends/co2/co2_annmean_mlo.txt"
df <- read.table(url,header=FALSE)
colnames(df) <- c("year","meanCO2","unc")

plot(x = df$year, y = df$meanCO2, xlab = "Year", ylab = expression("Mean annual "*CO[2]*" concentration"),  main="your name here",col="blue")
- Change the plot title from “your name here” to your actual name. Change the color of the points from blue to a color of your choice. Compile the PDF or HTML and save the file as Yourlastname_Assignment1 (e.g., Hefley_Assignment1). Upload this file to Canvas before 5 pm on Friday 8/21/20.