Chapter 2 The search for causality
Data Analytics can be separated into three parts:
- Descriptive
- Predictive
- Prescriptive
 Most people are attracted to the complexity of Machine Learning models. These models are prediction machines. But they have one fatal flaw. They cannot tell you causality.
Causal inference is a necessary component to make prescriptive recommendations.
This class will highlight causal inference models during the first half of the class.
The second half of the class will be dedicated to data problems.
2.1 Correlation versus Causation
“Correlation doesn’t imply causation” is a line you hear repeated a lot in statistics. The reason it is repeated often is that we keep making the same mistake.

Take a look at all of these headlines.
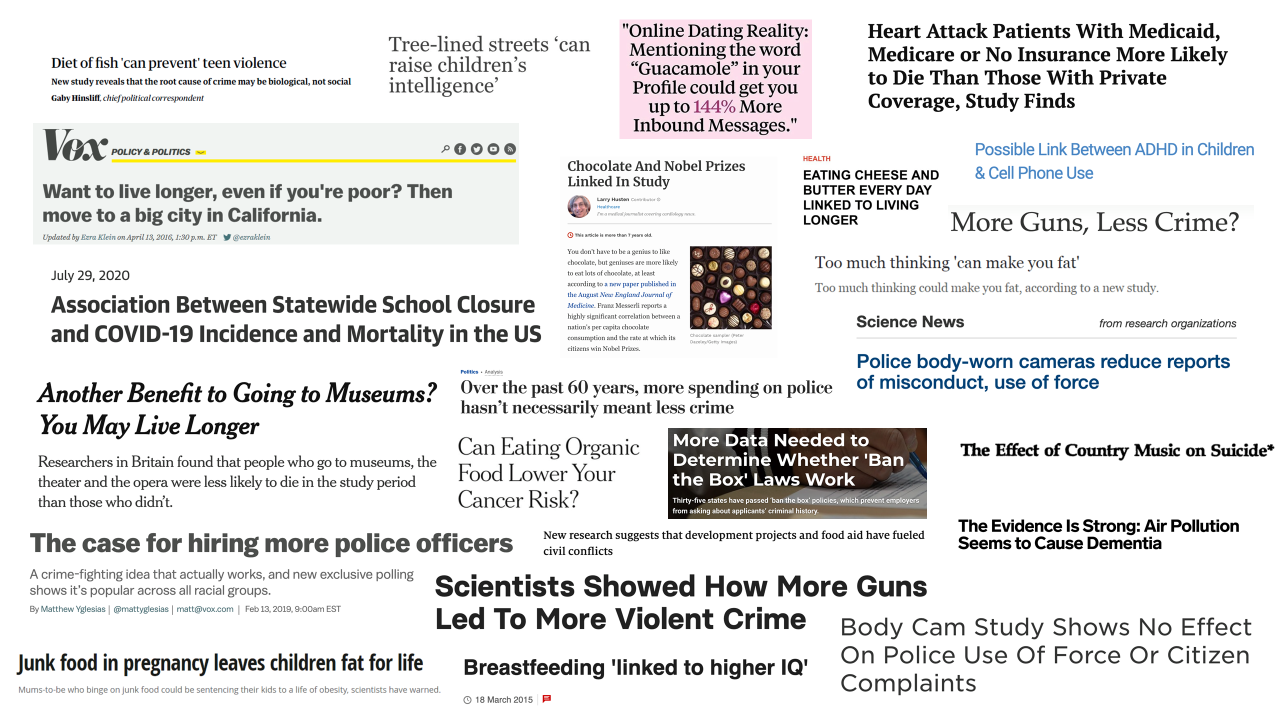 A lot of the above topics suffer from poor design or missing an important confounder (i.e. omitted variable bias).
- Some get the direction of causation incorrect.
- Some fail to have a good control group.
- Some suffer from sample selection bias.
The list goes on and on.
2.2 Example 1

Imagine we want to predict crime in a particular city. \[Crime=F(X)\] where X are different city characteristics (Police, income, unemployment, etc.)
Predictive Analytics finds the best way of using \(X\) to predict \(Crime\). This means that it will find the best functional form \(F()\) using the variables in \(X\) as an argument to predict \(Crime\). This is what machine learning is good at. It is totally agnostic about the causal direction.
Prescriptive Analytics is more interested in the effect of \(X\) on \(Y\). That is, we want to know if crime increases or decreases as a result of the city becoming wealthier.
These two phrases sound similar, but they are not.
For example, we know that police are correlated with crime. So why is it hard to know how the number of police affects crime?
- One of the reasons you hire more police is because the crime rate is high. More Crime ⇒ More Police
- The reason you hired these police is because you think more police will lead to less crime. More Police ⇒ Less Crime
- But if More Police implies Less Crime and Less Crime implies Less Police, then what is the overall effect and which way is the causality going?
- Econometrics/Causal Inference tries to sort this out. Statistics just cares about predicting the number of crimes (or crime rate).
2.3 Example 2: Suicide and Country Music

Stack and Gundlach (1992) studies the relationship between country music and suicide. \[𝑆𝑢𝑖𝑐𝑖𝑑𝑒_𝑖=𝛽_0+𝛽_1 𝐶𝑜𝑢𝑛𝑡𝑟𝑦𝑀𝑢𝑠𝑖c_𝑖+𝑒_𝑖\] Here \(Suicide\) is the suicide rate in a metropolitan area. \(CountryMusic\)is the number of minutes Country Music is played on the radio in the metropolitan area.
Results: The authors find that 51 percent of the variation in suicide among whites is explained by Country Music.

But is country music correlated with other things that are also correlated with suicides? That is does listening to country music make you suicidal or is it that people who listen to country music also more likely to drink, more likely to be depressed, and/or own a firearm?
We have to think about our models and our regression line. The computer does not know which way the causality goes. It simply provides a mathematical estimate of correlation.
2.4 Thought Experiment

Imagine an alien is looking down on earth and sees someone in a sailboat. The alien observes a person in the boat move the tiller around. The tiller is connected to the rudder, which channels how water moves underneath the boat. The tiller helps the person steer the boat.
The alien watches the boat and person for awhile. The person is moving the tiller back and forth. But not matter how much the person moves the tiller to the alien it appears that the boat goes in one direction the whole time. The tiller or rudder must be broken, right?
The alien sees no correlation between the movement of the tiller and the direction of the boat.
Have boat engineers been wrong all of these years?
The very opposite of what the alien believes is happening. These two actions are not independent, but instead extremely dependent! The experienced sail person knows how to move the tiller to keep the boat on a straight trajectory.
This thought experiment should teach you several things.
- The lack of correlation doesn’t necessarily imply no causation.
- A lot of our data is generated by strategic decisions not random events.
2.5 Topics to be covered
We will cover a large host of models to cover causal inferences and data issues.
Linear Regression
- Transformation of Variables
- Dummy Variables
- Fixed Effects
- Experiments
- Difference in Differences
- Instrumental Variables
- Regression Discontinuity
Discrete Choice Models
- Logit/Probit Models
- Linear Probability Model
- Multinomial Logit
- Conditional Logit
- Mixed Logit
- Ordered Logit
Advanced Items
- Demand Estimation
- Propensity Score Matching
- Count Models
- Truncated/Censored Regression
- Survival Analysis