Chapter 4 Mean, Median, and Mode
4.1 Mean
The mean (average) is the most widely used measure to describe a variable. \[\bar{x}=\frac{1}{n}\sum_{i=1}^{n}x_{i}\] Add up all of the values in your sample and divide by the number of observations. It’s easy calculate, tells us the central tendency of the data, but is sensitive to outliers.
For example, suppose you are a worker for the Bureau of Labor Statistics. You walk into a common bar and start asking people how much did they earn over the last year? You get five responses: \[ $30K, $40K, $50K, $60K, and $70K \]
It is easy to calculate that the average salary is 50,000 dollars. But then Bill Gates (founder of Microsoft) walks into the bar. He is estimated to earn about 5 billion dollars in a year. If we include Bill in our sample, the estimated mean falls to just under 833 million dollars. This one outlier caused a massive increase in the mean.
4.2 R code for the mean
For example, suppose you have the numbers 1, 1, 3, 5, and 100. The large outlier of x = 100 will pull the mean far away from the majority of the values.
## [1] 22## [1] 224.3 Median
The median tells us the value that is exactly in the middle. That is, 50 percent of the data are above it and 50 percent of the data are below it.
In our example, the median is 3, which seems much closer to most of the values than the mean. The advantage of median is that it is insensitive to the presence of outliers, but it doesn’t really tell us much more than where the center actually is.
## [1] 3This application of the median versus the mean is most easily seen when talking about income. Gross Domestic Product per capita (GDP per capita) is a measure of the mean income. GDP is the value of all production in the United States. If we divide this number by the total number of households, then we get the mean income per household. But if we compare that to the median household income, then we notice there is a substantial difference.

4.4 Mode
The mode is the number that appears the most often in your sample.
The word mode comes from the French phrase a la mode, which means what is in fashion or popular.
In our sample (1, 1, 3, 5, and 100) the number 1 appears the most so the mode would equal 1.
## [1] "numeric"The mode is a more useful term of central tendency when your data are not numbers, but categories. The mode would be the category that appears the most often.
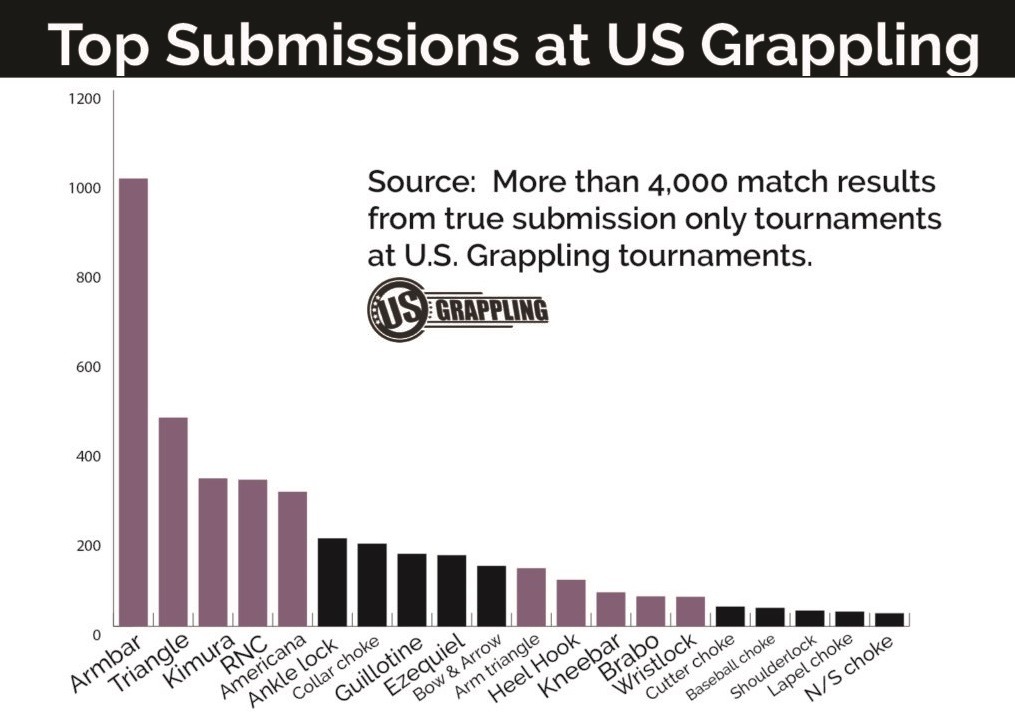
I am a practitioner of Brazilian Jiu Jitsu. This martial art specializes in limb extensions and chokes on the ground. It is a grappling martial art. I was curious about which submissions work at the highest level of competition. You can think of each submission as a category. Here are the results from 4000 submission only matches.
4.5 Skeweness
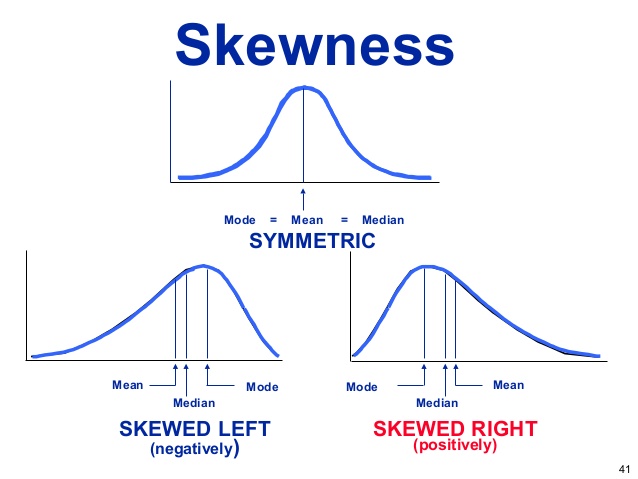
The mean, mode and median can be used to figure out if you have a positively or negatively skewed distribution.
- If the mean is greater than the mode, the distribution is positively skewed.
- If the mean is less than the mode, the distribution is negatively skewed.
- If the mean is greater than the median, the distribution is positively skewed.
- If the mean is less than the median, the distribution is negatively skewed.
4.6 Why Does Skeweness Matter?
People tend to treat the median and the mode interchangeably, but this is only true in a symmetric distribution (e.g. a normal distribution)
Let’s consider household income in the US again. There is a large difference between the median and the mode.
 ]
]
4.7 Pareto Distribution
The Pareto distribution, also known as the Pareto principle or the 80/20 rule, is a statistical concept that finds applications in various business scenarios. The distribution is characterized by a heavy-tailed or long-tailed shape, where a small number of high-frequency occurrences account for the majority of the overall impact. Here are some examples of the Pareto distribution in business:
Revenue from Customers: In many businesses, a significant portion of the revenue comes from a small fraction of their customers. The Pareto distribution is often observed when analyzing customer sales data, where a few high-value customers generate the majority of the company’s revenue. Identifying these high-value customers can help businesses focus their marketing efforts and customer service to maximize profitability.
Sales of Products: The Pareto principle can also be seen in product sales, where a few top-selling products contribute to a significant proportion of the total sales revenue. Businesses can use this information to concentrate on promoting and optimizing the sales of their most popular products to increase overall profitability.
Employee Performance: In certain organizations, the performance of a small group of employees can have a disproportionately large impact on the company’s success. These high-performing employees may be responsible for driving innovation, leading teams, or securing major deals, highlighting the Pareto distribution in workforce productivity.
Complaints and Service Issues: When analyzing customer complaints or service issues, businesses may find that a small number of recurring issues are responsible for the majority of complaints. By addressing these critical issues, companies can significantly improve customer satisfaction and loyalty.
Inventory Management: The Pareto principle is also relevant in inventory management, where a small subset of products typically accounts for the majority of sales or stock turnover. This understanding allows businesses to prioritize the management of high-demand items to ensure they are always adequately stocked.
Resource Allocation: In project management and resource allocation, the Pareto principle can be used to identify critical tasks or components that significantly impact the project’s success. Allocating resources and attention to these key areas can lead to more efficient project execution.
Marketing Channels: In digital marketing, the Pareto distribution can be observed in the effectiveness of various marketing channels. A few channels may drive the majority of website traffic or customer conversions, prompting businesses to invest more resources in those high-performing channels.
Real World Examples:
- In Denver 5% of vehicles produce 55% of the pollution.
- Audits of taxpayers in the top 0.1 percent of the income distribution returned more than $6 in revenue for every dollar spent in audit resources, much more than audits of lower-income taxpayers.
By recognizing and leveraging the Pareto distribution in various aspects of business, companies can make informed decisions, optimize resource allocation, and focus their efforts where they are likely to yield the most significant impact on overall performance and success.