Lab exercise 9
Please upload the knitted .pdf file on Moodle by 23:59.
Use the following data set TEST10 containing the item parameters of 10 items to answer the questions.
Test10 <- read.table("https://raw.githubusercontent.com/sunbeomk/PSYC490/main/Test10.txt")
head(Test10)
## a b c
## 1 0.62 -0.82 0.12
## 2 0.75 0.49 0.15
## 3 0.99 0.74 0.12
## 4 1.39 0.58 0.05
## 5 0.54 -0.31 0.21
## 6 1.38 1.51 0.17- Complete the code chunk below to write a function called
irt.simthat takes four vectors as inputs (theta_sim,a,b,c) and generates a random response data set from a 3PL IRT model.
irt_sim <- function(theta,a,b,c){ #ability and item parameters as vectors
  n_items <- length()

  n_subjects <- length()

  resp <- matrix(NA,nrow = n_subjects, ncol = n_items)
  for(i in 1:n_subjects){
    for(j in 1:n_items){

      pij <- irt_p( , , , )

      resp[i, j] <-
    }
  }

  resp
}
Randomly generate true abilities \(\theta\)s for 500 examinees from a standard normal distribution.
Using the
irt_simfunction, randomly generate a response data setrespfor the 500 examinees on the 10 items inTest10. The generated response data setrespshould be a \(500 \times 10\) matrix.Using the
mirtfunction from themirtpackage, estimate the item parameters from a 3PL model. Create 3 vectors,a_est, b_est, c_est, representing the \(a, b, c\) estimates for theTest10items.Estimate the ability \(\theta\)s for the 500 examinees. Print the ability estimates for the first five examinees.
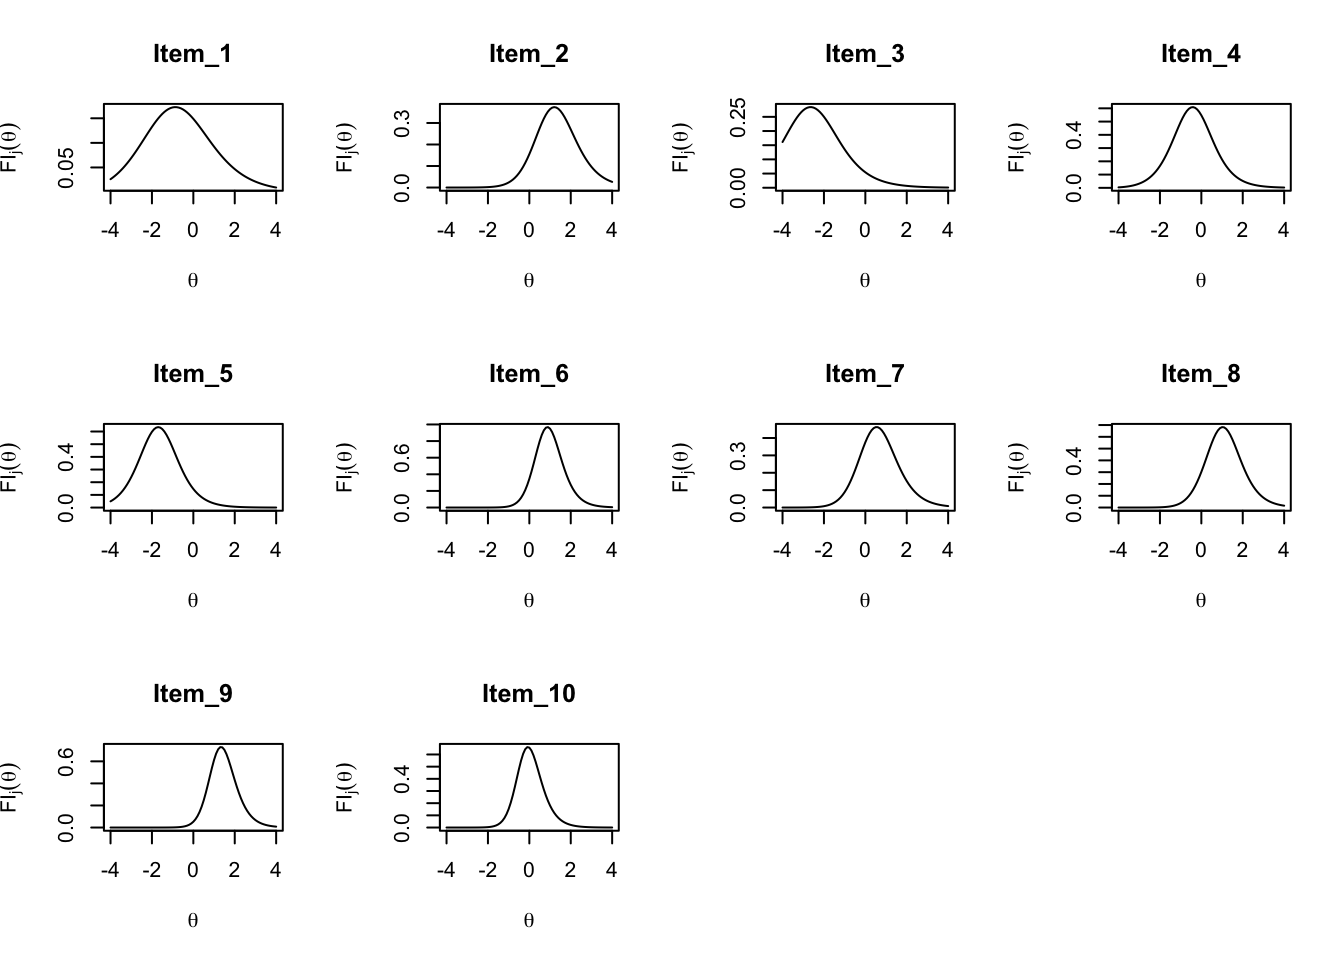
In a single window (3-by-4 array), draw item information curves of the 10 items. The result should look like the plot below.
- hints:
par(mfrow=c(3,4))