Lab exercise 5
Please upload the knitted .pdf file on Moodle by 23:59.
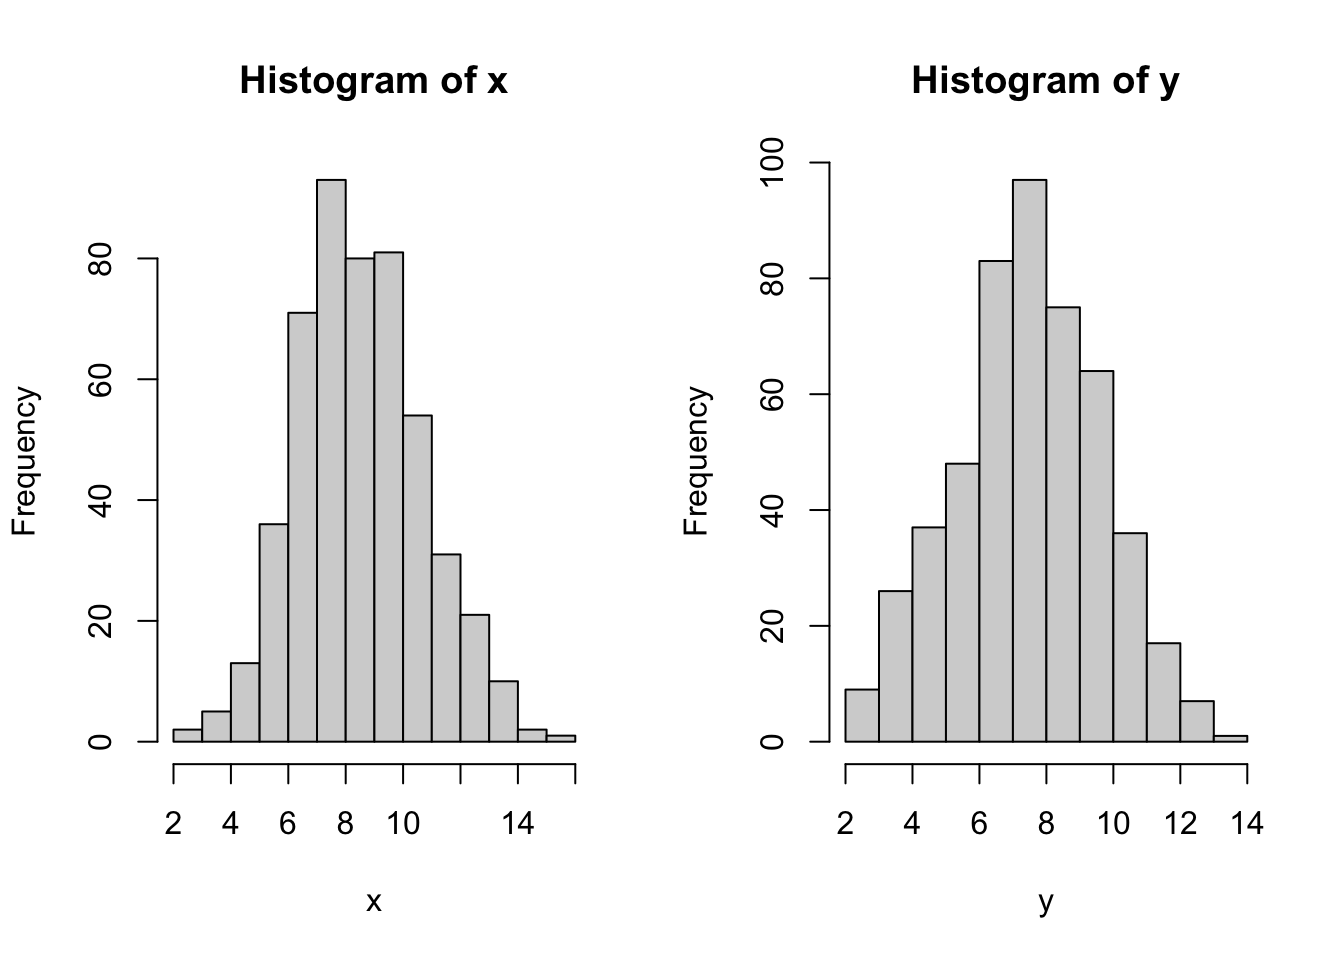
Suppose we used the job screening test score \(x\) to make decisions about hiring and to predict the job performance score \(y\). The below code chunk produces the two scores from 500 examinees. Use the test score variables \(x\) and \(y\) to solve the problems.
Suppose that the examinees with the test score \(x\) greater than or equal to 12 are hired. We can also categorize the examinees with the job performance score \(y\) greater than or equal to 12 as successful workers. Create a logical vector
predictedindicating whether each examinee is hired or not. Also, create a logical vectoractualindicating whether each examinee is successful or not.Create a \(2 \times 2\) decision table.
Obtain the hit rate, the sensitivity, the specificity, and the base rate.
Keep the cut score for outcome (job performance) fixed at 12. Calculate the proportion of hired individuals who will turn out successful when cut off score is 10.
hint:
The below code will return a logical vector indicating whether a hired individual is successful or not given a cut_score.
- Keep the cut score for outcome (job performance) fixed at 12. Change the cut score for the test score \(x\) from 1 to 20, and obtain the hit rate for each cut off score.
hint:
- Complete the below code chunk