Lab Exercise 7
Please upload the knitted .pdf file on Moodle by 23:59.
Suppose that the object x created below is the raw score on a test from 200 examinees.
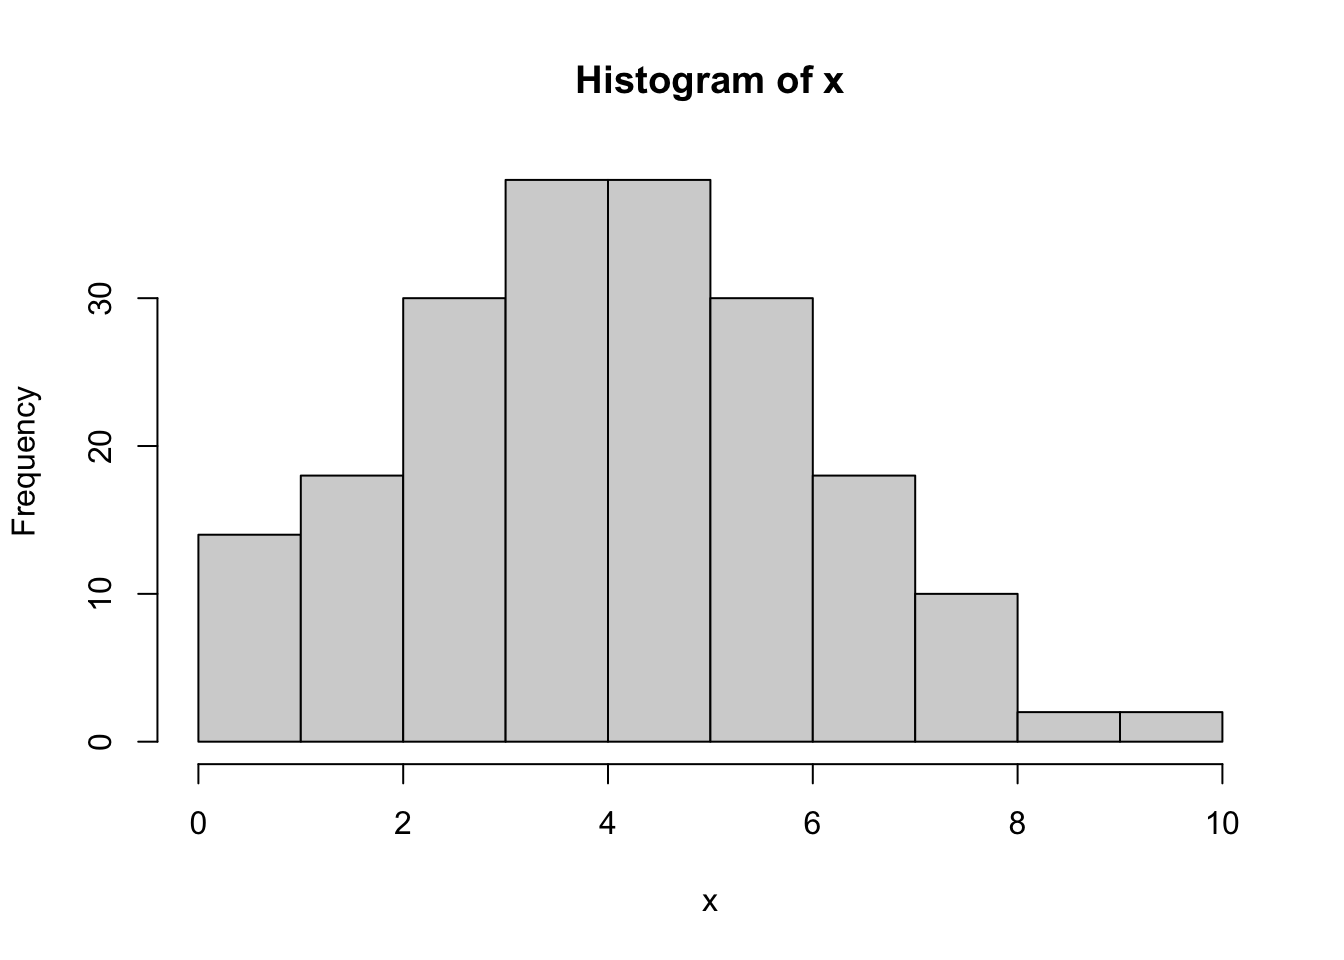
Construct a frequency table containing three columns: Scores, Frequency, and Cumulative frequency.
Calculate the percentiles corresponding to scores from 0 to 10. 0 and 10 are the minimum and the maximum values of the raw scores.
Obtain the T-scores of all 200 examinees and draw a histogram of the T-scores.
hint: First, we need to obtain the percentile scores for all examinees.
Obtain the stanines of all 200 examinees and check the freqeuncy of each stanine score.
Construct a
data.framethat contains 4 columns: raw scores, percentiles, T-scores, and stanines for the 200 examinees.