install.packages("pacman", repos = "http://cran.us.r-project.org")
library(pacman)
pacman::p_load(conflicted, tidyverse, foreign,
       knitr, printr,
       stargazer, plotly,
       scales, Matching,
       rgenoud, AER, lfe, plm,
       aod, randomizr, rdrobust, rddensity,
       reshape2, mnormt, rmarkdown,
       cobalt, haven, tidyselect,
       kableExtra, sandwich, lmtest, randomNames,
       DiagrammeR, textdata,
       RSelenium, wordcloud, printr, keras,
               googleCloudVisionR, ggridges,
       stm, stminsights,
       ggthemes, RSQLite,
       emo,
       update = FALSE) # Set TRUE to update all

# reticulate::install_miniconda()
# devtools::install_github("hadley/emo")
# Install Anaconda beforehand: https://www.anaconda.com/products/individual
# install.packages("tensorflow")
# install_tensorflow()
# use_condaenv("r-tensorflow")
# Sometime you have to run R in admin mode.


library(reticulate)
library(keras)
virtualenv_create("myenv")
use_virtualenv("myenv")
install_keras(method="virtualenv", envname="myenv")
use_virtualenv("myenv")

# Choose functions with the conflicted package
  conflict_prefer("mutate", "dplyr")
  conflict_prefer("group_by", "dplyr")
  conflict_prefer("ungroup", "dplyr")
  conflict_prefer("filter", "dplyr")
  conflict_prefer("pivot_wider", "tidyr")
  conflict_prefer("pivot_longer", "tidyr")
  conflict_prefer("arrange", "dplyr")
  conflict_prefer("layout", "plotly")
conflict_prefer("select", "dplyr")Introduction
0.1 Today’s content (and objectives)
- Introduction round
- Overview of course (content, requirement, material etc.)
- Research questions
- Stats on adoption of internet/social media
- Computational Social Science
- Stats on AI
- Example presentation
0.2 Who am I?
- Postdoctoral research fellow at the Mannheim Centre for European Social Research (Germany)
- Mannheim.. one of the few truly beautiful cities in Germany!
- Previously postdoctoral fellow at the European University Institute (Florence, Italy)
- PhD in Social Sciences at the University of Bern
- My research:
- Substantive: Political sociology (Trust, polarization, social media, fake news)
- Methods: Causal inference, experiments, text data, data visualization, machine learning (PCA, Topic models, RFs, BERT), big data (Google trends, Twitter)
- Contact:
- Email: mail@paulcbauer.de
- Website: www.paulcbauer.de
0.3 Who are you?
- Survey results!
- Name?
- Field of study?
- Interests?
- Country?
- Previous experience with R?
- Why are you interested in this course? (Are you?)
0.4 Script & material
- Website = slides + script
- Zoom in/out with
STRG + mousewheel - Fullscreen: F11
- Link: https://bookdown.org/paul/ai_ml_for_social_scientists/
- Navigate using menu/links
- Document was generated with quarto (please use that for your term paper!).
- Zoom in/out with
- Data and other files will be shared over the cloud.
- Literature
- See link in email (got it?).
- How to find literature to which you don’t have access to?
- You will find citations of Wikipedia/popular science books/newspaper articles in my material Domingos (2015)
- What speaks against Wikipedia/popular science as references in scientific work?
- Quality check.. author etc. (sometimes no other sources)
- What speaks against Wikipedia/popular science as references in scientific work?
0.5 Seminar content & objectives & readings
- Let’s check out the syllabus! (…got it via email?)
- Introductory course with focus on supervised machine learning (vs. unsupervised)
- Speed, computing power, applicability
- Introductory course with focus on supervised machine learning (vs. unsupervised)
0.6 Tools and software
0.6.1 R: Why use it?
- Free and open source (think of science in developing countries)
- Good online-documentation
- Lively community of users (forums etc.)
- Pioneering role
- Visualization capabilities
- Intuitiv
- Cooperates with other programs
- Used across wide variety of disciplines
- Object-oriented programming language
- Popularity (See popularity statistics on books, blogs, forums)
- RStudio as powerful integrated development environment (IDE) for R
- Evolves into a scientific work suite optimizing workflow (replication, reproducability etc.)
- Institutions/people (Gary King, Andrew Gelman etc.)
- Economic power (Revolution Analytics, Microsoft R Open)
- Python is only real competitor.. can be used from R (e.g. reticulate package!)1
0.6.2 R: Where/how to study?
If you haven’t used R sofar it’s necessary that you learn some basics in R. As a participant of the seminar you get 6 months access to all the courses on DataCamp. DataCamp has become the go-to site for self-studying various data science skills (mostly software).
- See this site for an overview of the R courses they offer. Basically, datacamp offers a track “Data Scientist with R”.
- While the introduction is free for everyone you also have access to all other courses for six months.
If you like you can also have a look at the other options below but I would recommend that you start with data camp.
- Try R: A short interactive intro to the language can be found here: http://tryr.codeschool.com/
- Swirl: Learn R interactively within R itself: http://swirlstats.com/
0.6.3 R: Installation and setup
Below some notes on the installation and setup of R and relevant packages on your own computer:
- Install Rtools for Windows machines from CRAN (https://cran.r-project.org/bin/windows/Rtools/). If you are using OS X, you will need to to install XCode, available for free from the App Store. This will install a compiler (if you don’t have a compiler installed) which will be needed when installing packages from GitHub that require compilation from C++ source code.
- Install the latest version of R from CRAN (https://cran.r-project.org/).
- Install the latest version of RStudio (https://www.rstudio.com/products/RStudio/). RStudio is the editor we’ll rely on, i.e. we’ll write code in RStudio which is subsequently sent to and run within R.
- Start RStudio and install & load the latest versions of various packages that we need.
- You may also read up on how to create and “knit” an RMarkdown files. Essentially, such files allow you to integrate the analyses you conduct with the text you write which is ideal for reproducability. Here is an intro to the concept and a simple example: http://rmarkdown.rstudio.com/lesson-1.html.
0.6.4 Datacamp
- Adress: https://www.datacamp.com/
- 6-month access to do all courses you like (Q: Did everyone get the invitation?)
- Provide various tracks
- Q: What is your experience with Datacamp? Do you like it?
- Q: What makes Datacamp as a platform so powerful? Will it replace humans? (Memory!)
0.7 Research questions
- What is the difference between normative (vs. empirical analytical), descriptive, causal and predictive research questions?
- Please discuss and find an example for each!
- Here: Focus on predictive research questions.
0.7.1 Types
- Normative vs. empirical analytical (positive)
- Should men and women be paid equally? Are men and women paid equally (and why?)?
- What? vs. Why? (Gerring 2012, 722-723)
- Describe aspect of the world vs. causal arguments that hold that one or more phenomena generate change in some outcome (imply a counterfactual)
- My personal preference: descriptive vs. causal questions
0.7.2 Descriptive questions (What?)
Measure:‘Would you say that most people can be trusted or that you can’t be too careful in dealing with people, if 0 means “Can’t be too careful” and 10 means “Most people can be trusted”?’
How are observations distributed across values of trust (Y)? (univariate)
| 0 | 1 | 2 | 3 | 4 | 5 | 6 | 7 | 8 | 9 | 10 |
|---|---|---|---|---|---|---|---|---|---|---|
| 303 | 42 | 172 | 270 | 369 | 1281 | 853 | 1344 | 1295 | 353 | 356 |
- We can add as many variables/dimensions as we like → multivariate (e.g. gender, time)
- Q: What would the table above look like when we add gender as a second dimension?
- Descriptive questions (multivariate)
- Do females have more trust than males?
- Did trust rise across time?
0.7.3 Causal questions (Why?)
| 0 | 1 | 2 | 3 | 4 | 5 | 6 | 7 | 8 | 9 | 10 | |
|---|---|---|---|---|---|---|---|---|---|---|---|
| no victim | 259 | 36 | 135 | 214 | 320 | 1142 | 782 | 1228 | 1193 | 326 | 331 |
| victim | 44 | 6 | 37 | 56 | 48 | 139 | 70 | 114 | 101 | 27 | 25 |
- Mean Non-victims: 6.2; Mean Victims: 5.48
- Descriptive questions: Do victims have a different/lower level of trust from/than non-victims?
- Why?-questions start with difference(s) and, then, seek to explain why those difference(s) occured
- Why does this group of people have a higher level of trust?
- Causal questions: Is there a causal effect of victimization on trust?
- Insights
- Data underlying descriptive & causal questions is the same
- Causal questions aways concern one (or more) explanatory causal factors
0.7.4 Predictive questions
- Examples
- Can we predict trust?
- Can we predict trust using victimization?
- How well can we predict trust? (accuracy)
- Quick summery…and more on that later!
1 Digital revolution, technology and platform adoption
- Q: Ever heard of the digitalization/digital revolution?
- = Third Industrial Revolution
- “shift from mechanical and analogue electronic technology to digital electronics […] from the late 1950s to the late 1970s with the adoption and proliferation of digital computers and digital record keeping” (Wikipedia)
- “Central to this revolution is the mass production and widespread use of digital logic circuits, and its derived technologies, including the computer, digital cellular phone, and the Internet” (Wikipedia)
- “The World’s Technological Capacity to Store, Communicate, and Compute Information” (Hilbert and López 2011)
- Most information is stored in digital form today (although I still have some paper folder at home!)
1.0.1 The Internet (+ access)
- “global system of interconnected computer networks that uses the Internet protocol suite (TCP/IP) to communicate between networks and devices. It is a network of networks that consists of private, public, academic, business, and government networks of local to global scope, linked by a broad array of electronic, wireless, and optical networking technologies. The Internet carries a vast range of information resources and services, such as the inter-linked hypertext documents and applications of the World Wide Web (WWW), electronic mail, telephony, and file sharing.” (Wikipedia)
- There is a physical structure behind it!
- Homework: Study/read through this infographic.
- We have come a long way: The Sound of dial-up Internet
Insights
- Strong inequality across countries/continents (2020)
- Don’t forget inequality within populations!
- Path-dependency: Certain countries may skip evolutionary steps
- Any research we do is within a historical context of technology adoption (e.g., dating apps)
- Findings may not generalize from one geographic context to another (different adoption rates)
1.0.2 Technology adoption and platform usage
1.0.2.1 Technology adoption: United States
- Q: When does this technology affect societies and when?
1.0.2.3 Platform usage (2): Social Media Adoption (Barchart)
- Q: Anything surprising for you in this graph?
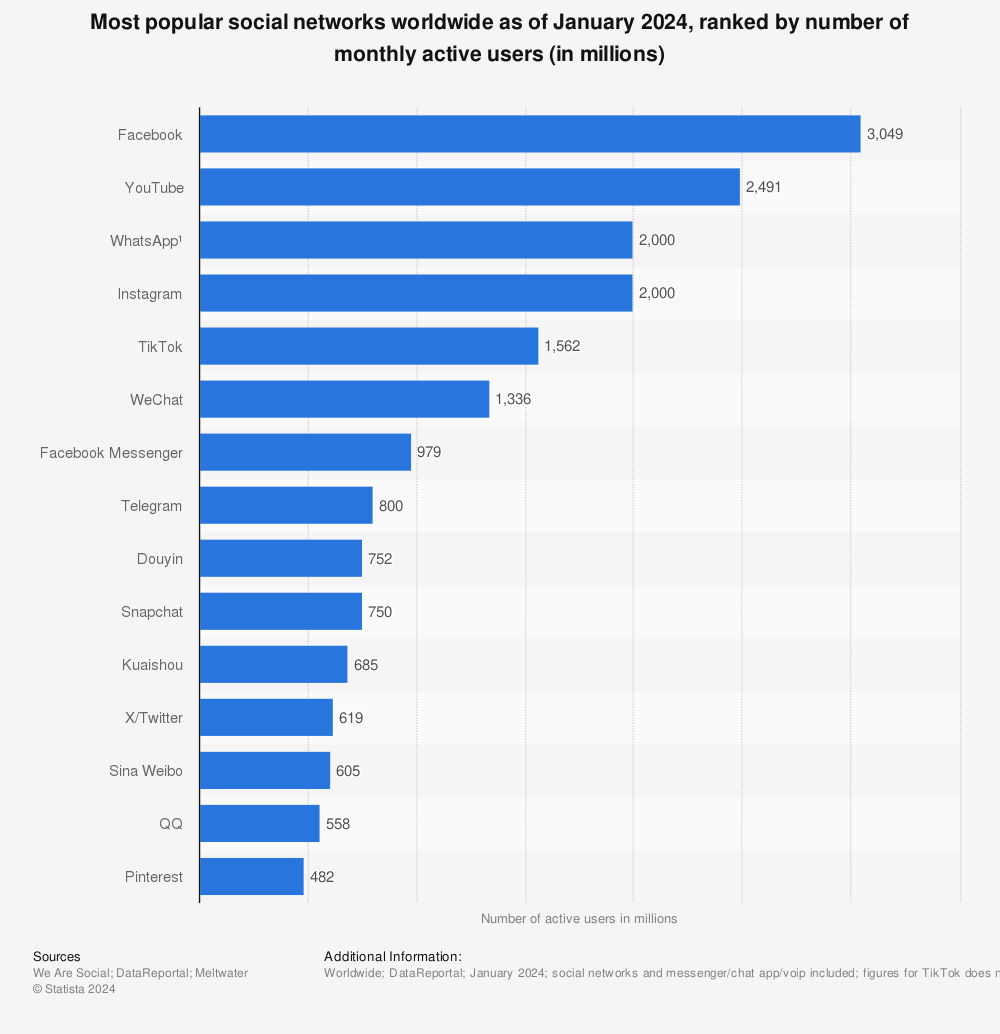
Insights
- Platforms may come and go… (Myspace)
- Companies behind those platforms are also those that invested most in AI (Google, Facebook, etc.)
- See, e.g., Our world in data, Statista for more statistics
2 Exercise: What data can reveal about you…
- Look at the picture below. What (variables) does it show? What can we learn?
- USE CURRENT DATA INSTEAD!
![]()
Insights
- Geo-locations + time stamps of individuals among most powerful data
- Data may have non-obvious use cases (Mayer-Schönberger and Cukier 2012, 82, 86) (e.g. traffic prediction)
- Inventors/data collectors themselves might not foresee the positive or negative potential of their data
- Visualization strongly affects what you see (with/without lines)
- Indirect data & identification
- Database better memory than myself!
4 Example-Presentation
- Example Barbera (2015)
- Your presentations
- Go through questions and provide answers
- Use paper’s visualizations if there are any nice ones
- The paper, Google scholar
- My (wrong) impressions back in 2013… [Think out of the box!]
- Background: What is the background of that study? Research area?
- Classic task of measuring politicians’ and voters’ policy positions
- Usually to position on a single latent dimension “ideology”
- Was mostly done for legislators (voting data) & individuals (survey data)
- Research question: What is the overall research question?
- Can we use Twitter to estimate the policy positions of citizens?
- Underlying: What is the ideology of individual i?
- Can we use Twitter to estimate the policy positions of citizens?
- Data: What kind of data is used?
- Twitter data (back then a new platform of political communication)
- Users (individual & politicians) embedded in a common social network
- Hypotheses/assumptions: Are there hypotheses, if yes which ones?
- Main assumption: Twitter users prefer following politicians that are close ideologically
- Hypothesis: We can reliably estimate voter’s ideology using their twitter network (who they follow)
- Analytical & empirical approach
- Estimate individuals’ ideology using Twitter
- Cross-validate Twitter estimates with external information to see whether method correctly classifies/scales Twitter users on the left or right side of the ideological dimension
- Legislators/parties: Compare twitter ideology to voting behavior in parliaments
- Mass ideology: Compare patterns between surveys and Twitter in terms of ideological patterns
- Individuals: Compare campaign spending to Twitter ideology
- Findings: What are the findings?
- Method seems to work
- Twitter conversation is dominated by those with strong ideology
- Innovation: What is so innovative (CSS!)? What struck you about this study? What did you find interesting?
- New form of data (Twitter)
- Classic question (identifying ideology) answered with new data
- Weaknesses/Problems: What are potential weaknesses of the study?
- Representativeness of Twitter users, assumptions, only applicable to users who follow at least one account etc.
- Other thoughts: Any additional thoughts on the study?
References
Alvarez, Michael R. 2016. Computational Social Science. Cambridge University Press.
Cioffi-Revilla, Claudio. 2017. “Computation and Social Science.” In Introduction to Computational Social Science: Principles and Applications, edited by Claudio Cioffi-Revilla, 35–102. Cham: Springer International Publishing.
Domingos, Pedro. 2015. The Master Algorithm: How the Quest for the Ultimate Learning Machine Will Remake Our World. Basic Books.
Grimmer, Justin. 2015. “We Are All Social Scientists Now: How Big Data, Machine Learning, and Causal Inference Work Together.” PS Polit. Sci. Polit. 48 (1): 80–83.
Grimmer, Justin, Margaret E Roberts, and Brandon M Stewart. 2021. “Machine Learning for Social Science: An Agnostic Approach.” Annu. Rev. Polit. Sci. 24 (1): 395–419.
Hilbert, Martin, and Priscila López. 2011. “The World’s Technological Capacity to Store, Communicate, and Compute Information.” Science 332 (6025): 60–65.
Lazer, David, Alex Pentland, Lada Adamic, Sinan Aral, Albert-Laszlo Barabasi, Devon Brewer, Nicholas Christakis, et al. 2009. “Social Science. Computational Social Science.” Science 323 (5915): 721–23.
Marcus, Gary, and Ernest Davis. 2019. Rebooting AI: Building Artificial Intelligence We Can Trust. Knopf Doubleday Publishing Group.
Mayer-Schönberger, Viktor, and Kenneth Cukier. 2012. Big Data: A Revolution That Transforms How We Work, Live, and Think. Boston: Houghton Mifflin Harcourt.
Metz, Cade. 2022. Genius Makers: The Mavericks Who Brought AI to Google, Facebook, and the World. United Kingdom: Penguine Random House.
Footnotes
The seminar consists of a mix of theoretical and applied sessions. For the applied session we will rely on the software R. While there are various programs one could use, the reasons mentioned above speak for R (my personal view). The only real contendor for data science is Python. See here for a nice overview of the differences between the two.↩︎
“Ultimately Johnson adopts the definition of”complexity science” as “the study of the phenomena which emerge from a collection of interacting objects” Wikipedia↩︎