1 Day 1 (June 3)
1.1 Welcome and preliminaries
-
- How I will use Canvas
-
- Is the course right for you?
- Recomended material
- Statistical programming languages
- Reproducibility requirement (data analysis can be successfully repeated)
- Academic Honesty: working in groups, sharing code, use of generative AI (e.g., ChatGPT), etc.
- Grades
- Topics
- Minimalist teaching philosophy
- Value of this course
- How best to interact with me
Who is in this class?
- Group work and collaboration
url <- "https://www.dropbox.com/scl/fi/hbctfmc01bprd1v58fafl/students_STAT_705_2024.csv?rlkey=6qaml9jh8ydh3qn0vgxldkjkh&dl=1"
df <- read.csv(url)

par(mar=c(13,2,2,2))
plot(rev(sort(table(df$degreeProgram))),las=2,xlab="",ylab="Number of students",ylim=c(0,5))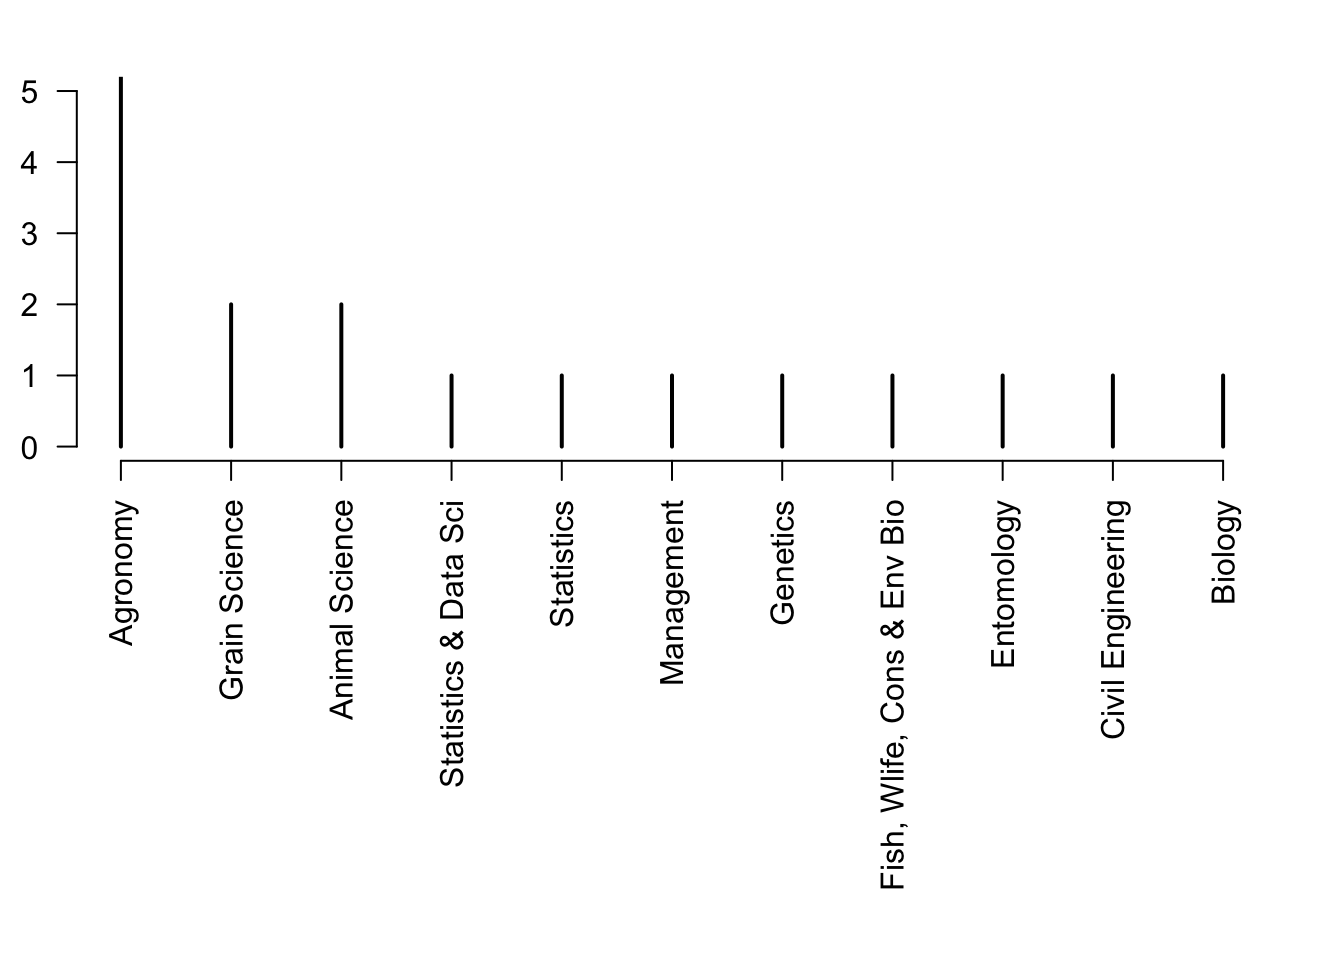
par(mar=c(13,2,2,2))
plot(rev(sort(table(df$classLevel))),las=2,xlab="",ylab="Number of students",ylim=c(0,13))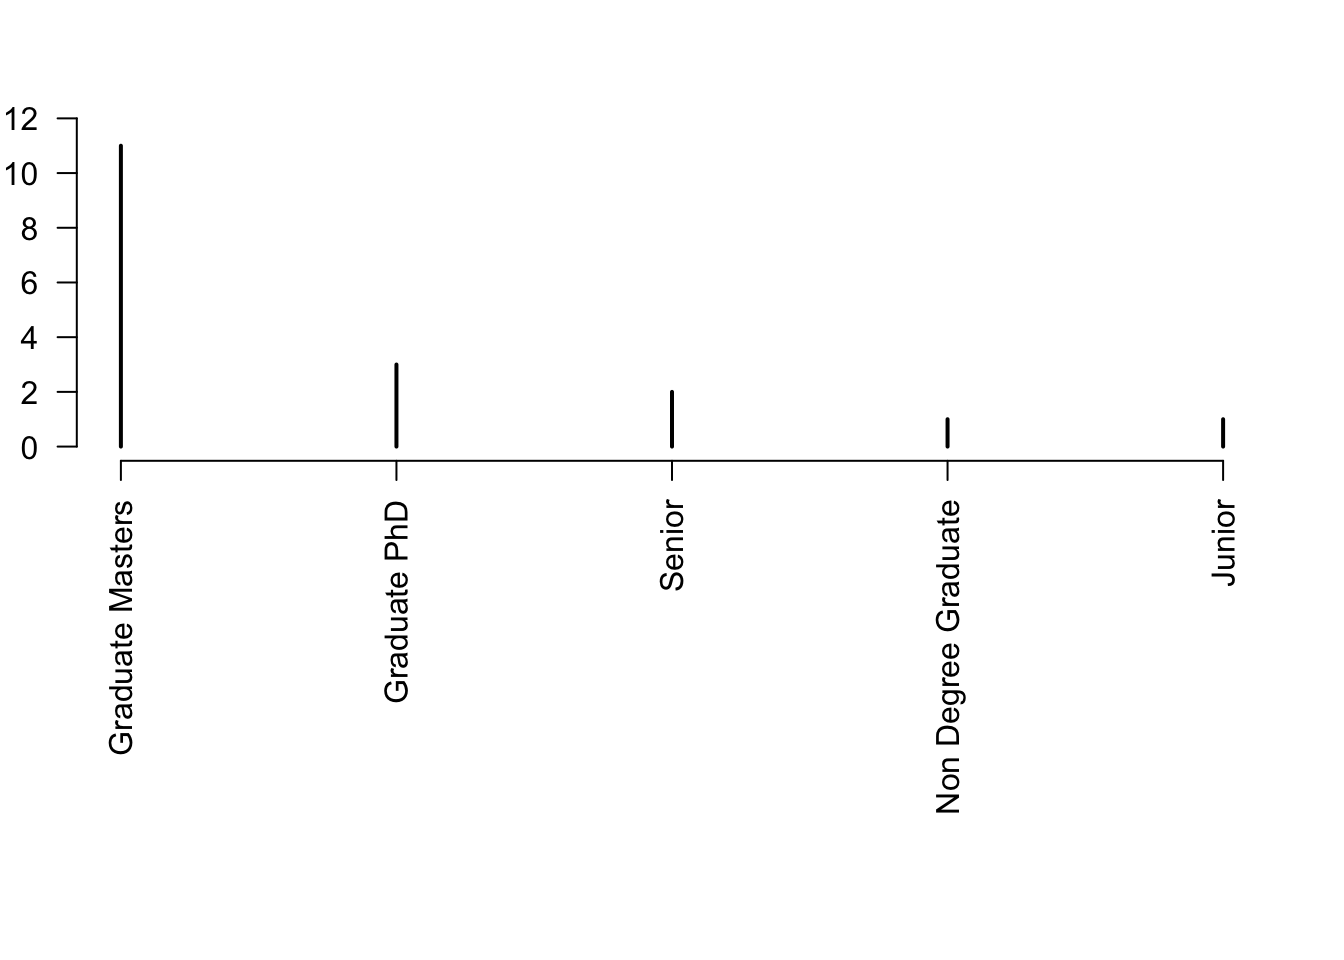
1.2 Assignment 1
- Assignment 1
- In-class demonstration of R Markdown