Chapter 1 R and RStudio
R is a free scripting language software for statistical computing and graphics. It runs on Windows, MacOS and a wide variety of unix platform. By documenting all of your analyses using R scripts, you ensure that your results are reproducible, by yourself and others. Advanced capabilities are enabled by a plethora of freely-available R packages, authored by users around the world.
RStudio is an integrated development environment for R. RStudio is a free, open source application. It is available in two formats: RStudio Desktop and RStudio Cloud. RStudio desktop is a regular desktop application that runs on Windows, MacOS or Linux. RStudio Cloud runs on a remote server and allows accessing RStudio through a web browser.
RStudio Cloud is portable but it is heavily dependent on an internet connection and the internet speed. Desktop RStudio is not as portable but you can write scripts anywhere without an internet connection. You may find the desktop version has a much faster interface than the cloud version.
1.1 Desktop RStudio
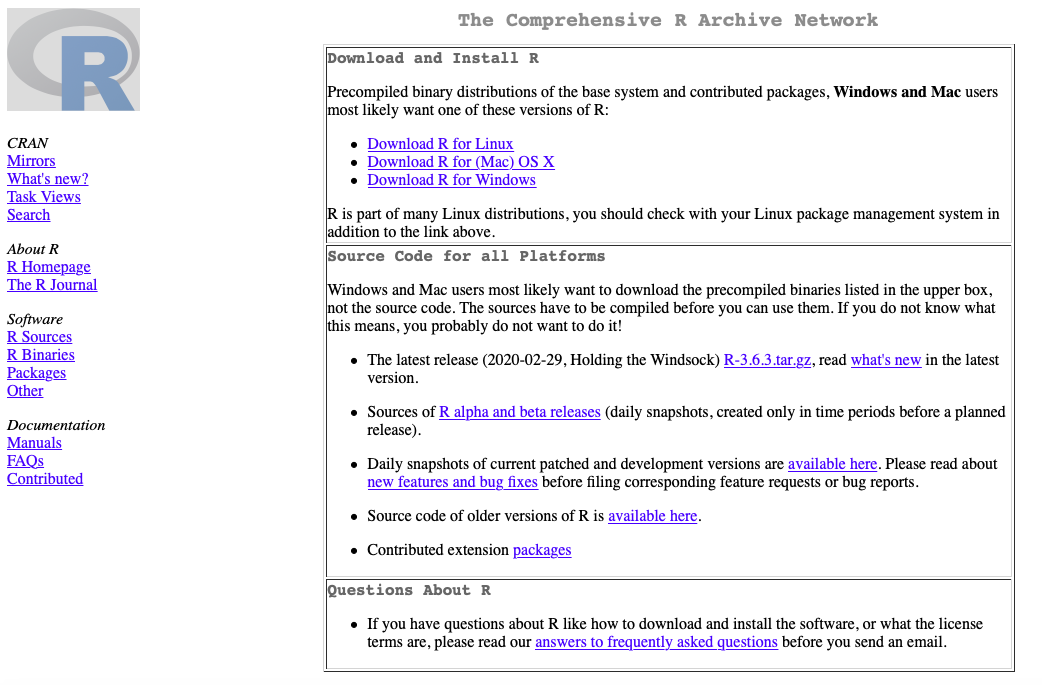
Downloading and Installing R
To download R, go to cran.r-project.org. Pick the one that is appropriate for your operating system. Then download and install.
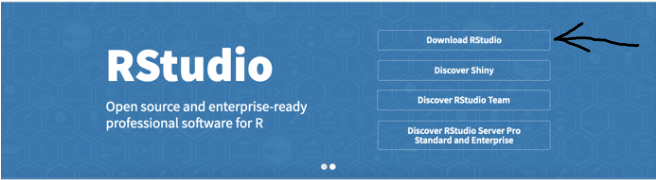
Downloading and Installing Desktop RStudio
Next, download desktop RStudio in order to have the tools to work with R in a user-friendly environment. To download, go to rstudio.com. Once on the home page, click “Download RStudio.”
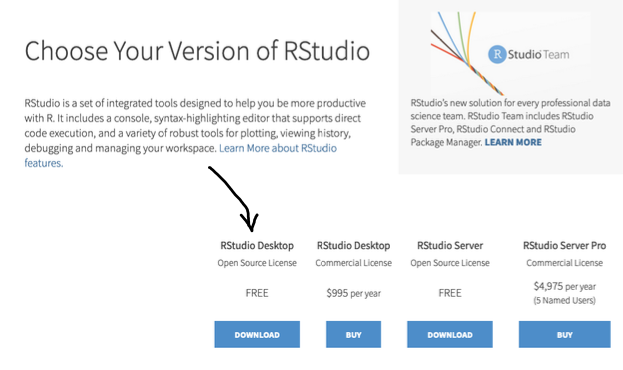
Next, choose “RStudio Desktop Open Source License FREE.”. You’ll be given a list of installers from which you should choose the one that is appropriate for your operating system.
When the install file is downloaded, go ahead and install. It is important that you install RStudio only after you complete the R installation. During the RStudio installation process, the setup file should automatically detect the path to your R installation. Once installation is complete, simply open RStudio to start working with R. You do not have to open the R application directly.
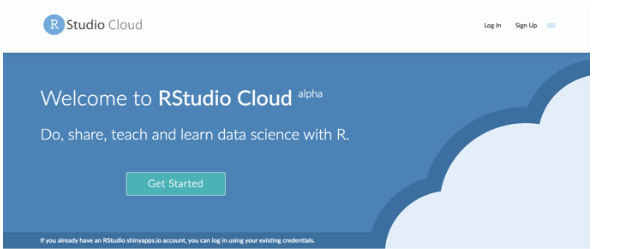
1.2 RStudio Cloud
RStudio Cloud runs in a browser connected to RStudio Server. To use RStudio Cloud, go to rstudio.cloud. Create an account, and you will be ready to write R scripts.
1.3 RStudio Layout
When you open RStudio, you will see the following four panels (sometimes also called panes or windows). Note: The panels you see may be in a different order than those shown below. You can rearrange the order of the windows under RStudio preferences. You can also change their shape by either clicking the minimize or maximize buttons on the top right corner of each panel, or by clicking and dragging the middle of the borders of the windows.
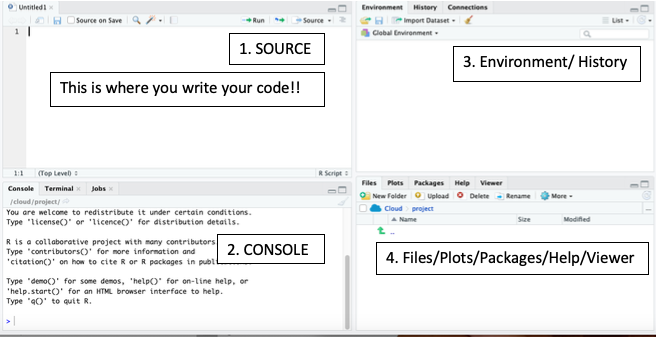
SOURCE
- This is where you write and edit your R scripts.
- When you open RStudio, it will automatically start a new untitled script. You may want to immediately save to a new file name. That way, if your computer crashes while working, RStudio will have your code waiting for you when you return.
- Your code will not be evaluated until it is sent to the Console. To send your code to the Console, highlight the code you wish to evaluate and click the “Run” button on the top right-hand side of the Source panel. Alternatively, after typing your code, use the keystrokes “Command + Return” on a Mac or “Control + Enter” on a PC to run your code. This will send your code from the Source to the Console.
CONSOLE
- This is where R evaluates codes. It is the heart of R.
- The prompt, >, tells you that R is ready for a new code. It is highly recommended that you do not type your code in this panel unless you want to do a quick analysis. The reason is that if you type a code into the Console, it will not be saved (although you can look back at your command history).
- Once you run your code, the analysis is shown in this pane.
ENVIRONMENT/HISTORY
- This panel is sometimes called the 3rd panel.
- The Environment tab is where you see the names of all the data objects (like vectors, matrices and data frames) that you have defined in your R session.
- Information like number of observations and rows in data objects are shown in the Environment tab.
- The history tab shows you a history of all your code previously evaluated in the Console.
FILES/PLOTS/PACKAGES/HELP/VIEWER
- This panel is sometimes called the 4th panel.
- Files tab – shows files and gives you access to the file directory.
- Plots tab – shows your plots which can be exported.
- Packages tab – shows a list of R packages installed. A check mark by the package indicates that the package is loaded in the current session.
- Help tab – gives a description of the function, its usage and syntax. To get help with a function, type the function name in the search box on the upper right-hand corner of the panel.
- Viewer tab – is used for viewing local web content.