Chapter 13 Parallel Boxplot
Parallel boxplots are very useful for comparing groups of variables. They give a very quick visual impression of what is happening.
13.1 With a Grouping Variable (or Factor)
Let us look at the dataset built into R called chickwts. This dataset shows the chick weight, in grams, 6 weeks after newly hatched chicks were randomly placed into six groups by feed type. The dataset has 2 variables, weight and feed. The variable, weight, is quantitative while the variable, feed, is categorical.
In Basic R
If there is a grouping variable, we use the function,where factor is the grouping variable desired.
Let us draw a boxplot of the chick weights grouped by feed type.
boxplot(chickwts$weight ~ chickwts$feed,
        main = "Chick Weight by Feed Type",
        xlab = "Feed Type",
        ylab = "Weight (in grams)")
Using Ggplot2
In the aesthetic mappings of the ggplot function, be sure to include the data, the x and the y variables to be used for plotting. The geometric shaped used here is geom_boxplot( ).
ggplot(data = chickwts, aes(x = feed, y = weight)) +
  geom_boxplot( ) +
  labs(title = "Chick Weight by Feed Type",
       x = "Feed Type",
       y = "Weight (in grams)")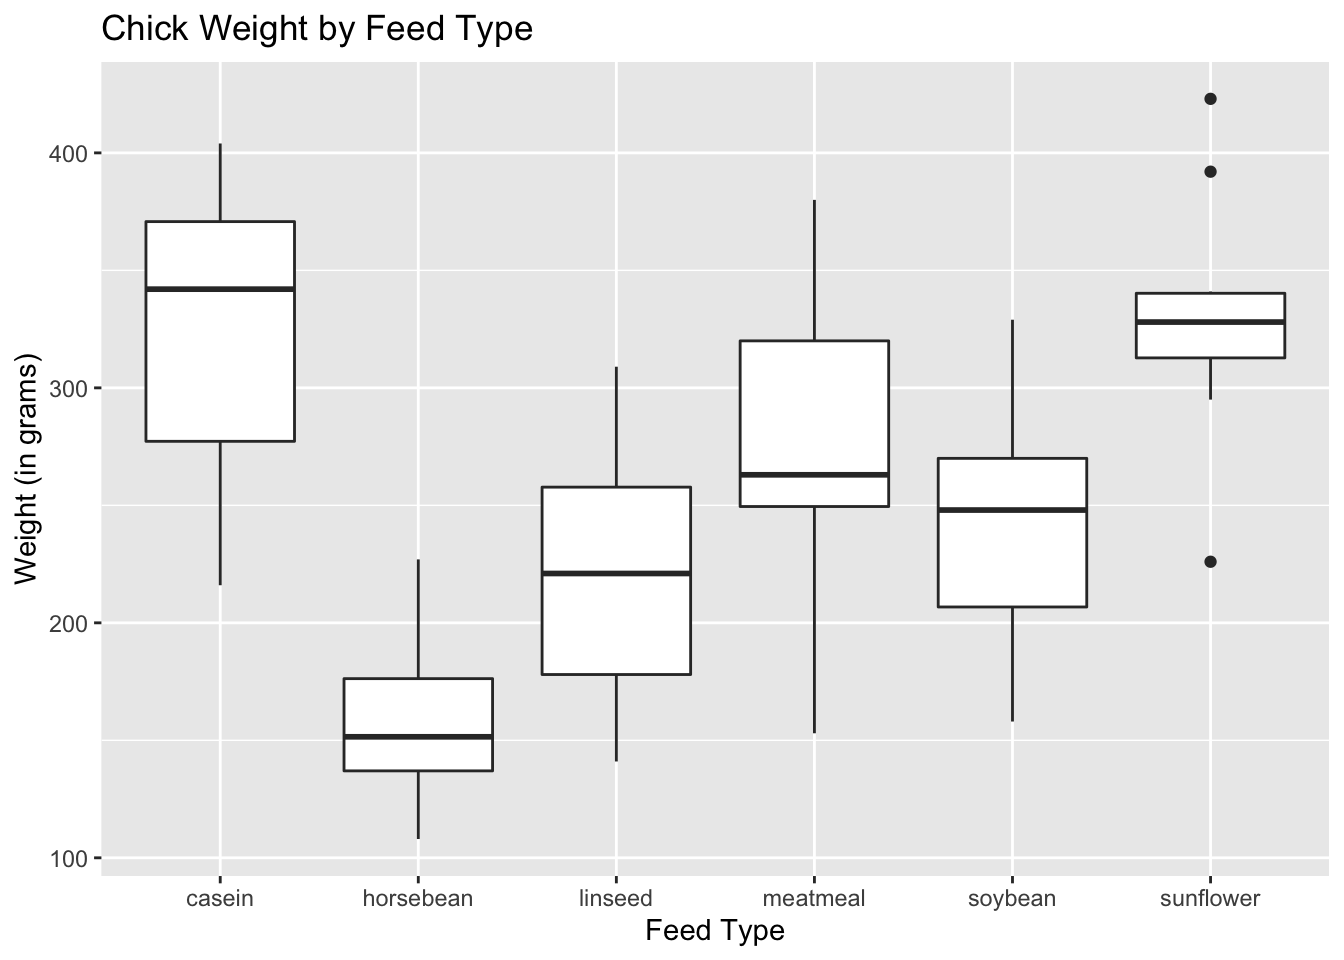
13.2 Without a Grouping Variable (or Factor)
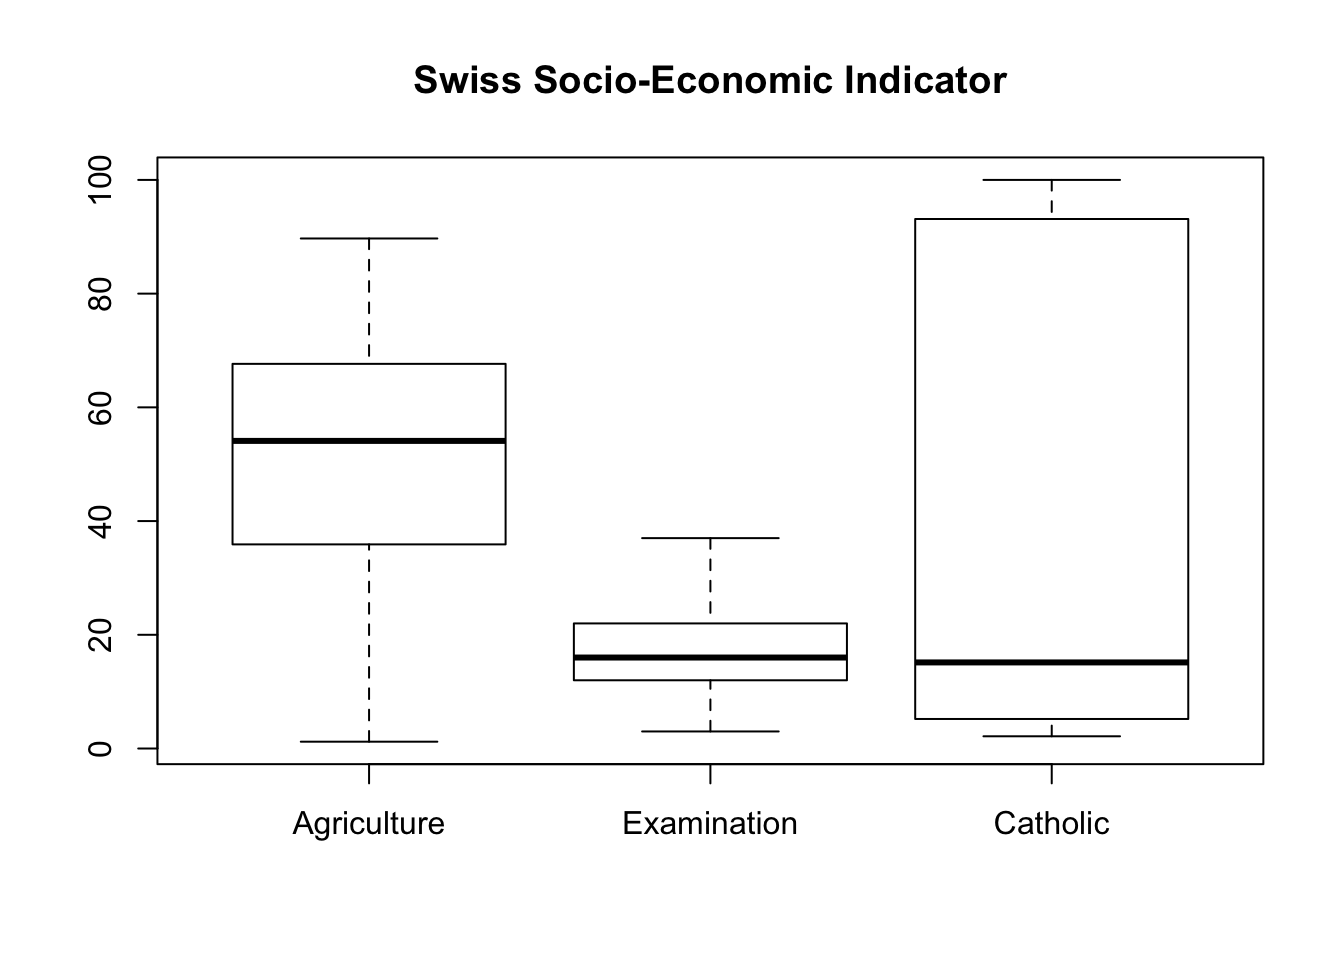
Let us look at the dataset called swiss. This is a dataset on the fertility and socio-economic measures for the French-speaking provinces of Switzerland. For our boxplot, we will be comparing the socio-economic indicators Agriculture (% of males involved in agriculture as an occupation), Examination (% of draftees receiving highest mark on the army examination) and Catholic (% of Catholics).
In Basic R
If there is no grouping variable, we use the function,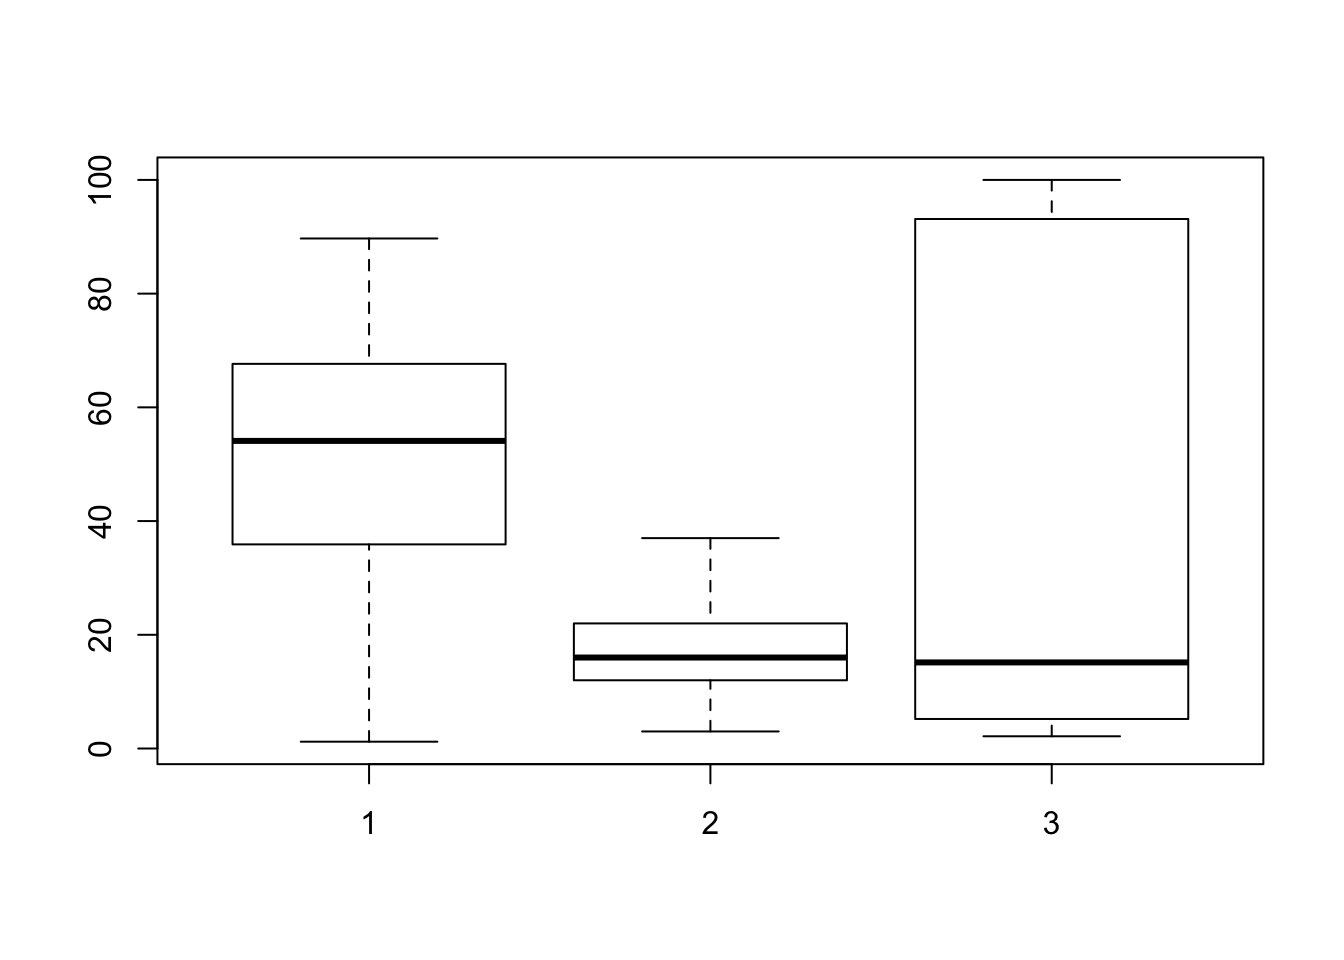
As you can see from the boxplot, the reader will have a hard time determining what the numbers 1, 2, 3 mean. To put a more meaningful label, add the argument, names( ) and list the socio-economic indicators, in the order they appear on the boxplot.
boxplot(swiss$Agriculture, swiss$Examination, swiss$Catholic,
        main = "Swiss Socio-Economic Indicator",
        names = c("Agriculture", "Examination", "Catholic"),
        ylab = "Percentages")
Alternatively, if you know the variable’s column number, you can state the column number to draw the boxplot. The variables will be used as the boxplot labels.