starbucks <- readr::read_csv('https://raw.githubusercontent.com/rfordatascience/tidytuesday/master/data/2021/2021-12-21/starbucks.csv')19 March 30, 2023
19.1 Welcome!
As a reminder:
CPR = Copy, paste, and run
The group typically independently comes together for dedicated time to use R.
Everybody can work at their own pace or in groups, etc.
Senior members help support junior members
When it doubt: Google
- Being able to identify a solution online is a unique skill.
Have fun
Welcome! We will use data about Starbucks. The following might be helpful to load:
tidyverse
19.2 The Data
You can CPR the following:
Have a look around the data. The milk columns represents:
- 0 none
- 1 nonfat
- 2 2%
- 3 soy
- 4 coconut
- 5 whole
19.3 A. Basic Descriptives
- Calculate the mean and SD calories and caffiene for each ‘classic’ size of drink (short, tall, grande, venti, trenta). Hint: make an object of the sizes you want and use that object in filter.
1.b. Like above, calculate the mean and sd for cholesterol for each different type of milk and size. Only use the ‘classic’ sizes. Hint: group_by(milk, size). Why would there be any NAs? Hint: also summarize, but add Count=n().
- How many of each size are there? If someone is walking out of Starbucks, what’s the mos tlikely size they have based on these frequencies?
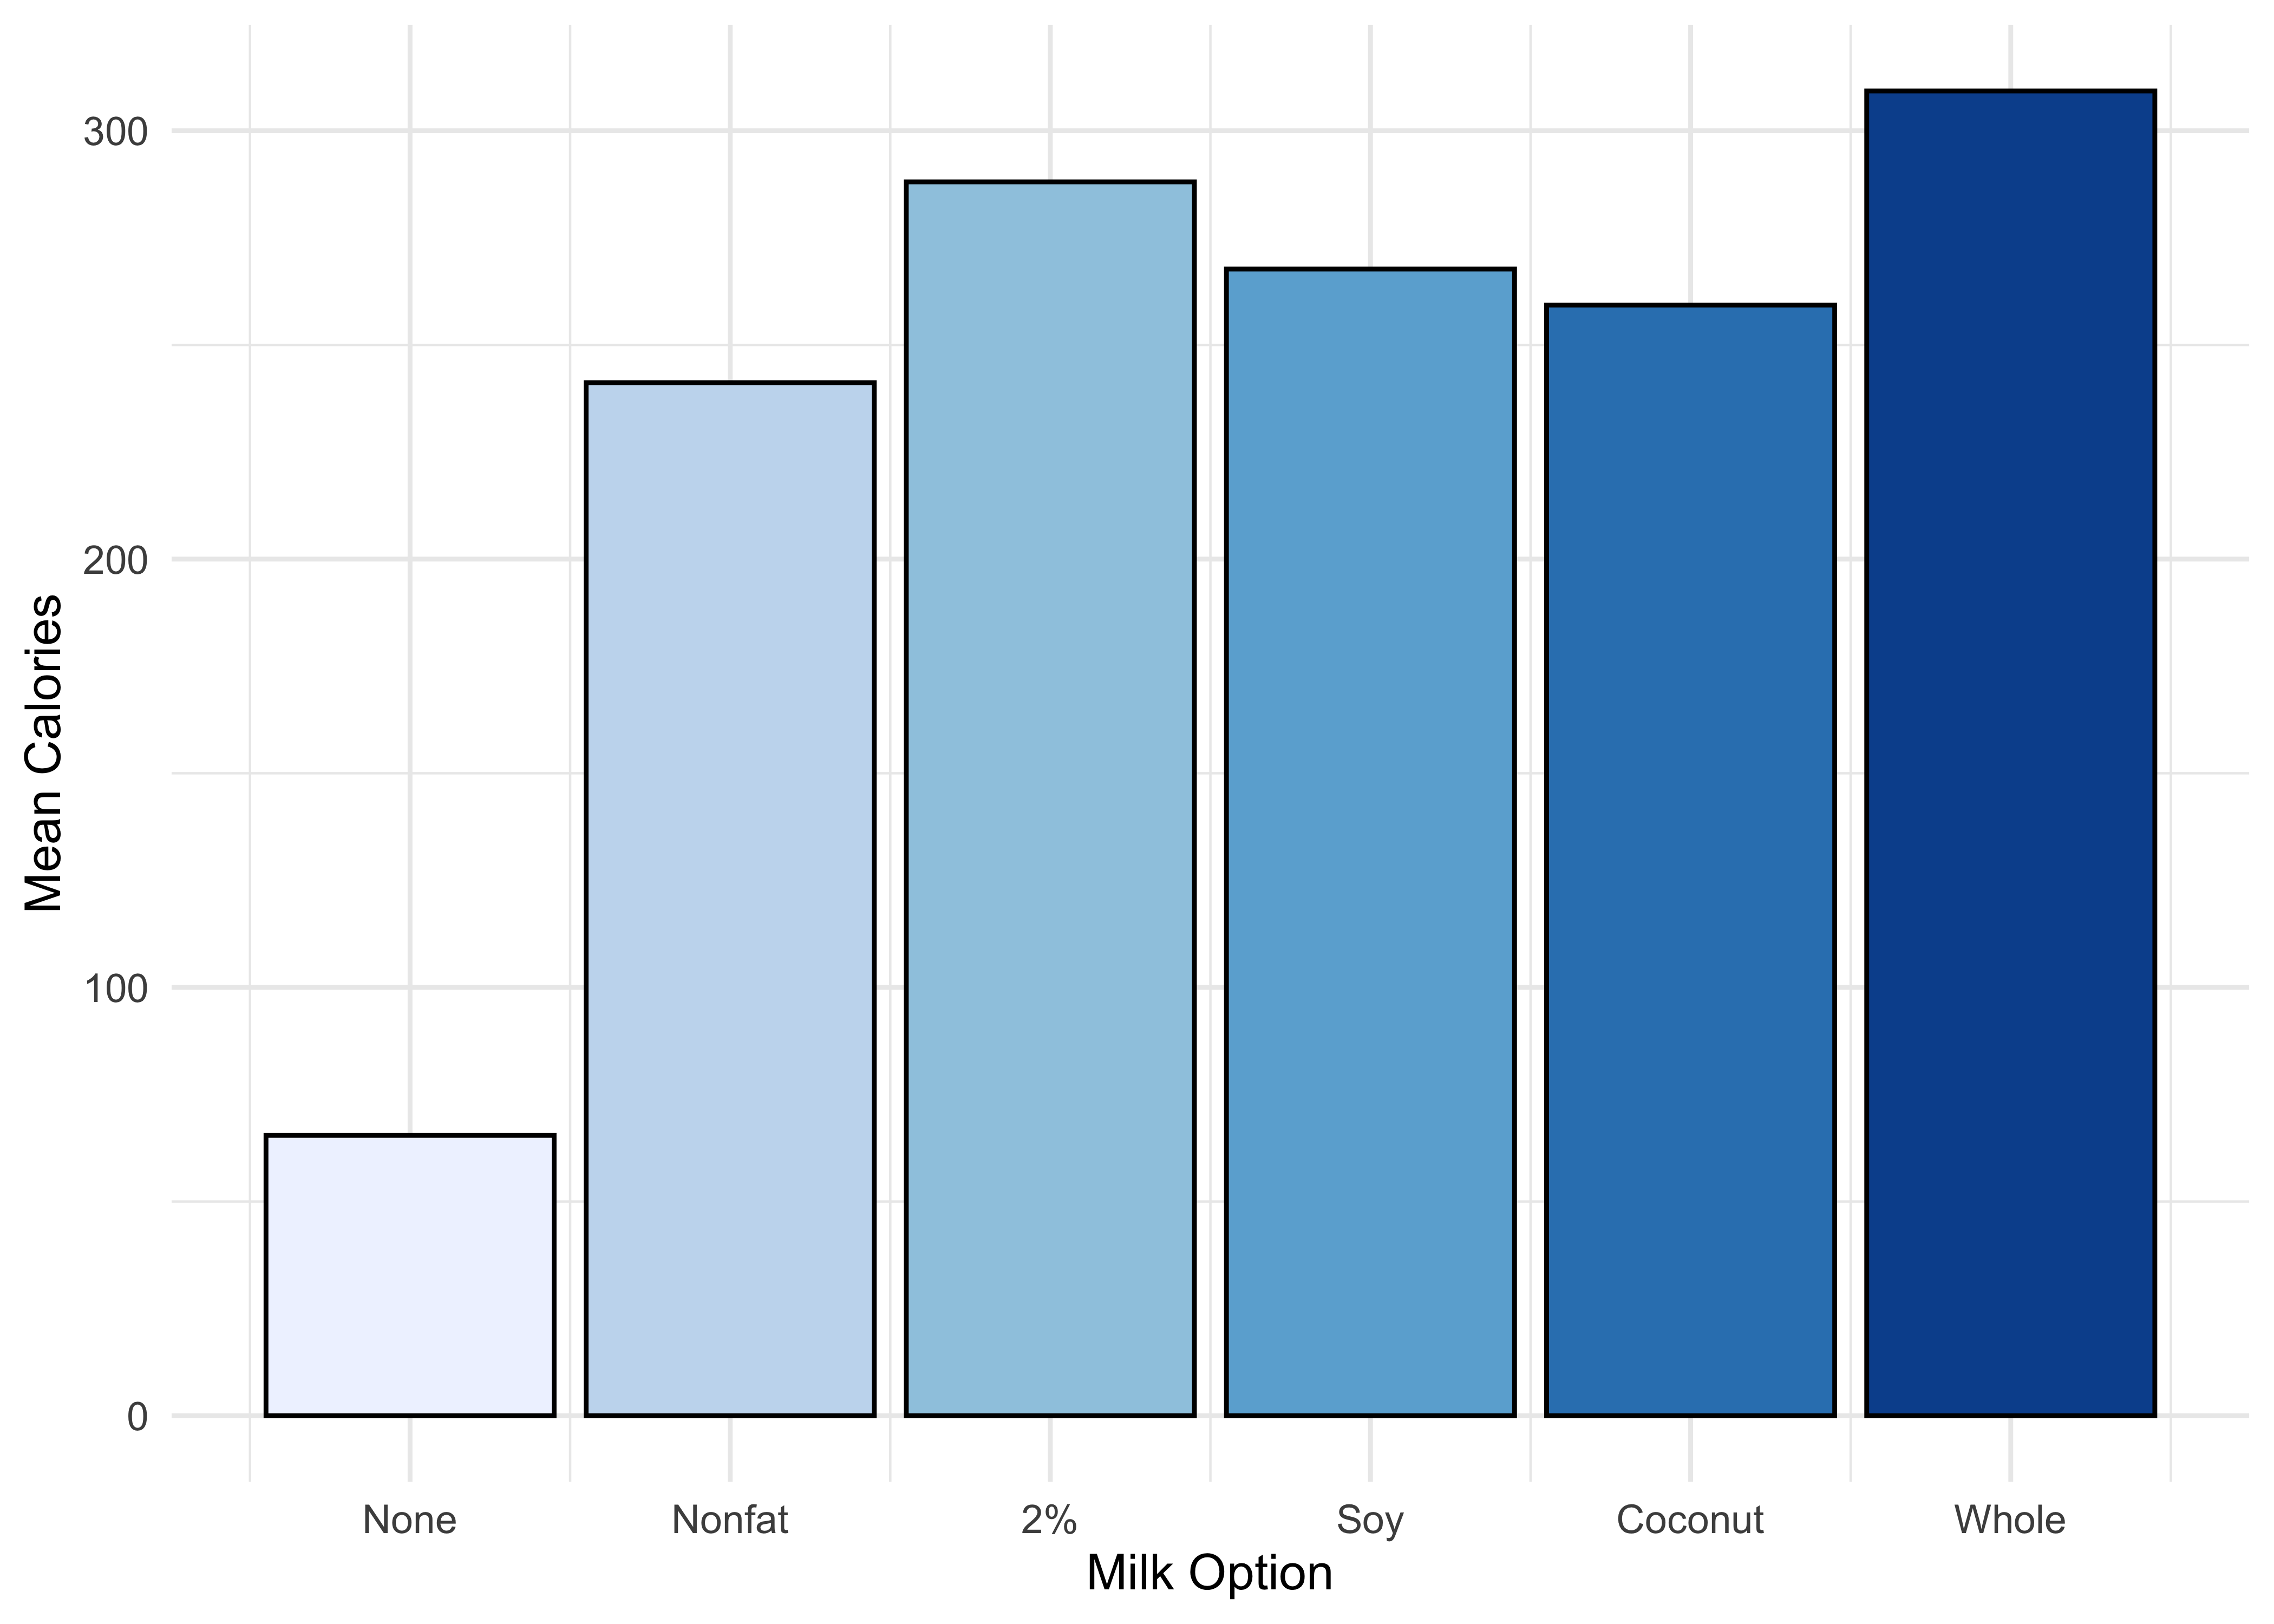
- Using only the grande sizes, get the mean calories for the different milk options.Which milk option seems to have the most calories?
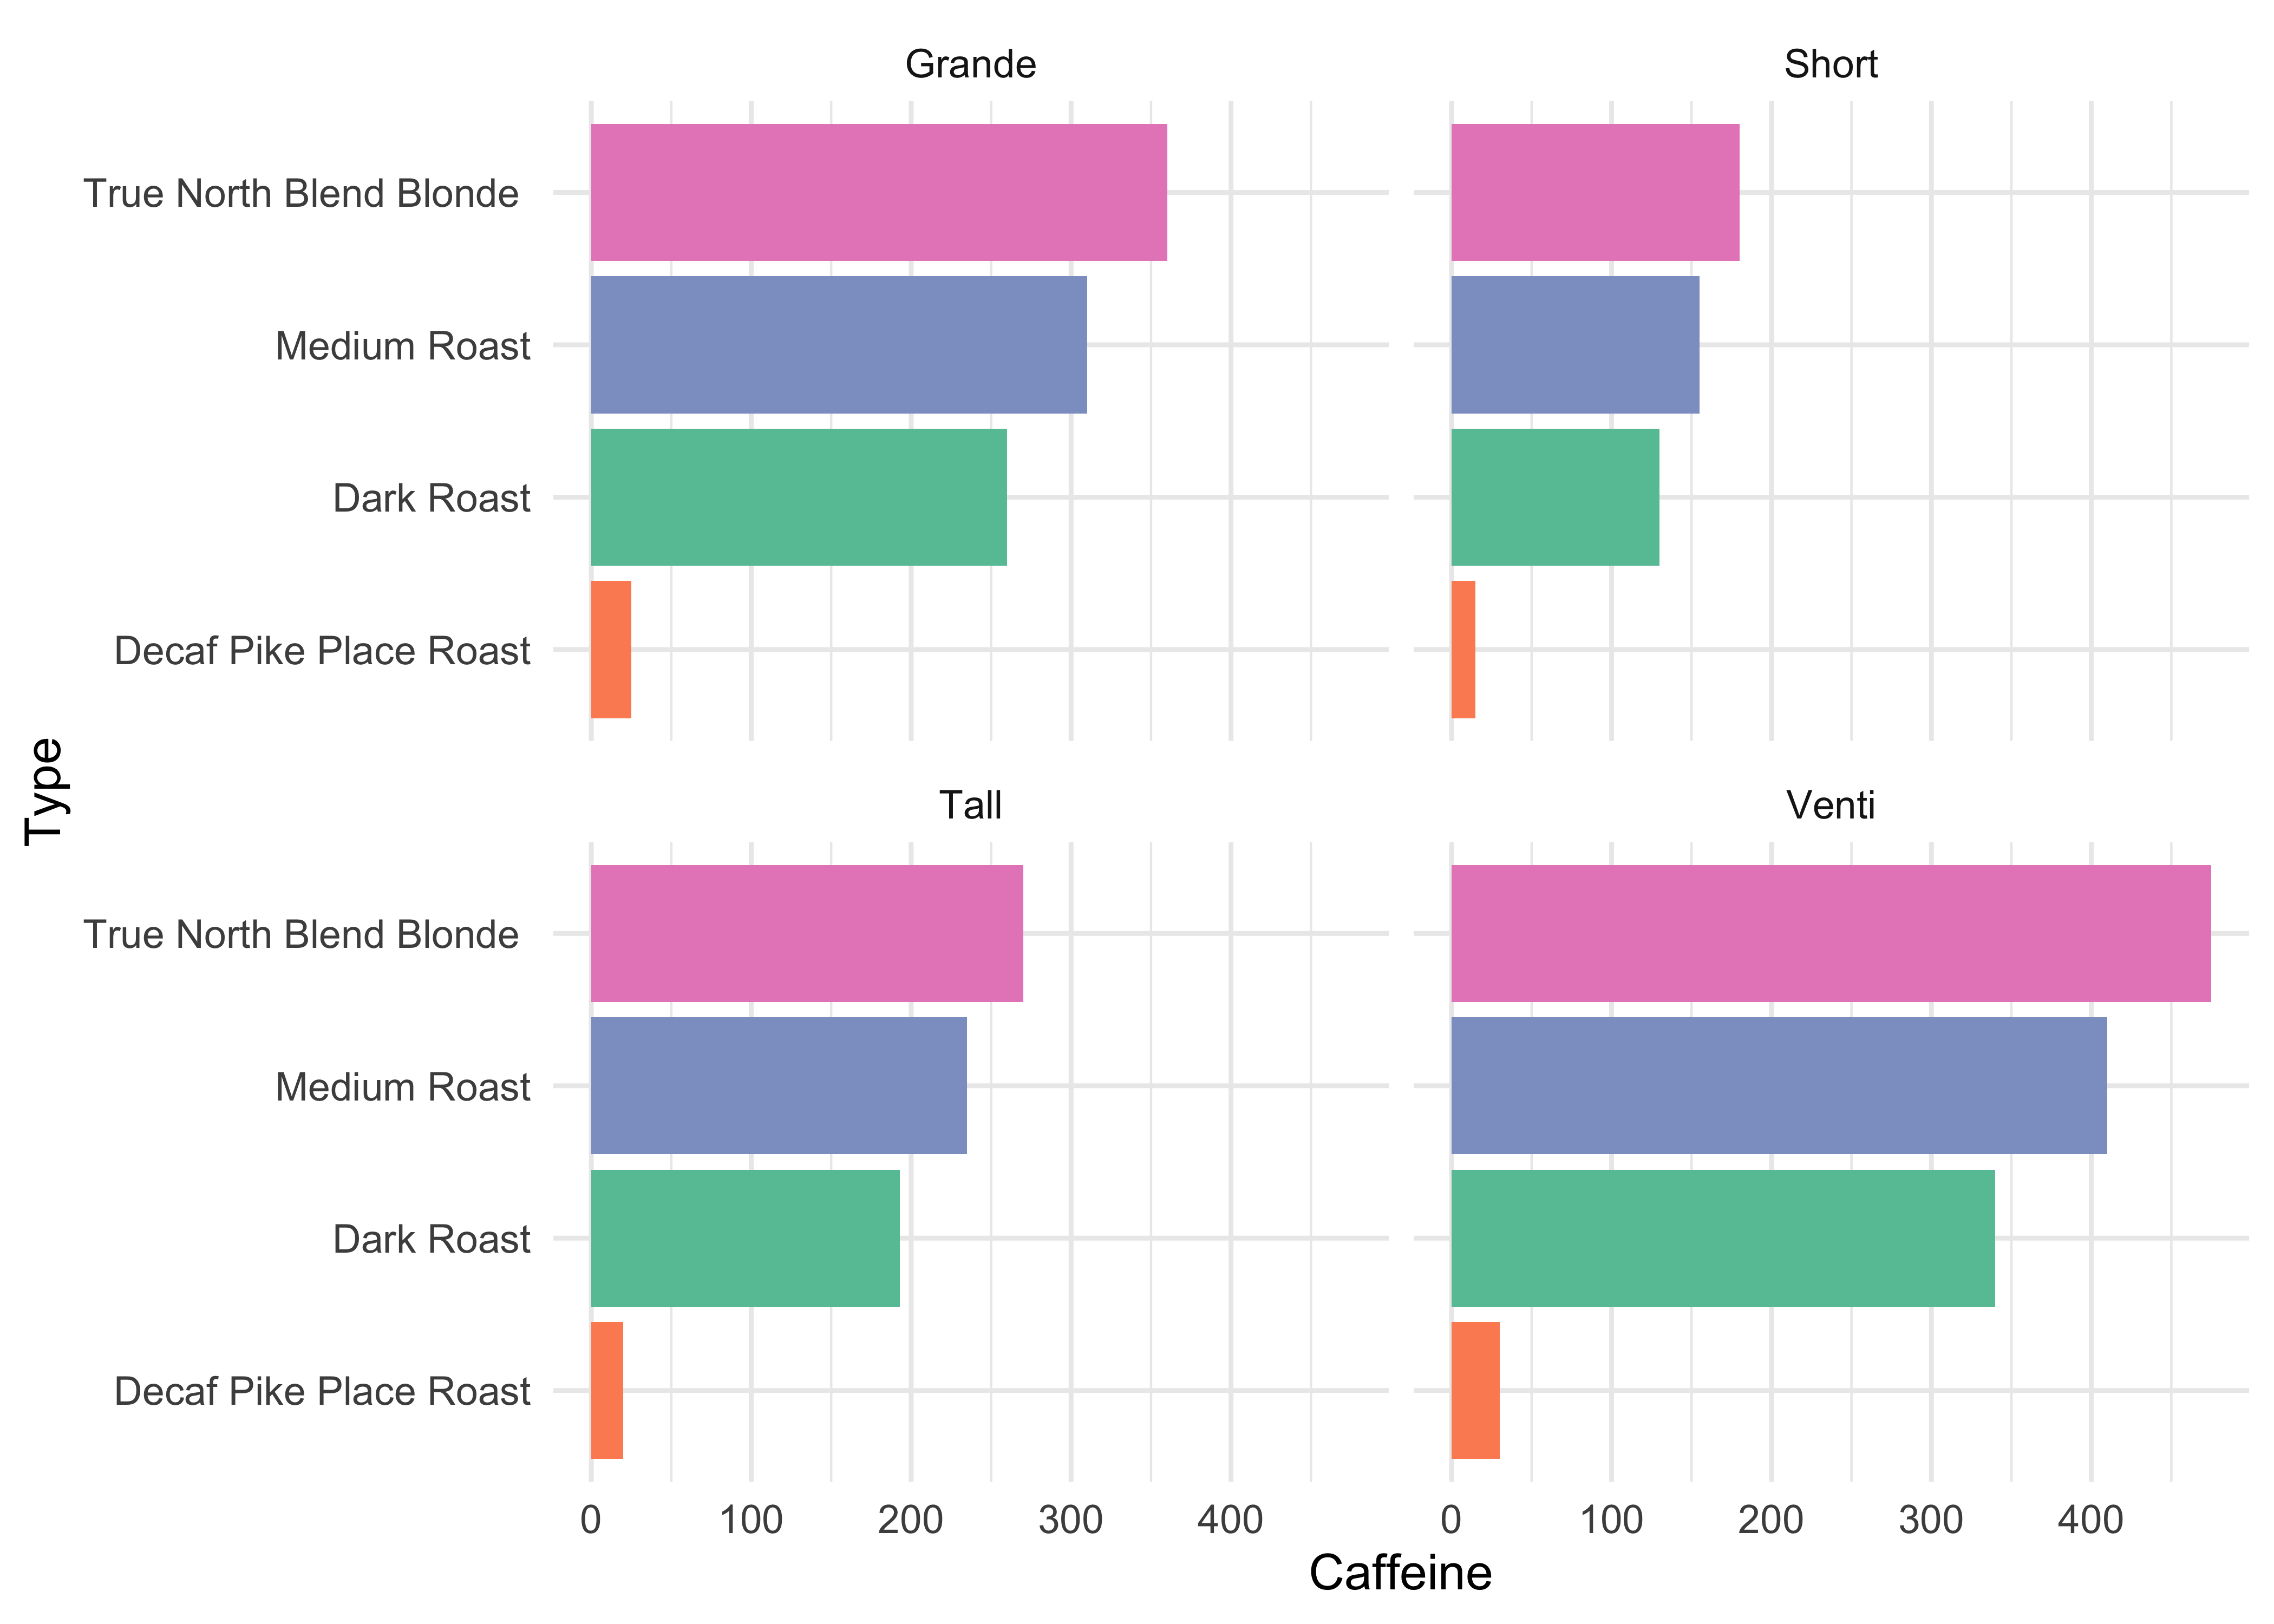
- Out of the different types of brewed coffees, which has the most caffeine. Be sure to account for sizes.
The sizes on Starbucks website list as Oz. I want mL!! What are the mL for each size?
What the… they didn’t list the protein? Please calculate how much protein is in each drink, as a new variable. Hint: only carbs, fats, and proteins have calories. Protein and carbs each have 4 calories per gram while fats have 9 calorie per gram.
Your friend says I hate coffee but want the caffeine. Recommend a drink based on the following: What drink(s) have the highest caffeine content per size ratio? **Ignore drinks with 0 mL size*.
19.4 B. Visualizing
- Plot the data from #3 above in a bar plot.The following is an example. Hint:
geom_col
- Super visualization. Re-create the following:
- For drinks that have at least SOME caffeine, plot a scatterplot of drink mL and caffeine. Put the line of best fit. Hint:
geom_smooth(method='lm', se=F)
- Plot number four from the section above. super power mode - recreate this:
19.5 C. Analyses
Run a correlation on the data used in B.3.
Run an ANOVA on grande drinks using milk type as the IV and calories as the DV. Conduct post-hoc tests.