6.7 Three or more continuous variables: Scatterplot matrix
To show all pairwise relationships between more than two continuous variables, use a scatterplot matrix.
6.7.1 Base R
Use pairs() to plot all pairwise combinations of columns of a data.frame. As we only want to plot pairs of continuous variables here, we first select just those variables.
pairs(subset(mydat,
             select = c("stheight", "stweight", "bmi", "bmipct")),
      labels = c("Height", "Weight", "BMI", "BMI-pctle"))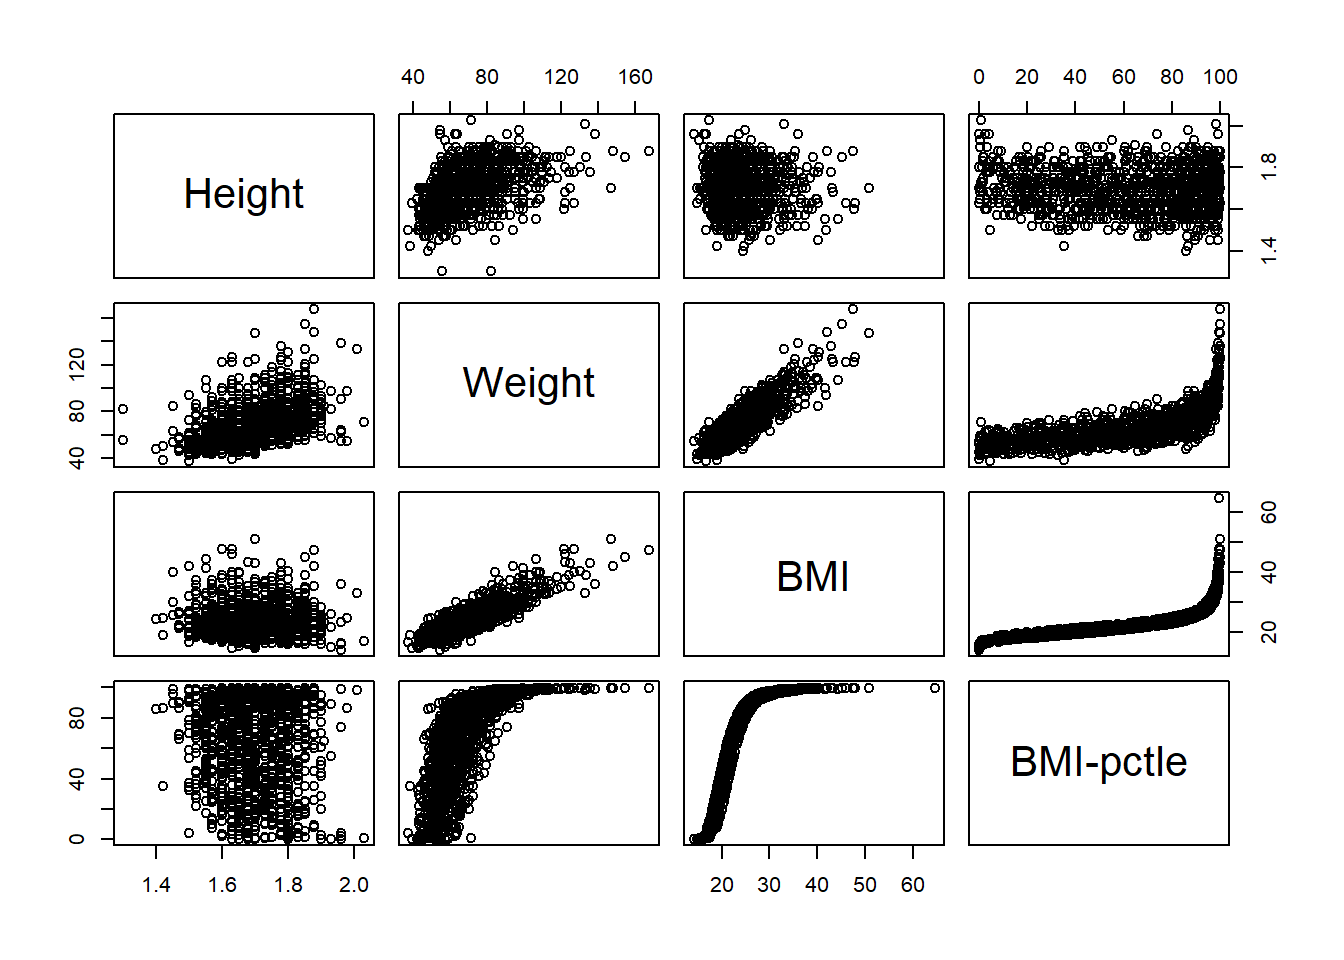
6.7.2 ggplot
In ggplot(), use the GGally library (Schloerke et al. 2024) to get the ggpairs() function which gives you not only scatterplots, but also a density curve for each variable and all pairwise correlations. See ?ggpairs for details.
library(GGally)

mydat %>%
  select(stheight, stweight, bmi, bmipct) %>%
  ggpairs(columnLabels = c("Height", "Weight", "BMI", "BMI-pctle"))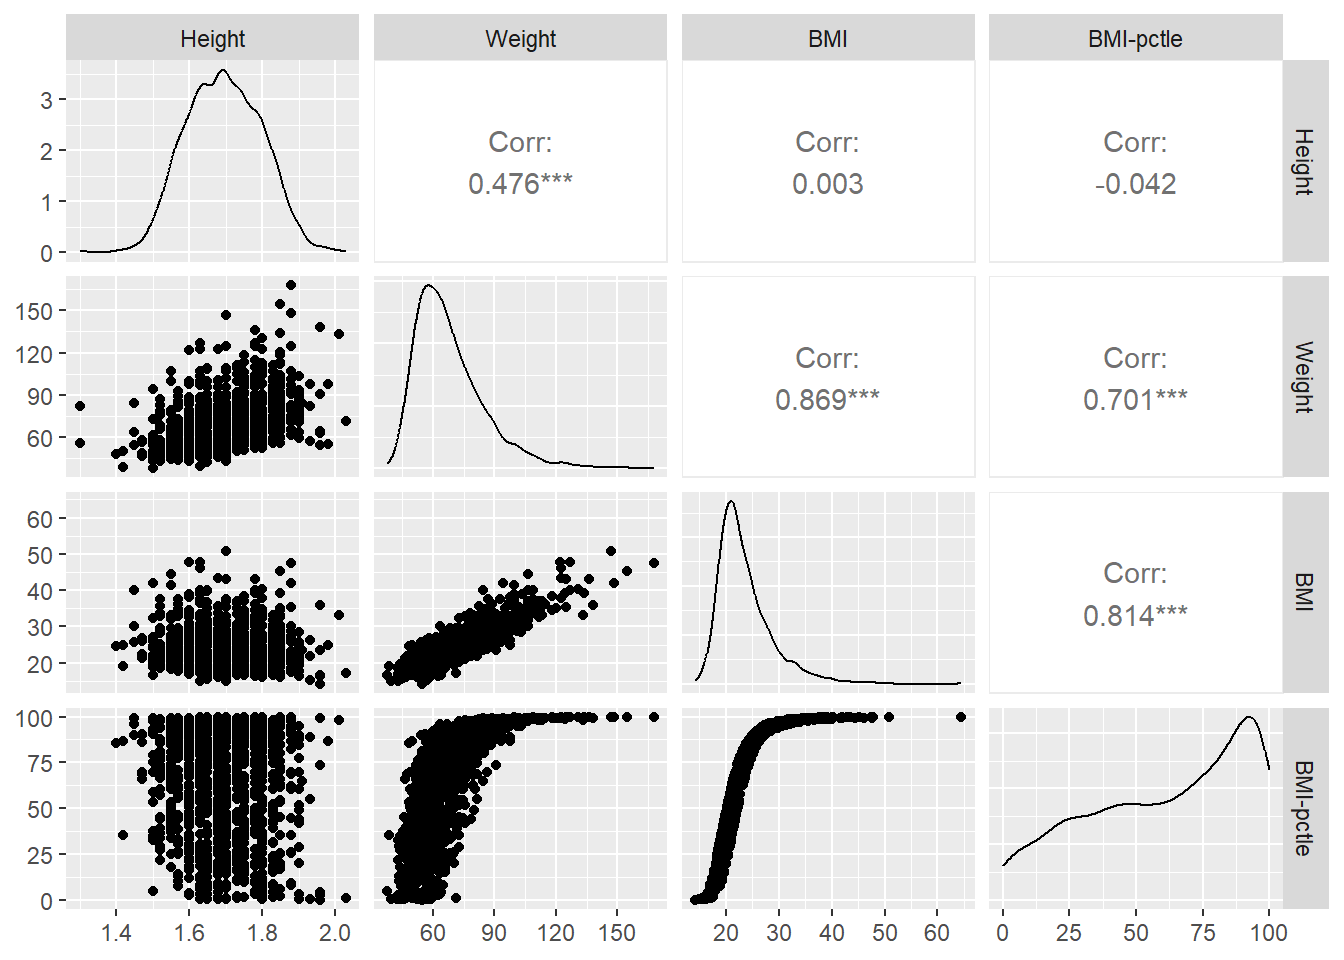
References
Schloerke, Barret, Di Cook, Joseph Larmarange, Francois Briatte, Moritz Marbach, Edwin Thoen, Amos Elberg, and Jason Crowley. 2024. GGally: Extension to Ggplot2. https://ggobi.github.io/ggally/.