5.3 Summarizing continuous data
To summarize a continuous variable, you will often use one of the following sets of statistics:
- Mean, Standard Deviation (SD), Minimum, Maximum, Number of missing values
- Median, Interquartile Range (IQR), Minimum, Maximum, Number of missing values (IQR = difference between the 75th and 25th percentiles)
How do you know which to use?
- The mean and SD are appropriate if the variable is somewhat symmetric. However, they can be misleading if the data are skewed (non-symmetric distribution) or there are outliers.
- The median and IQR can be used with any variable, but are typically used as an alternative to the mean and SD when the variable is skewed (not symmetric) or there are outliers since they are robust to skew and outliers.
NOTE: “Outliers” are values that are far away from the bulk of the values.
Use the following functions to compute these statistics:
mean(x, na.rm = T)
sd(x, na.rm = T)
min(x, na.rm = T)
max(x, na.rm = T)
sum(is.na(x)) # Number of missing values
median(x, na.rm = T)
IQR(x, na.rm = T)
na.rm = T tells R to remove missing values. Otherwise, if there are any missing values, you will get a result of NA.
5.3.1 Mean or Median: Examining symmetry
Follow the steps below to determine, for each variable listed below, whether you should report the mean and SD or the median and IQR.
- Cholesterol (mg/dL) (
choles) - Triglycerides (mg/dL) (
trigly)
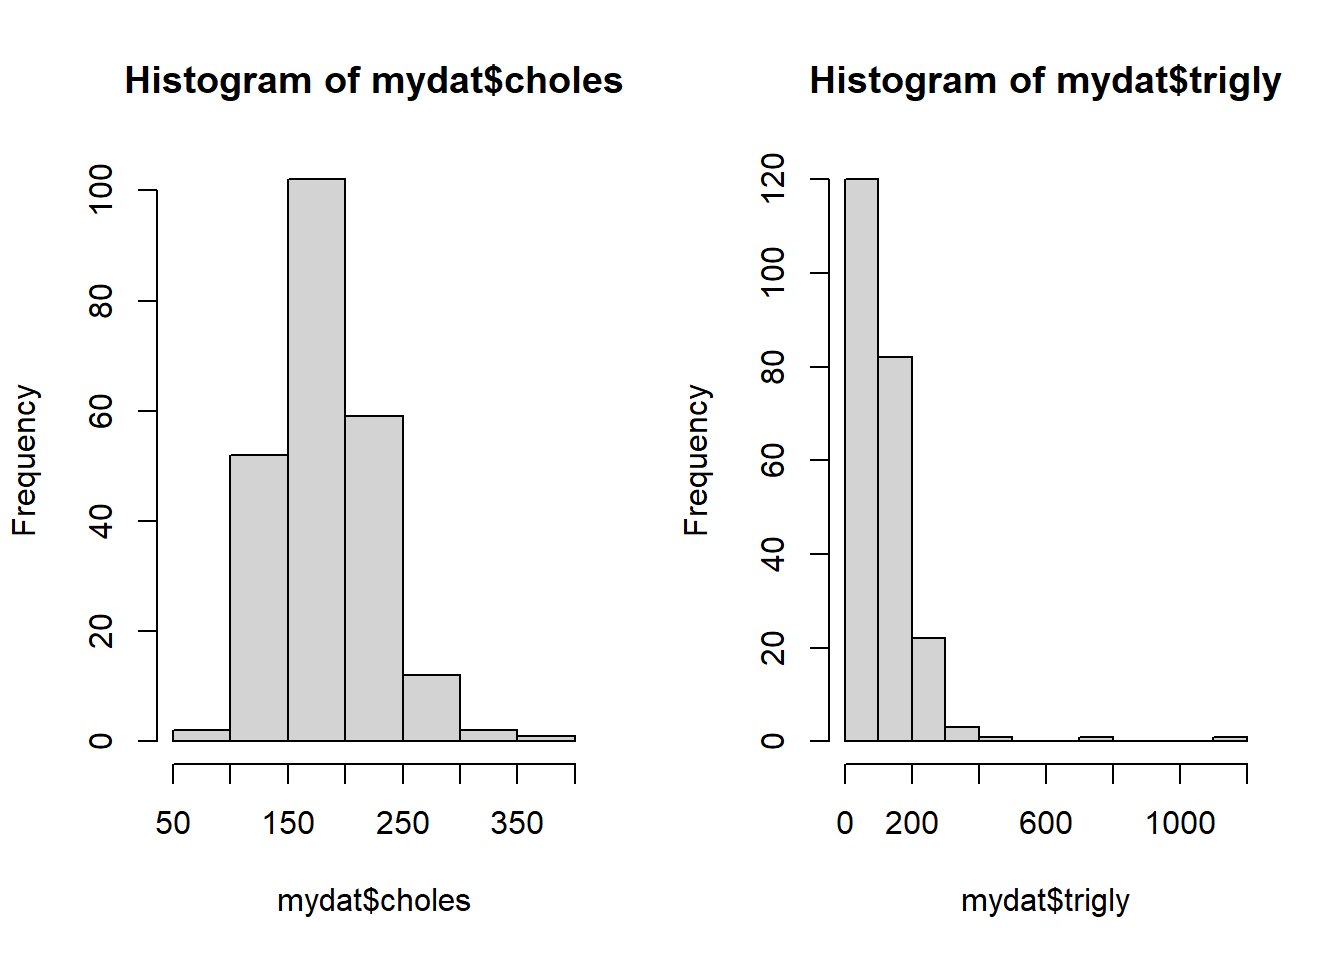
For each, compute the mean() and median(). If the mean and median are similar for variable, then it’s distribution is symmetric.
## [1] 185.1## [1] 180## [1] 120.9## [1] 94.5Based on these numbers, we suspect cholesterol is symmetric but triglycerides might be skewed. We can confirm these suspicions using histograms to visually assess symmetry.
Let’s create a function for summarizing continuous variables. We will include if and else statements to allow the user to decide on using the mean and SD or the median and IQR by choosing SKEW = F or T, respectively.
myfun_cont <- function(x, SKEW = F) {
  # Count the number of missing values
  NMISS <- sum(is.na(x))
  # Min and max
  MIN   <- min(x, na.rm = T)
  MAX   <- max(x, na.rm = T)
  if (!SKEW) {
    # Symmetric x
    # Mean
    CENTER <- mean(x, na.rm = T)
    # Standard deviation
    SPREAD <- sd(  x, na.rm = T)
    STATS  <- "mean/sd"
  } else if (SKEW) {
    # Skewed x
    # Median
    CENTER <- median(x, na.rm = T)
    # Inter-quartile range
    SPREAD <- IQR(x, na.rm = T)
    STATS <- "median/IQR"
  }
  # Putting it together
  OUT        <- data.frame(CENTER, SPREAD, MIN, MAX, NMISS, STATS)
  names(OUT) <- c("center", "spread",  "min", "max", "nmiss", "stats")
  return(OUT)
}

myfun_cont(mydat$choles)
## center spread min max nmiss stats
## 1 185.1 44.22 87 380 20 mean/sd## center spread min max nmiss stats
## 1 94.5 79.5 18 1102 20 median/IQR