6.6 Continuous vs. Continuous: Scatterplot with optional regression line
Visualizing the relationship between two continuous variables is typically done with a scatterplot.
6.6.1 Base R
The scatterplot is one of the simplest plots to create in base R. Simply call plot() with two continuous variables. Adding a regression line is simple, as well. The lm() function fits a linear model, or linear regression in the case of two continuous variables, and abline(), when fed an lm object, plots the regression line.
# With plot, the order is x, y
plot(mydat$stheight, mydat$stweight,
     xlab = "Height (m)", ylab = "Weight (kg)",
     main = "Regression Line")

# Fit regression
reg.fit <- lm(stweight ~ stheight, data = mydat)

# Add regression line
abline(reg.fit)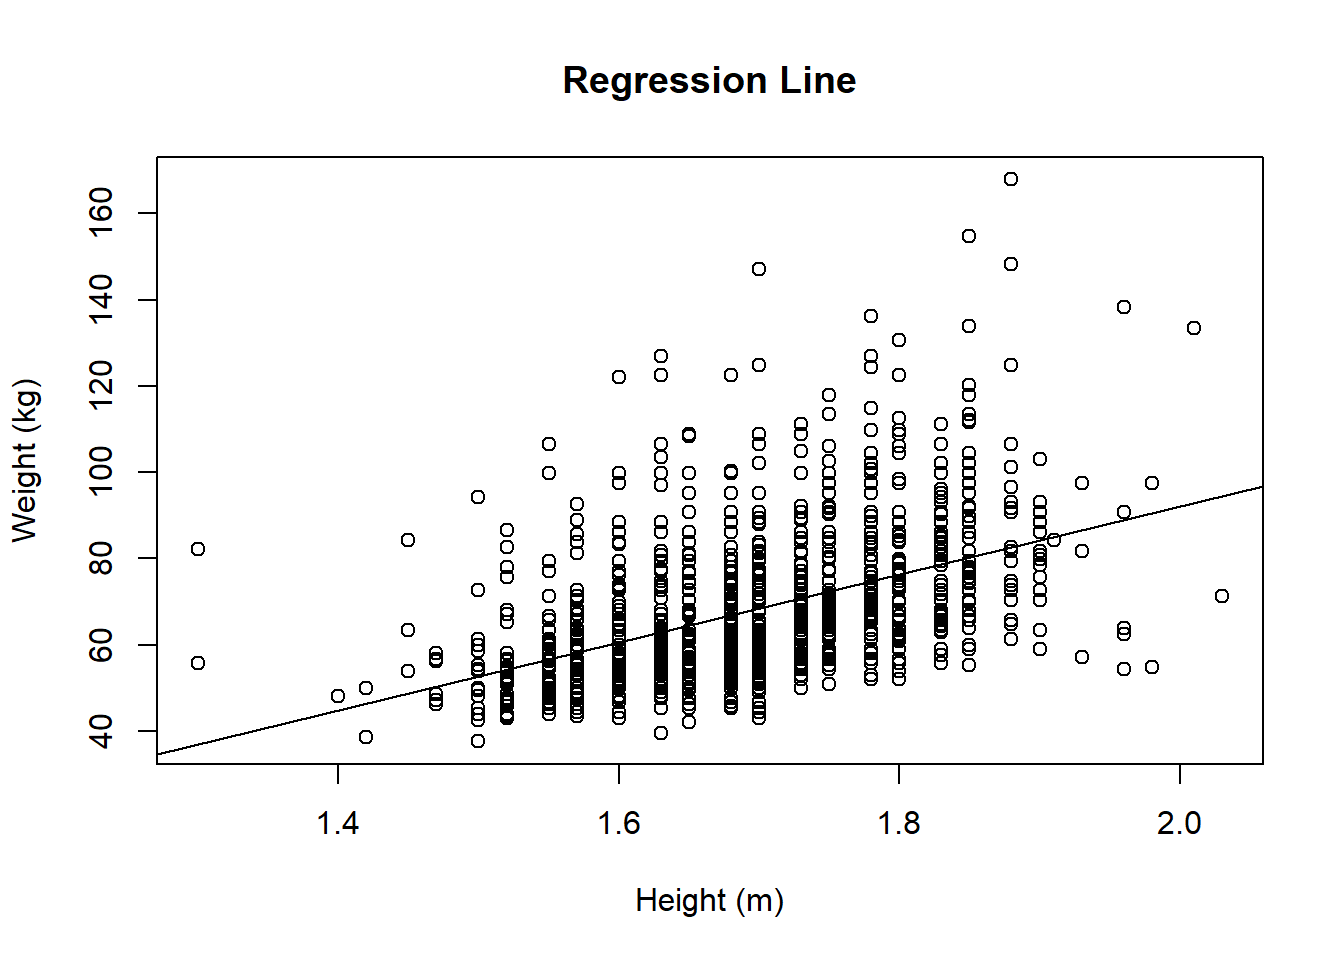
To add a smoother that is not constrained to be linear instead of a line use lines() and smooth.spline().
# Add a smoother instead of a line
plot(mydat$stheight, mydat$stweight,
     xlab = "Height (m)", ylab = "Weight (kg)",
     main = "Smoother")

# Must remove missing data to use smooth.spline()
SUB <- !is.na(mydat$stheight) & !is.na(mydat$stweight)
lines(smooth.spline(mydat$stheight[SUB], mydat$stweight[SUB]),
      col = "red", lwd = 2)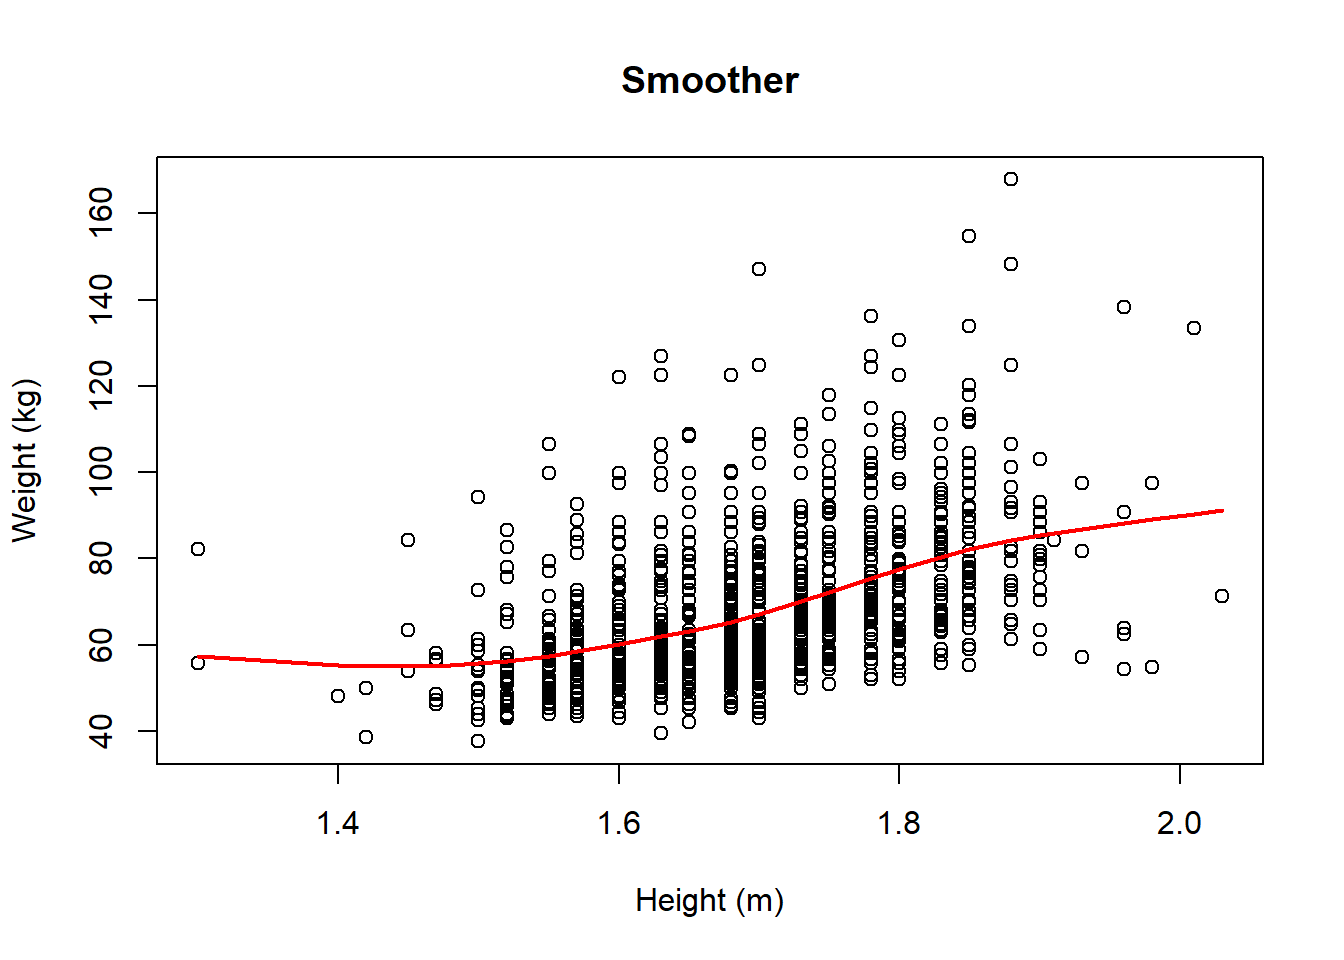
# Add both a line and a smoother
plot(mydat$stheight, mydat$stweight,
     xlab = "Height (m)", ylab = "Weight (kg)",
     main = "Smoother and Regression Line")

# Fit regression
reg.fit <- lm(stweight ~ stheight, data = mydat)

# Add regression line
abline(reg.fit, col = "blue", lwd = 2)

# Add smoother
SUB <- !is.na(mydat$stheight) & !is.na(mydat$stweight)
lines(smooth.spline(mydat$stheight[SUB], mydat$stweight[SUB]),
      col = "red", lwd = 2)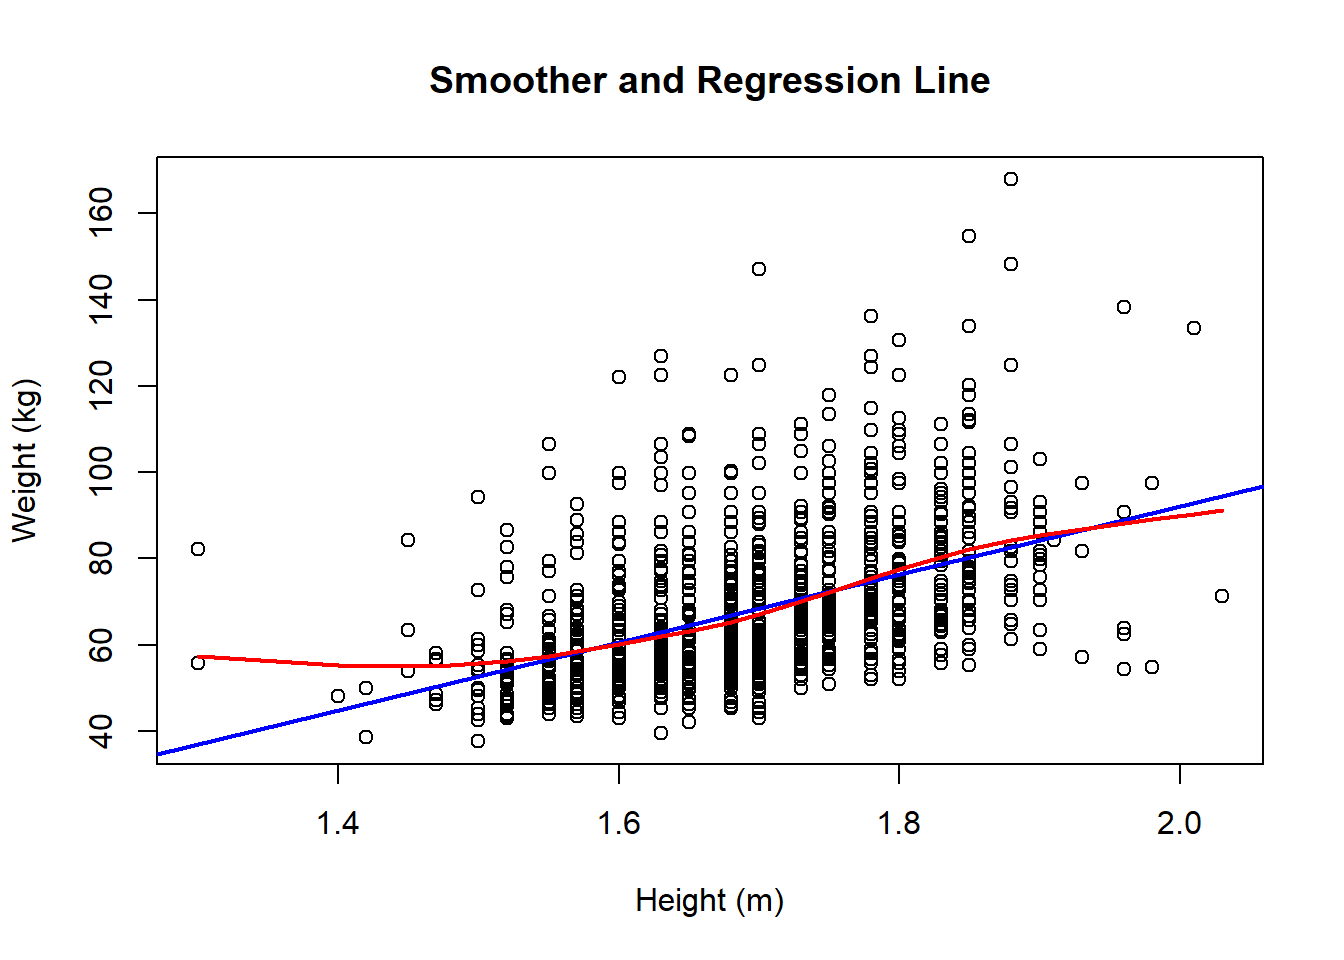
6.6.2 ggplot
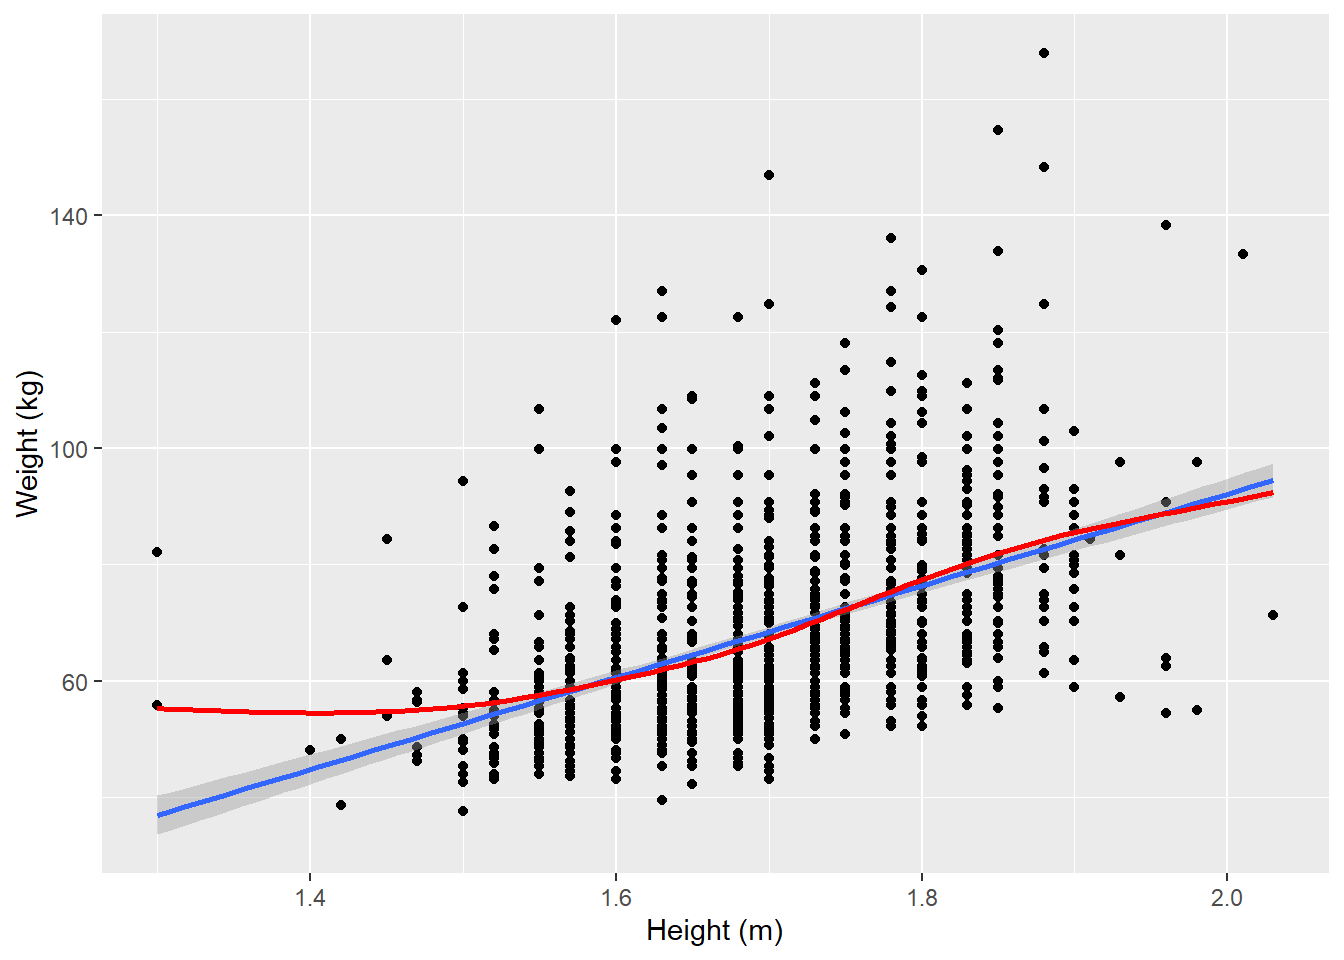
In ggplot(), use geom_points() to plot points and geom_smooth() to plot the regression line. It is very easy to add a confidence band for the regression line, as well, by adding se = TRUE.
mydat %>%
  ggplot(aes(x = stheight, y = stweight)) +
  geom_point() +
  # method = "lm" assumes the formula is y ~ x
  geom_smooth(method = "lm", se = TRUE) +
  labs(x = "Height (m)", y = "Weight (kg)")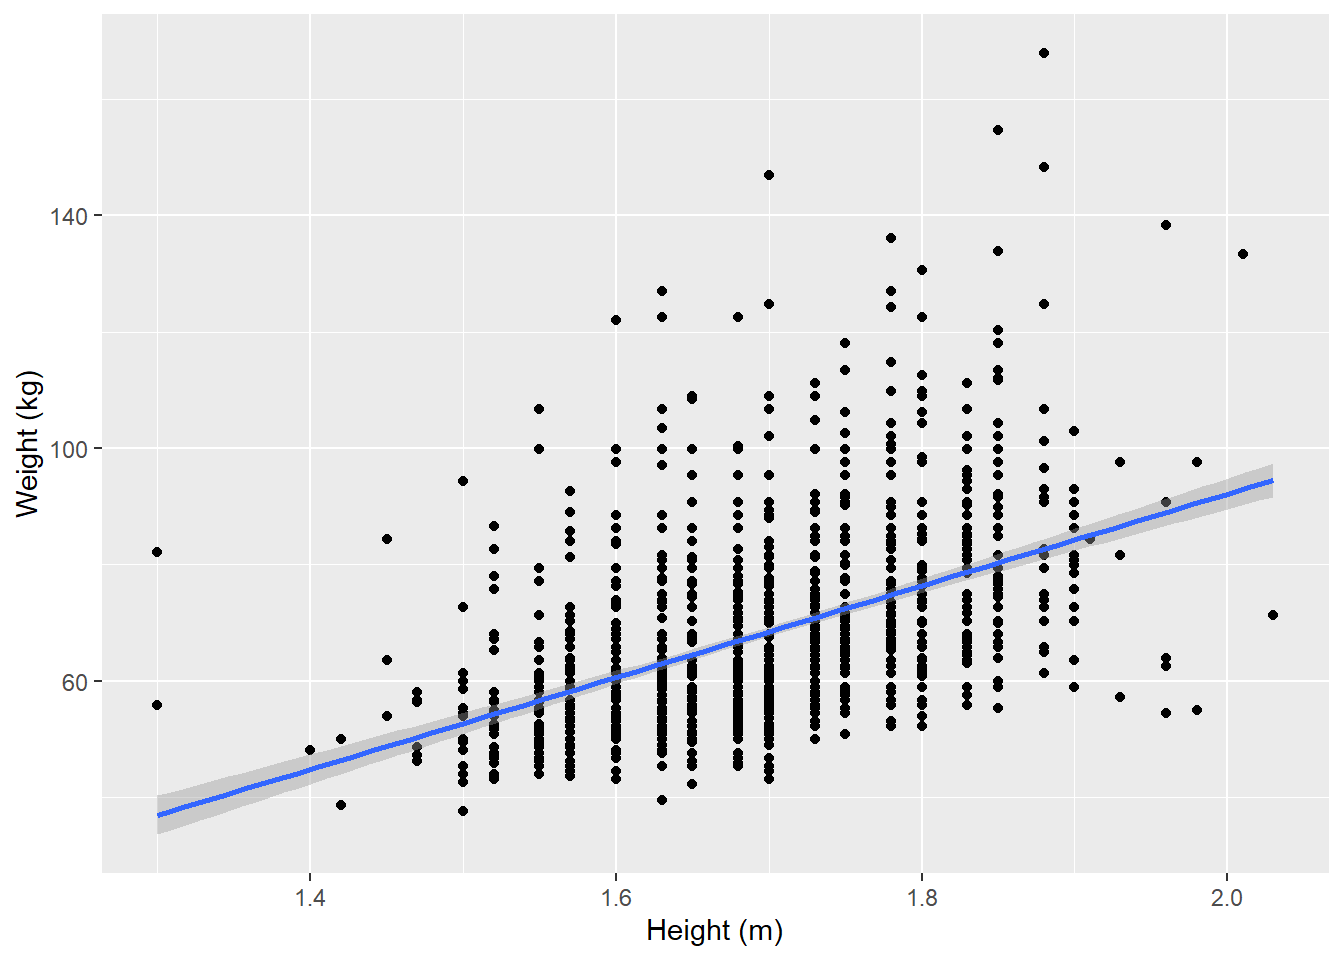
Alternatively, you can add a smoother by changing the arguments inside geom_smooth().
# Add a smoother instead of a line
mydat %>%
  ggplot(aes(x = stheight, y = stweight)) +
  geom_point() +
  # stat = "smooth" assumes the formula is y ~ smooth function of x
  geom_smooth(stat = "smooth", se = TRUE) +
labs(x = "Height (m)", y = "Weight (kg)") 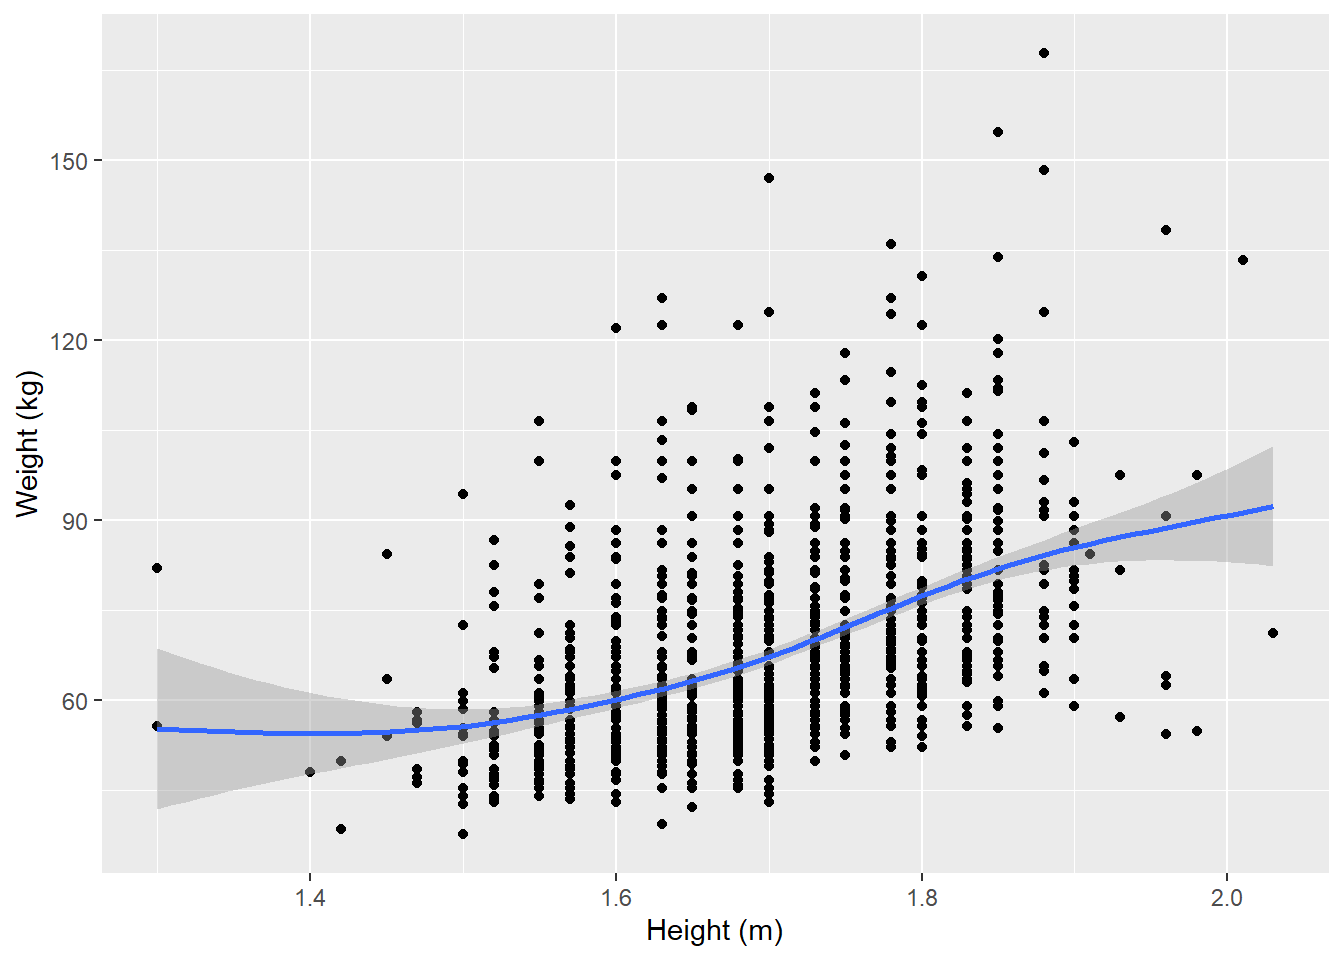
Or you can add both the linear regression line and a smoother (only the new part of the code shown).