6.3 Continuous: Boxplot
A boxplot is another great choice for visualizing the distribution of a continuous variable.
6.3.1 Base R
The following code uses boxplot() to produce a vertical and a horizontal boxplot.
par(mfrow=c(1,2))

# Vertical boxplot
boxplot(mydat$ln_weight,
        ylab = "ln(Weight)",
        main = "Vertical Boxplot")

# Horizontal boxplot
# Use xlab instead of ylab here
boxplot(mydat$ln_weight,
        horizontal = T,
        xlab = "ln(Weight)",
        main = "Horizontal Boxplot")
6.3.2 ggplot
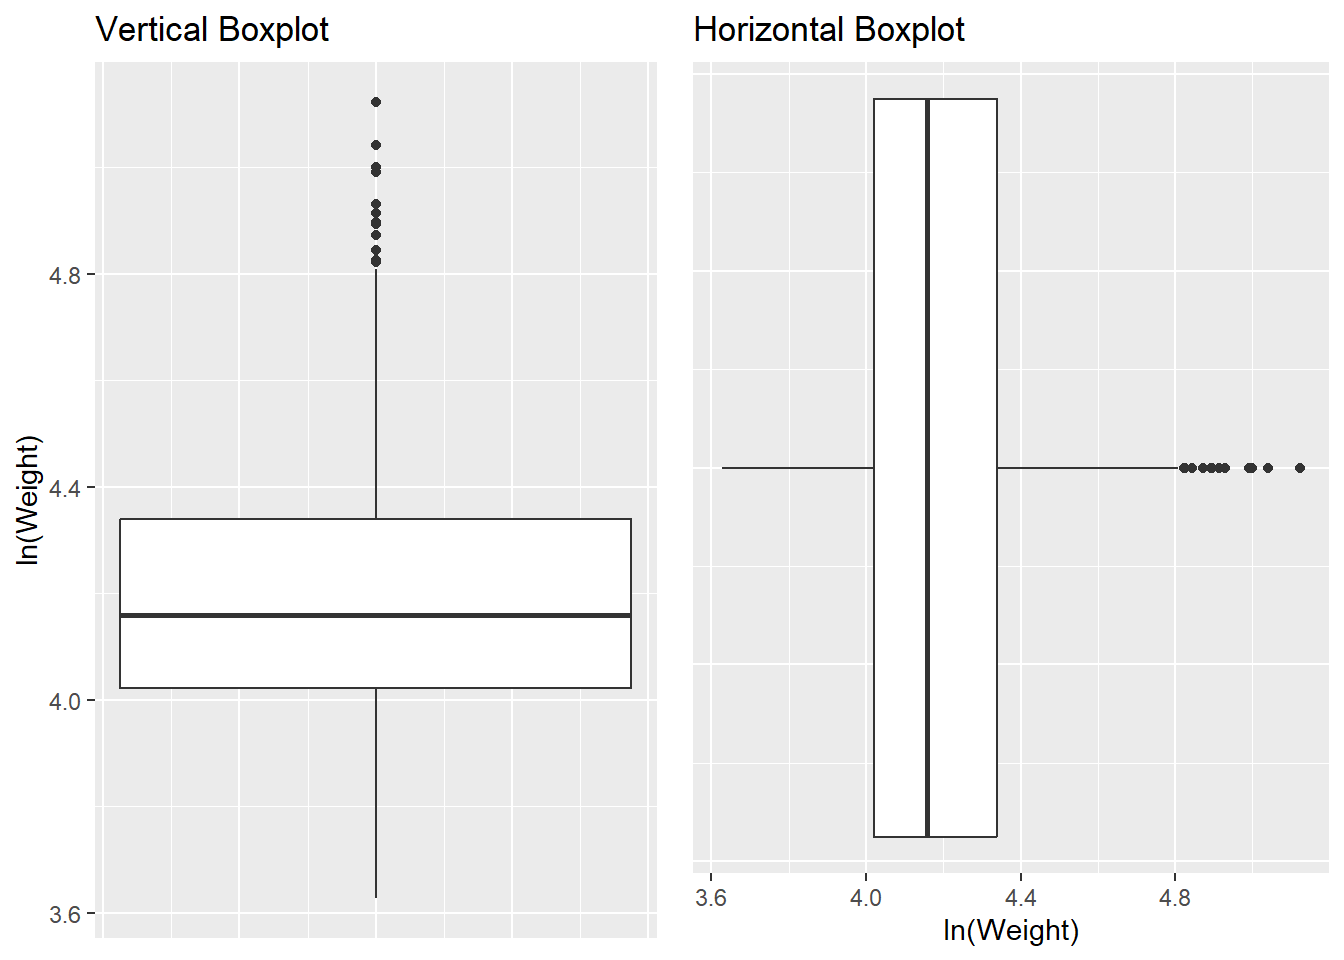
In ggplot(), use geom_boxplot() to create a boxplot. The following plots vertical and horizontal boxplots, and also demonstrates the use of ggtitle().
# Use y in aes and labs if you want a vertical boxplot
p1 <- mydat %>%
  ggplot(aes(y = ln_weight)) +
  geom_boxplot() +
  # Without these theme statements, there will be a meaningless x-axis
  theme(axis.text.x  = element_blank(),
        axis.ticks.x = element_blank()) +
  ggtitle("Vertical Boxplot") +
  labs(y = "ln(Weight)")

# Change the roles of x and y throughout if you want a horizontal boxplot
p2 <- mydat %>%
  ggplot(aes(x = ln_weight)) +
  geom_boxplot() +
  theme(axis.text.y  = element_blank(),
        axis.ticks.y = element_blank()) +
  ggtitle("Horizontal Boxplot") +
  labs(x = "ln(Weight)")

Rmisc::multiplot(p1, p2, cols = 2)