5.3 Reacting to Data: Refining Our Expectations
Okay, so the model and the data don’t match very well, as was indicated by the histogram above. So what to do? Well, we can either
Get a different model; or
Get different data
Or we could do both. What we do in response depends a little on our beliefs about the model and our understanding of the data collection process. If we felt strongly that the population of prices people would be willing to pay should follow a Normal distribution, then we might be less likely to make major modifications to the model. We might examine the data collection process to see if it perhaps led to some bias in the data. However, if the data collection process is sound, then we might be forced to re-examine our model for the population and see what could be changed. In this case, it’s likely that our model is inappropriate, especially given that it’s difficult to imagine a valid data collection process that might lead to negative values in the data (as the Normal distribution allows).
To close the loop here, we will choose a different statistical model to represent the population, the Gamma distribution. This distribution has the feature that it only allows positive values, so it eliminates the problem we had with negative values with the Normal distribution.
Now, we should go back to the top of our iteration and do the following:
Develop expectations: Draw a fake picture—what do we expect to see before looking at the data?
Compare our expectations to the data
Refine our expectations, given what the data show
For your reference, here is a histogram of the same data with the Gamma distribution (estimated using the data) overlaid.
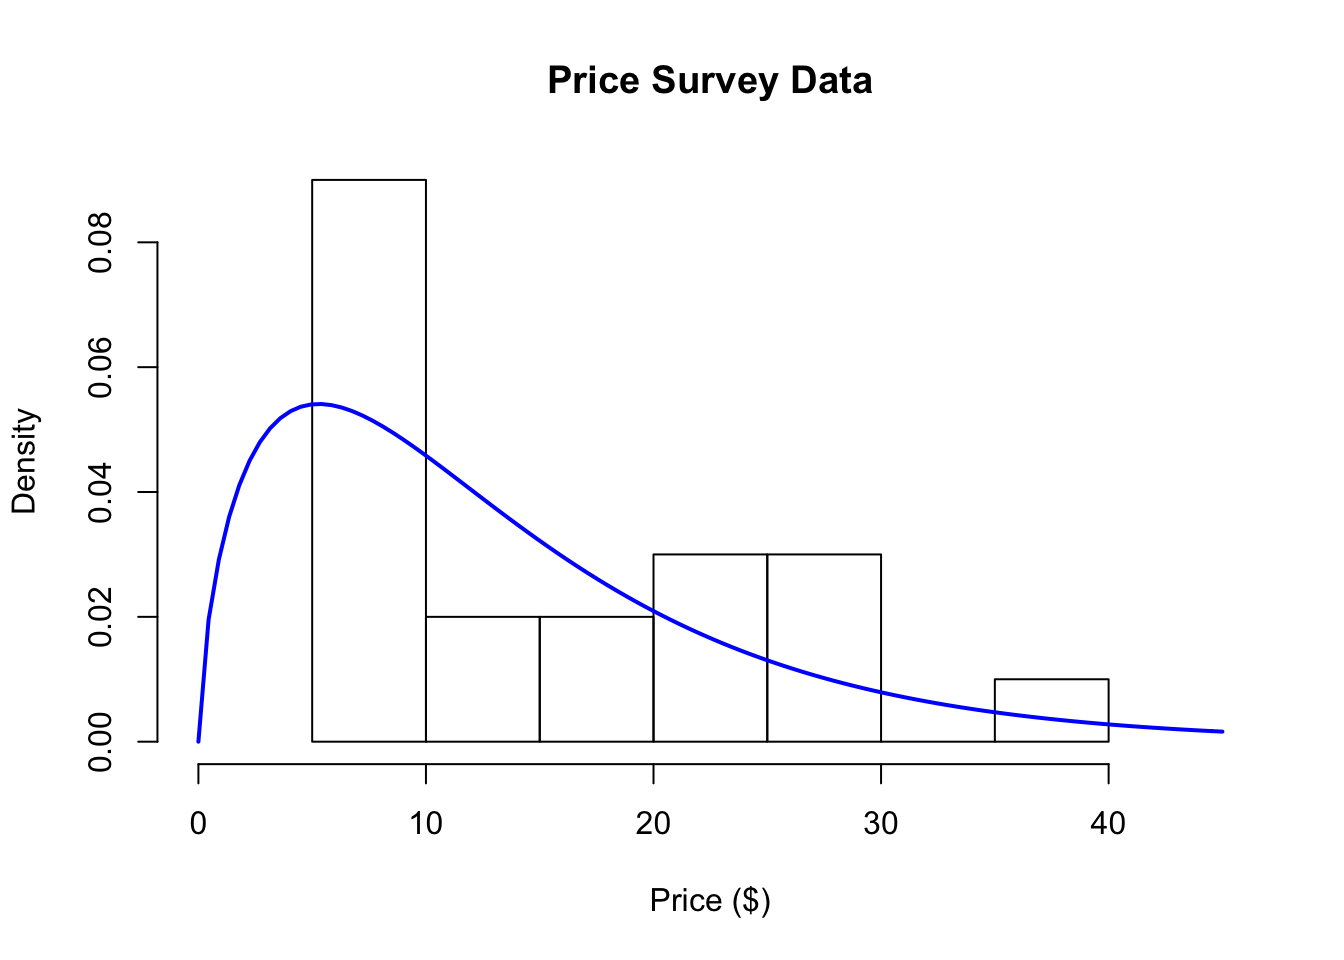
Figure 5.4: Price Survey Data with Gamma Distribution
How do the data match your expectations now?
You might ask what difference does it make which model I use to represent the population from which the data were generated? Well, for starters it might affect the kinds of predictions that you might make using the model. For example, recall before that were interested in what proportion of the population might be willing to pay at least $30 dollars for the book. Our new model says that only about 7% of the population would be willing to pay at least this amount (the Normal model claimed 11% would pay $30 or more). So different models can yield different predictions based on the same data, which may impact decisions made down the road.