6.4 A Quick Example
Consider this group of penguins below (because penguins are awesome), each wearing either a purple or turquoise hat. There are a total of 10 penguins in this group. We’ll call them the population.
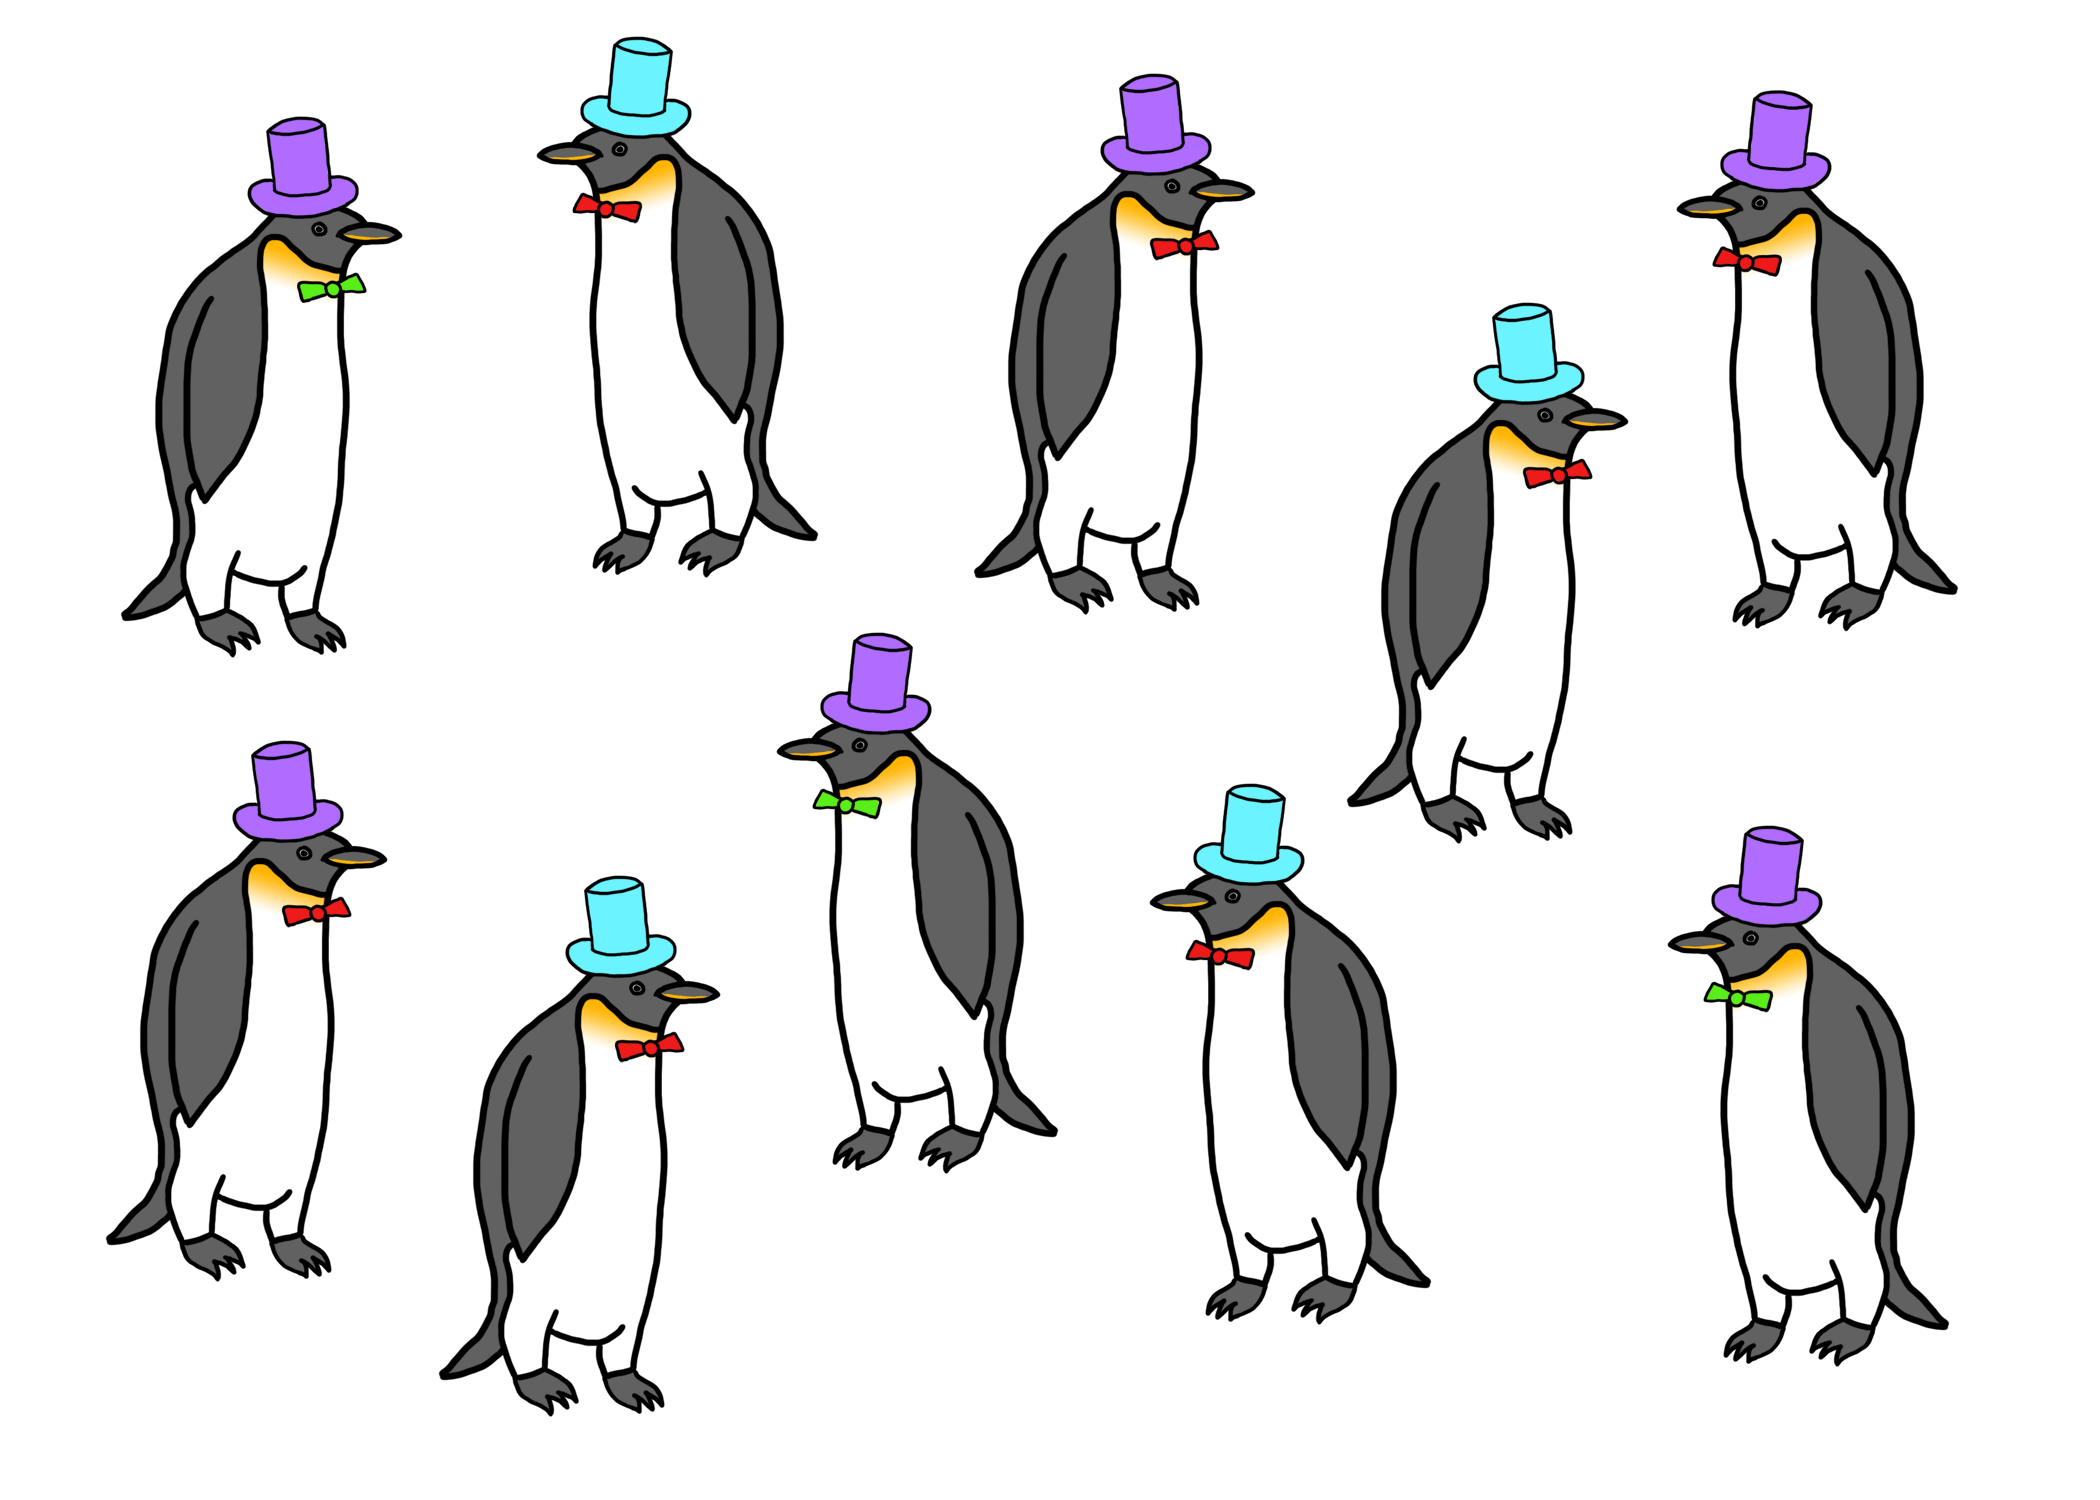
Population of Penguins with Turquoise and Purple Hats
Now suppose you wanted to know how what proportion of the population of penguins wears turquoise hats. But there’s a catch–you don’t have the time, money, or ability to take care of 10 penguins. Who does? You can only afford to take care of three penguins, so you randomly sample three of these 10 penguins.
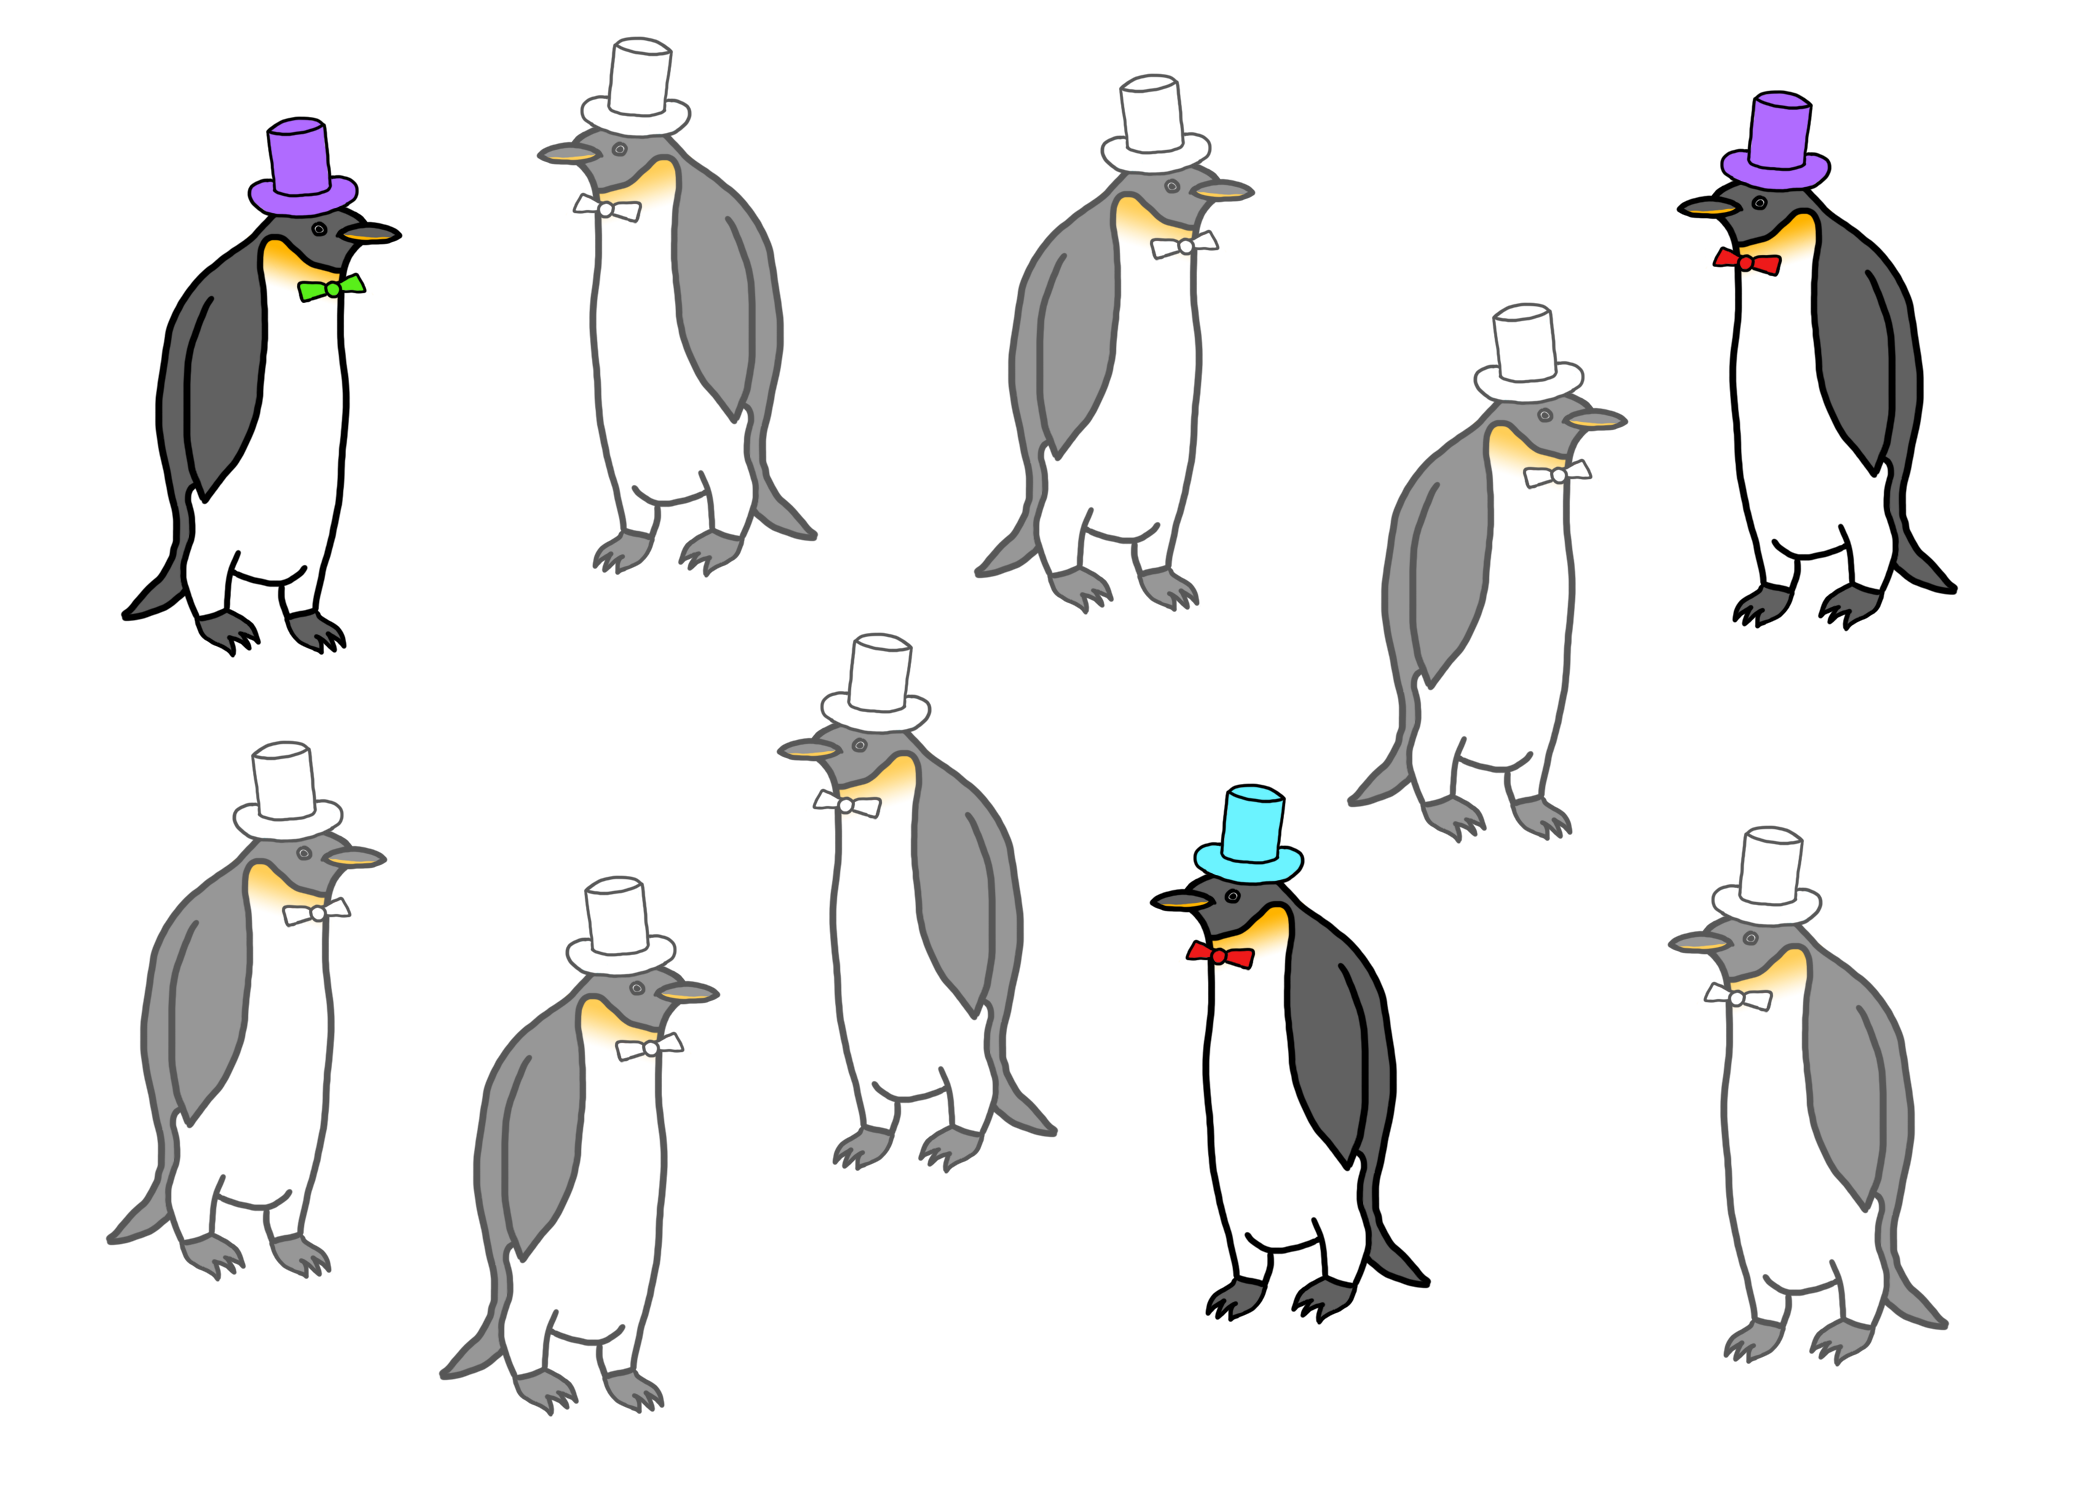
Sample of 3 Penguins from Population
The key point is that you never observe the full population of penguins. Now what you end up with is your dataset, which contains only three penguins.
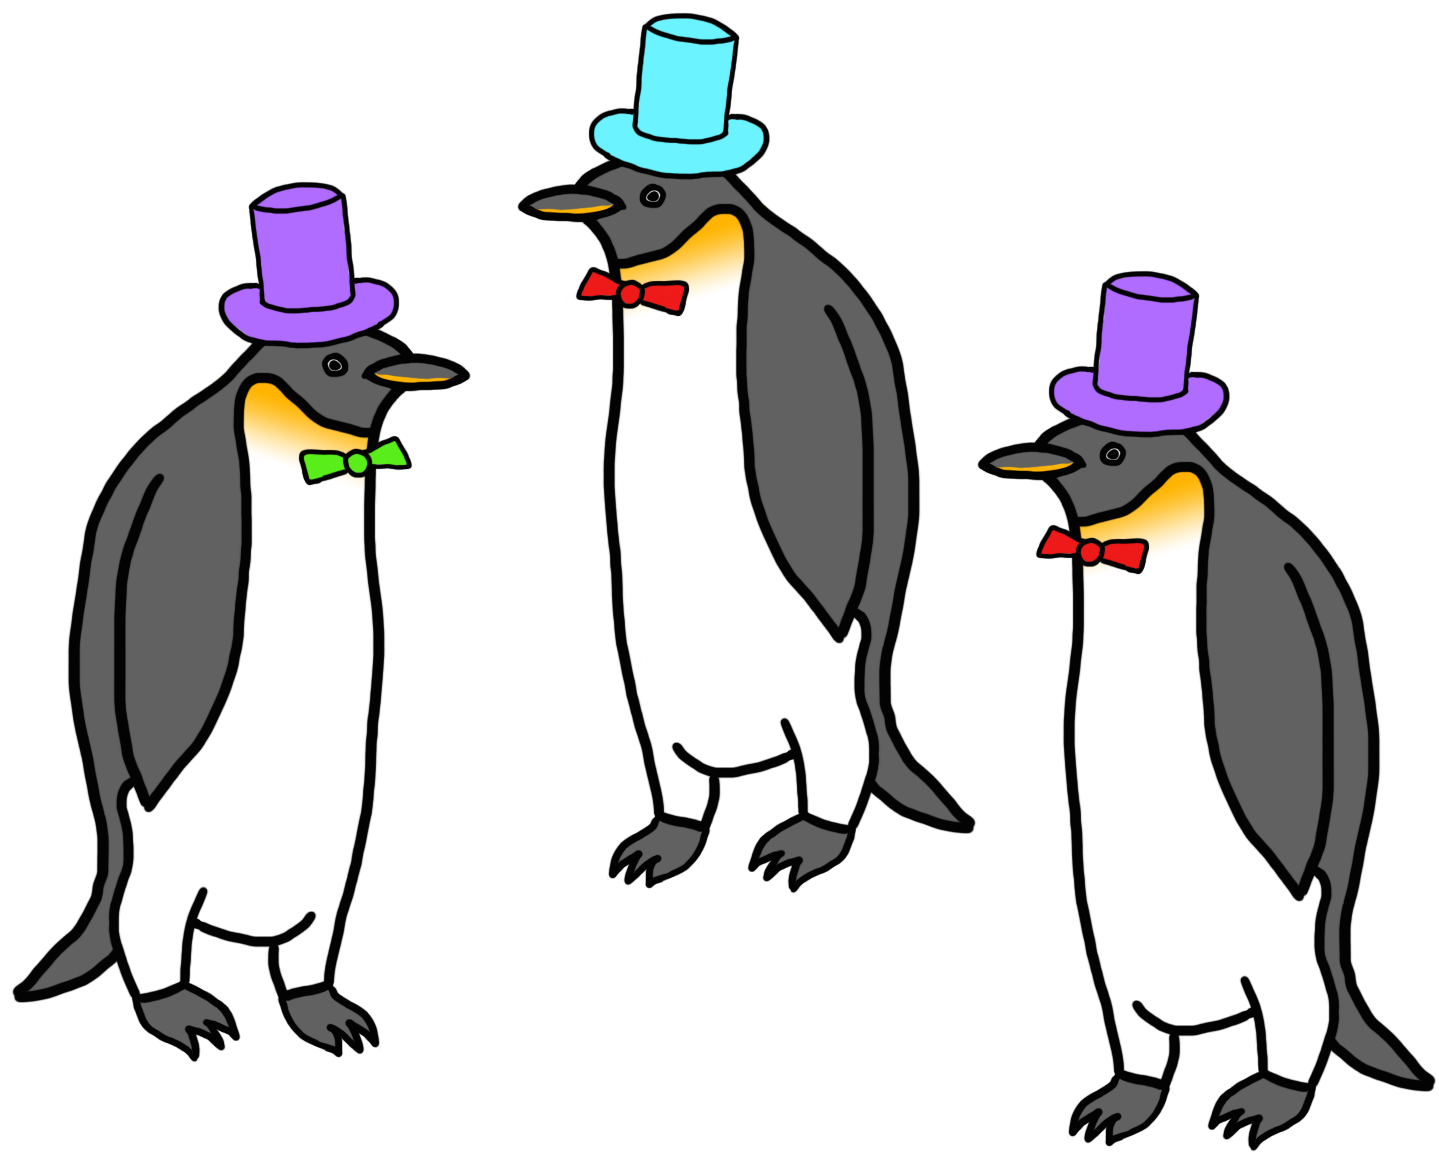
Dataset of Penguins
At this point an easy question to ask is “What proportion of the penguins in my dataset are wearing turquoise hats?”. From the picture above, it’s clear that 1/3 of the penguins are wearing turquoise hats. We have no uncertainty about that proportion because the data are sitting right in front of us.
The hard question to ask is “Based on the data I have, what proportion of the penguins in the original population are wearing turquoise hats?” At this point, we just have our sample of three penguins and do not observe the full population. What can we do? We need to make an inference about the population using the data we have on hand.
The three things that we need to do to make an inference are:
Define the population. Here, the population is the original 10 penguins from which we sampled our dataset of three penguins.
Describe the sampling process. We haven’t explicitly mentioned this, but suppose for now that our “sampling process” consisted of taking the first three penguins that walked up to us.
Describe a model for the population. We will assume that the hats the penguins wear are independent of each other, so the fact that one penguin has a purple hat doesn’t influence whether another penguin has a turquoise hat. Since we only want to estimate a simple proportion of penguins with turquoise hats, we don’t need to make any more complex assumptions about how penguins relate to each other.
Given the three ingredients above, we might estimate the proportion of penguins with turquoise hats to be 1/3. How good of an estimate is this? Given that we know the truth here–2/5 of the penguins have turquoise hats in the population–we might ask whether 1/3 is a reasonable estimate or not. The answer to that question depends on a variety of factors that will be discussed in the next section.