8.3 Predicting the Outcome
Another strategy we could have taken is to ask, “What best predicts mortality in New York City?” This is clearly a prediction question and we can use the data on hand to build a model. Here, we will use the random forests modeling strategy, which is a machine learning approach that performs well when there are a large number of predictors. One type of output we can obtain from the random forest procedure is a measure of variable importance. Roughly speaking, this measure indicates how important a given variable is to improving the prediction skill of the model.
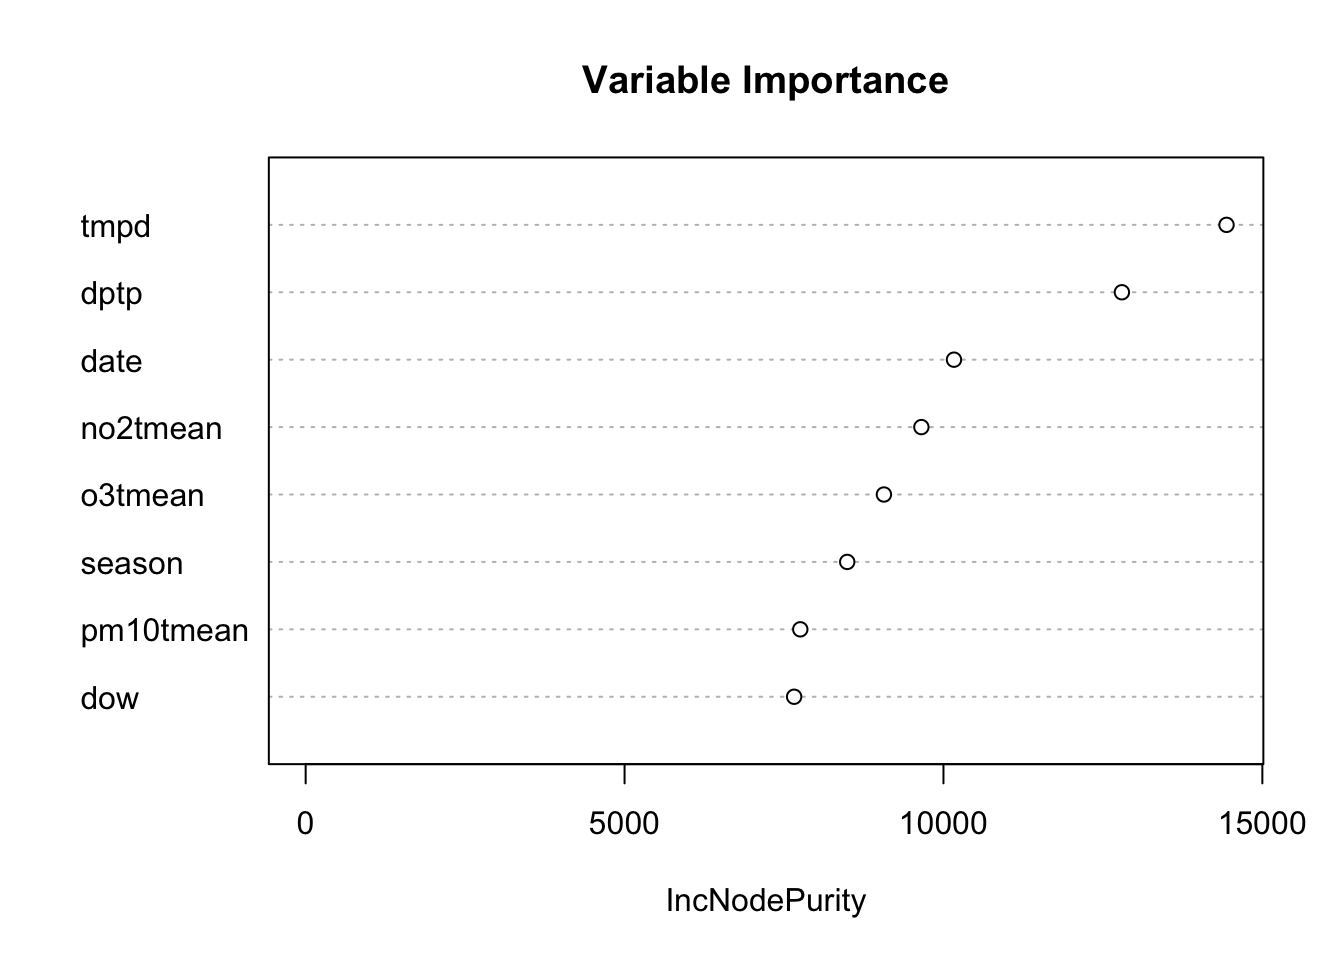
Below is a variable importance plot, which is obtained after fitting a random forest model. Larger values on the x-axis indicate greater importance.

Figure 5.6: Random Forest Variable Importance Plot for Predicting Mortality
Notice that the variable pm10tmean comes near the bottom of the list in terms of importance. That is because it does not contribute much to predicting the outcome, mortality. Recall in the previous section that the effect size appeared to be small, meaning that it didn’t really explain much variability in mortality. Predictors like temperature and dew point temperature are more useful as predictors of daily mortality. Even NO2 is a better predictor than PM10.
However, just because PM10 is not a strong predictor of mortality doesn’t mean that it does not have a relevant association with mortality. Given the tradeoffs that have to be made when developing a prediction model, PM10 is not high on the list of predictors that we would include–we simply cannot include every predictor.