5.1 Models as Expectations
But a simple summary statistic, such as the mean of a set of numbers, is not enough to formulate a model. A statistical model must also impose some structure on the data. At its core, a statistical model provides a description of how the world works and how the data were generated. The model is essentially an expectation of the relationships between various factors in the real world and in your dataset. What makes a model a statistical model is that it allows for some randomness in generating the data.
5.1.1 Applying the normal model
Perhaps the most popular statistical model in the world is the Normal model. This model says that the randomness in a set of data can be explained by the Normal distribution, or a bell-shaped curve. The Normal distribution is fully specified by two parameters—the mean and the standard deviation.
Take the data that we described in the previous section—the amount of money 20 people were willing to pay for a hypothetical new product. The hope is that these 20 people are a representative sample of the entire population of people who might purchase this new product. If that’s the case, then the information contained in the dataset can tell you something about everyone in the population.
To apply the Normal model to this dataset, we just need to calculate the mean and standard deviation. In this case, the mean is $17.2 and the standard deviation is $10.39. Given those parameters, our expectation under the Normal model is that the distribution of prices that people are willing to pay looks something like this.
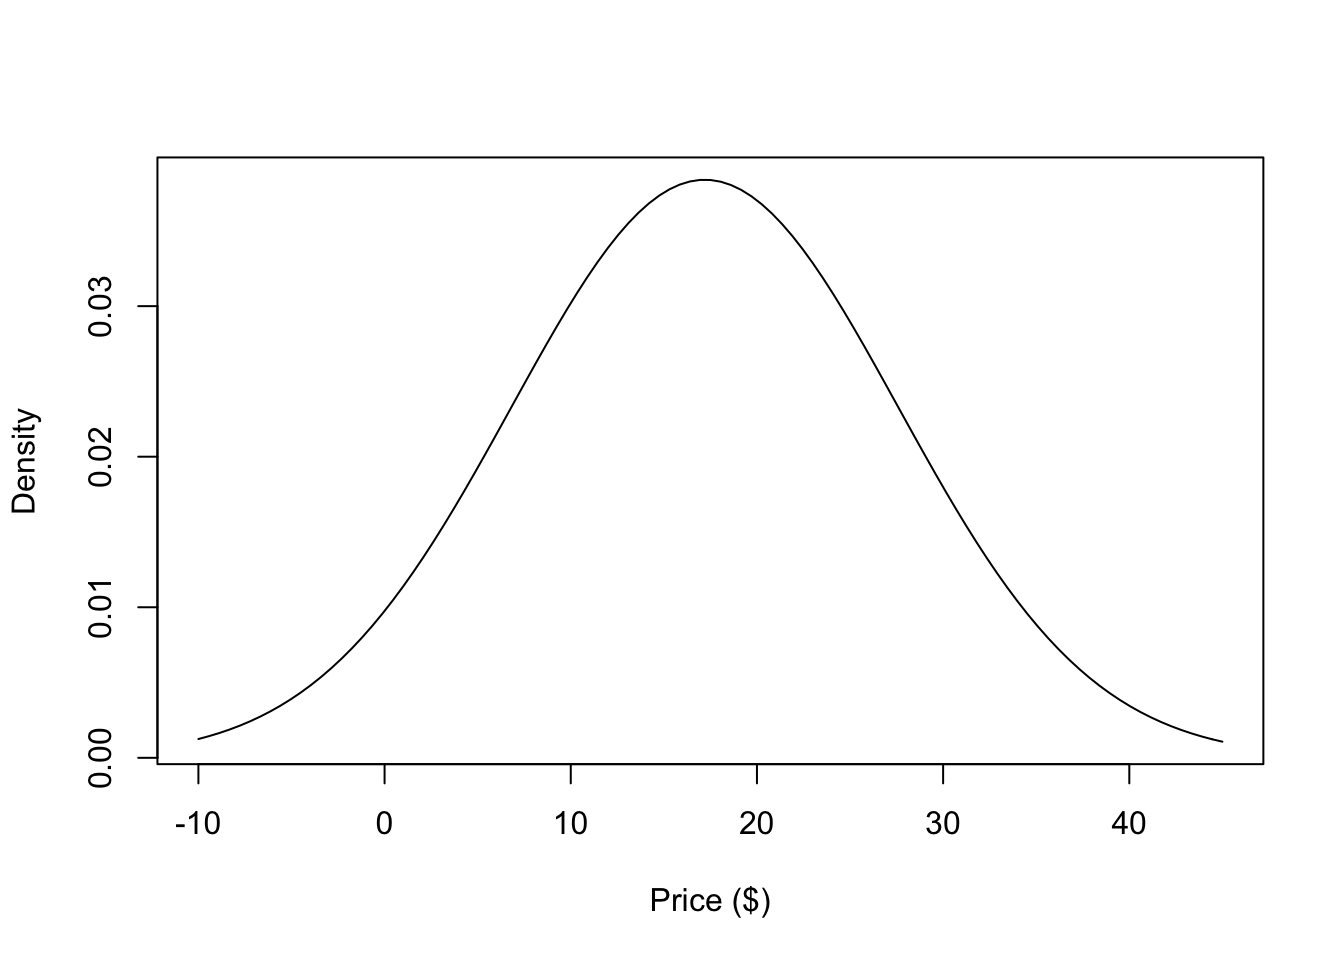
Figure 5.1: Normal Model for Prices
According to the model, about 68% of the population would be willing to pay somewhere between $6.81 and $27.59 for this new product. Whether that is useful information or not depends on the specifics of the situation, which we will gloss over for the moment.
You can use the statistical model to answer more complex questions if you want. For example, suppose you wanted to know “What proportion of the population would be willing to pay more than $30 for this book?” Using the properties of the Normal distribution (and a little computational help from R), we can easily do this calculation.
pnorm(30, mean = mean(x), sd = sd(x), lower.tail = FALSE)[1] 0.1089893So about 11% of the population would be willing to pay more than $30 for the product. Again, whether this is useful to you depends on your specific goals.
Note that in the picture above there is one crucial thing that is missing—the data! That’s not exactly true, because we used the data to draw the picture (to calculate the mean and standard deviation of the Normal distribution), but ultimately the data do not appear directly in the plot. In this case we are using the Normal distribution to tell us what the population looks like, not what the data look like.
The key point here is that we used the Normal distribution to setup the shape of the distribution that we expect the data to follow. The Normal distribution is our expectation for what the data should look like.