13.3 Basics
- Observations of units below cutoff: We observe outcome under control condition
- Observations of units above cutoff: We observe outcome under treatment condition
- Below plots the average potential outcomes given the score, \(E[Y_{i}(1)|X_{i} = x]\) and \(E[Y_{i}(0)|X_{i} = x]\), against the score
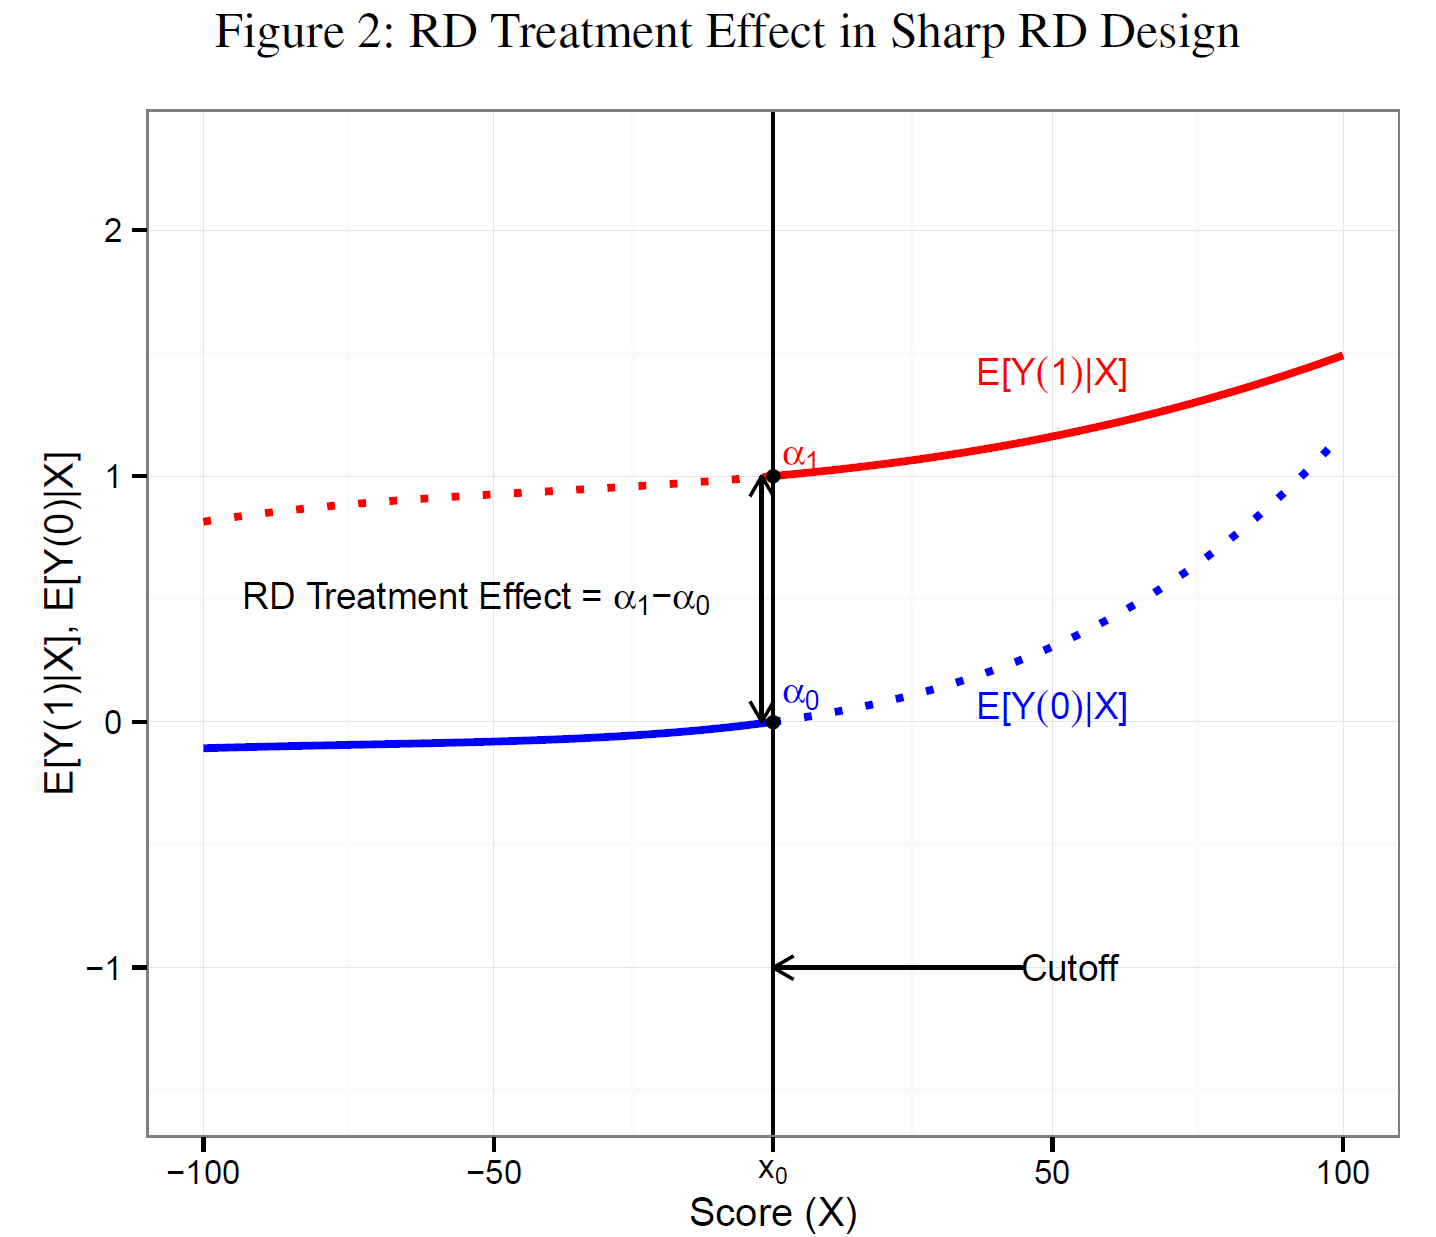
Skovron & Titiunik 2015, Fig. 2, p.6
- Regression function \(E[Y_{i}(1)|X_{i}]\) is observed for values of the score to the right of the cutoff-because when \(X \geq x_{0}\), the observed outcome \(Y_{i}\) is equal to the potential outcome under treatment, \(Y_{i}(1)\), for every \(i\)
- Same is true for \(E[Y_{i}(0)|X_{i}]\) for values left to the cutoff
- Sharp RD treatment effect: Difference between limits of the treated and control average observed outcomes as the score converges to x0 is equal to the average treatment effect at x0
- …there are two approaches to estimating the “causal effect” that rest on different assumptions.