11.9 Exercise: Problem of
- Mostly ignored issue (e.g., P. C. Bauer 2018): If we don’t have exact time stamps for treatment (change) occurence we basically do not know…
- …whether D occurs before or after Y (another implicit assumption)
- …when change in D and Y occur
- Q: Check out Figure 11.1 below. It visualizes data for a single unit, Peter. We have data for a treatment variable D = victimization (0,1) and an outcome variable Y = trust (0,10). The graph only displays the scale of the treatment variable, however, Peter’s values of trust are 7 in 2005 and 2 in 2006 (blue dots!).
- What aspects/problems does that graph empasize? What do we observe, what don’t we observe? Given the data in the graph, what control unit would we like to compare Peter to? (Hint: Trust value? Peter or someone else? What about pre-treatment covariates values?)44
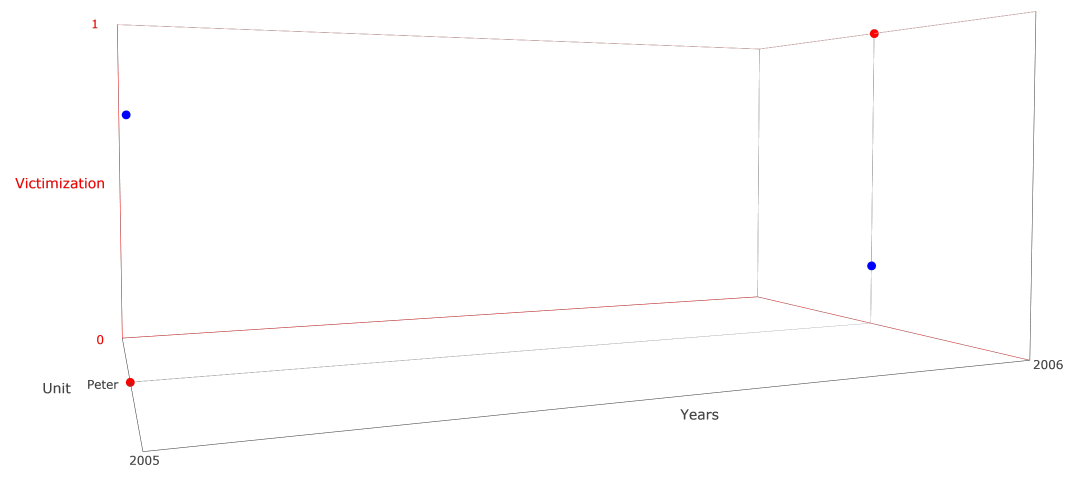
Figure 11.1: Assumptions
- What aspects/problems does that graph empasize? What do we observe, what don’t we observe? Given the data in the graph, what control unit would we like to compare Peter to? (Hint: Trust value? Peter or someone else? What about pre-treatment covariates values?)44
References
Bauer, Paul C. 2018. “Visualizing Causal Scenarios and Planned | Realized Measurements [Interactively].” Working Paper Presented at Various Conferences, Available Online at SSRN, 1–32.
Lessons: (1) Always try to think of the idea that units are randomly assigned to treatment/control, i.e. are randomly victimized between t0 and t1. Control group in classic FE/FD estimation is built from all unit*time observations where treatment did not occur (this could be Peter if he wasn’t victimized in certain waves but also all other units given that they don’t have been victimized in certain time points/waves). (2) Normally we would seek comparison units/observations that differ only in treatment change but have exactly the same trajectory on other variables beforehand (also the outcome).↩