11.15 Lab2
11.15.1 Study
We’ll use Bauer (2015) again.
Treatment: Victimization
Outcome: Generalized Social Trust
Identification strategy: Fixed effects/First differences/Temporal data
11.15.2 Data
Same data as we used previously. See below for how to load the data into R.
11.15.3 R-Code
11.15.3.1 Load data
We already used that data to estimate the effect of victimization on social trust using a classic control strategy assuming selection-on-observables (regression and matching).
We have to modify the data a bit (something you might have to do as well):
data <- readr::read_csv(sprintf("https://docs.google.com/uc?id=%s&export=download", "1kAfm2LI7s_9b0txgmsVdZmrXoFlfJ5aJ"))

# Add separator
names(data) <- gsub("20", ".20", names(data))

# From wide to longformat
data <- data %>% pivot_longer(-idpers, names_to = "variable", values_to = "value") %>%
      separate(col = "variable", into = c("variable", "time"), sep = "\\.") %>%
      pivot_wider(names_from = variable, values_from = value)

# Further preparations for PanelMatch package
data <- data %>% mutate(time = as.integer(time), # Converting time variable
                        unit = as.integer(idpers)) %>% # Add unit index
                 dplyr::select(-idpers) %>% # delete variable
                 dplyr::select(unit, time, everything()) # Reorder variables

# Dataframe format
data <- data.frame(data)
Q: What stable and/or unstable phenomena are there that could influence both D (victimization) and Y (trust)?
11.15.3.2 Pooled data & model
We start with a pooled model in Table 11.22 (pooling = throwing all units/timepoints together).
# Fit a pooled model (all together)
fit.pooled.lm <- lm(trust ~ threat + male + income +
                      education + age,
                    data = data)
stargazer(fit.pooled.lm,
          type = "html", no.space = TRUE,
          single.row = TRUE,
title = "(#tab:model-pooled)Linear models based on pooled data (ignoring time and panel structure)")| Dependent variable: | |
| trust | |
| threat | -0.604*** (0.053) |
| male | -0.277*** (0.036) |
| income | 0.009 (0.018) |
| education | 0.131*** (0.006) |
| age | 0.007*** (0.001) |
| Constant | 5.436*** (0.057) |
| Observations | 18,044 |
| R2 | 0.050 |
| Adjusted R2 | 0.050 |
| Residual Std. Error | 2.166 (df = 18038) |
| F Statistic | 190.707*** (df = 5; 18038) |
| Note: | p<0.1; p<0.05; p<0.01 |
11.15.3.3 Examining treatment trajectories
Then we visualize treatment status across units in Figure 11.8, across time in order to grasp which observations are available to construct our treatment and control groups. Figure 11.8 suggests that we have far less treatment observations (periods during which people have been victimized) than control observations. Figure 11.8 also suggests that many of the treated units were repeatedly treated (see the red trajectories):
library(PanelMatch)
DisplayTreatment(unit.id = "unit",
                 time.id = "time",
                 legend.position = "none",
                 xlab = "year",
                 ylab = "Individual id",
                 treatment = "threat",
                 data = data,
                 dense.plot = TRUE,
                 hide.x.axis.label = FALSE, # keep because not too many time points
                 hide.y.axis.label = TRUE) # don't keep because too many units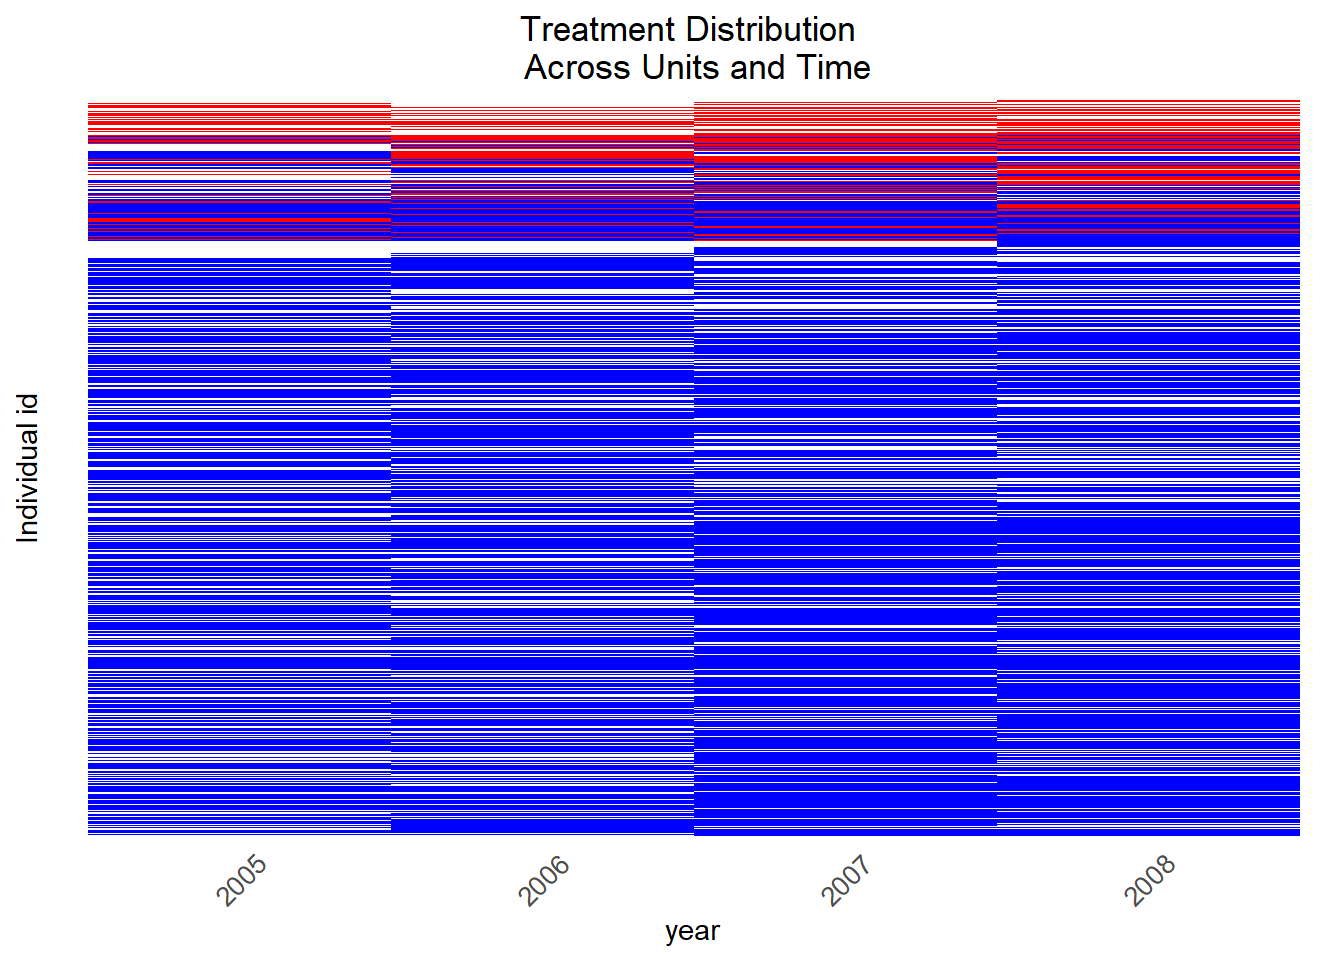
Figure 11.8: Visualization of treated observations across time, across units
We can calculate how many unique units and time points there are in our dataset with the code below. Importantly, this does not mean that we observed these units across all those time periods.
## [1] 23243## [1] 4Naturally, since our panel is not balanced (we do not observe all units across all time points no the variables of interest), the dataset we can actually use for the estimation is far smaller.
11.15.3.4 No refinement & exact matching
We’ll start without any refinement or exact matching of control observations. Figure 11.9 displays the matched control units for one treated observation.
PM_results_none <- PanelMatch(lag = 1, time.id = "time", unit.id = "unit",
                         treatment = "threat", refinement.method = "none",
                         data = data, match.missing = TRUE,
                         size.match = 1, qoi = "att", outcome.var = "trust",
                         lead = 0, forbid.treatment.reversal = FALSE,
                         use.diagonal.variance.matrix = TRUE)
msets_none <- PM_results_none$att

PE_results <- PanelEstimate(sets = PM_results_none, data = data)
summary(PE_results)
## Matches created with 1 lags
##
## Standard errors computed with 1000 Weighted bootstrap samples
##
## Estimate of Average Treatment Effect on the Treated (ATT) by Period:## $summary
## estimate std.error 2.5% 97.5%
## t+0 -0.1133613 0.05435943 -0.2141251 -0.005091465
##
## $lag
## [1] 1
##
## $iterations
## [1] 1000
##
## $qoi
## [1] "att"DisplayTreatment(unit.id = "unit",
time.id = "time",
legend.position = "none",
xlab = "year",
ylab = "Individual id",
treatment = "threat",
data = data,
dense.plot = TRUE,
hide.x.axis.label = FALSE, # keep because not too many time points
hide.y.axis.label = TRUE,
matched.set = msets_none[1])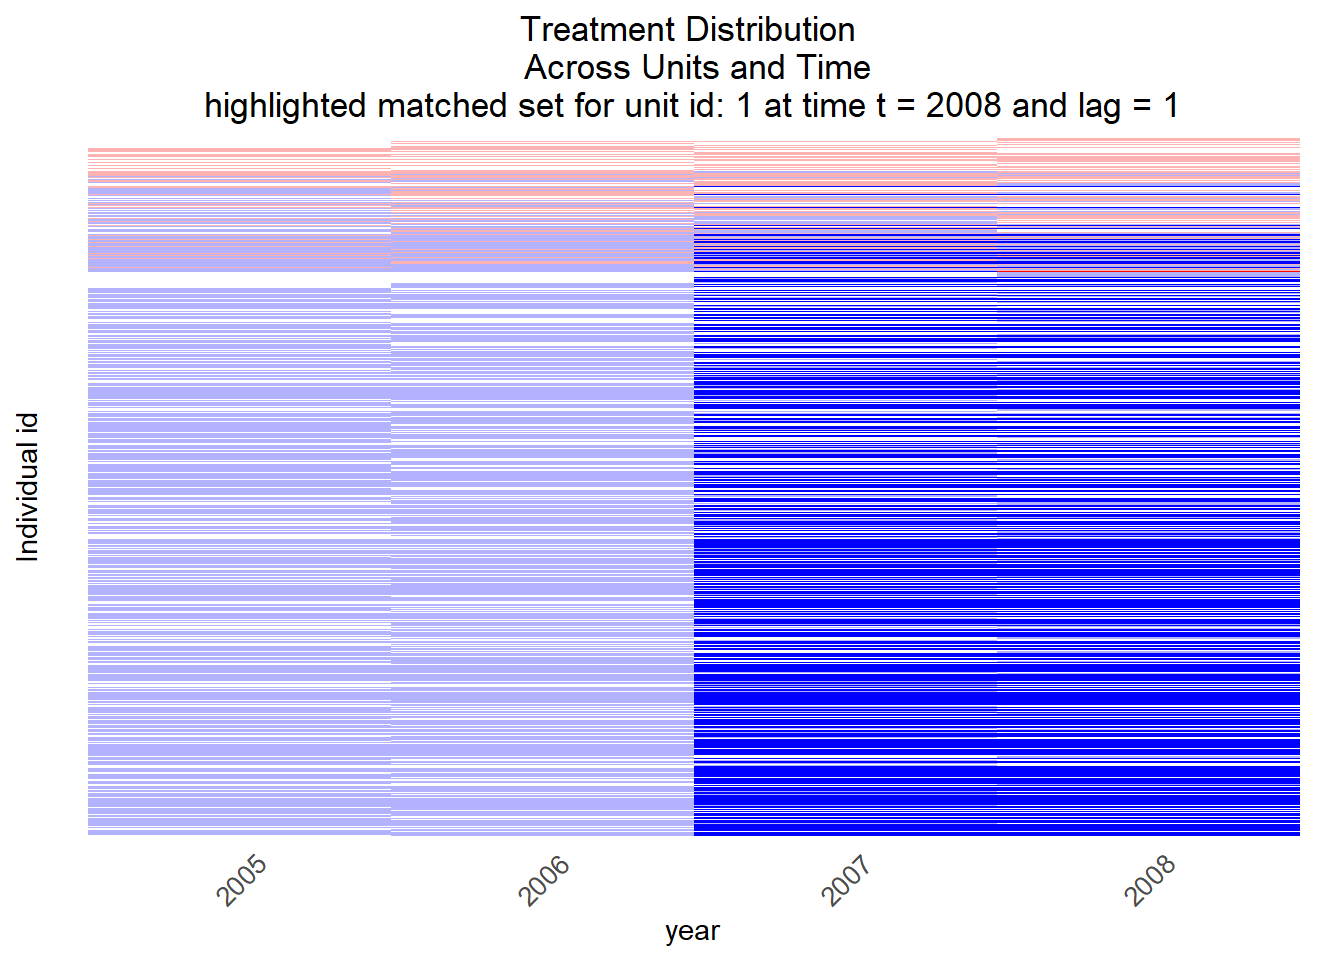
Figure 11.9: Visualization of control units (for 1 treated unit)
Q: How would the number of control units for treated unit 1 in Figure 11.9 probably change when we increase the specified lag (1), when we add covariates on which we match (2) and when we use exact matching instead of some other distance measure (3)?
Normally, we would try to find covariates that have not been treated in the time period we focus on have similar trajectories on other variables. Here we resort to exact matching on the variables education, age, male and income(all are categorical so it makes sense here, in principle we could also match on the outcome variable trust).
PM_results_exact <- PanelMatch(lag = 3, time.id = "time", unit.id = "unit",
                         treatment = "threat",
                         refinement.method = "none", # no refinement method
                         exact.match.variables = c("education", "age", "male", "income"),
                         data = data,
                         match.missing = FALSE, # Turn on or off
                         covs.formula = ~ education + age + male + income,
                         size.match = 1, qoi = "att" , outcome.var = "trust",
                         lead = 0, forbid.treatment.reversal = FALSE,
                         use.diagonal.variance.matrix = TRUE)
msets_exact <- PM_results_exact$att
Figure 11.10, again, visualizes matched control units for treated unit 1.
DisplayTreatment(unit.id = "unit",
                 time.id = "time",
                 legend.position = "none",
                 xlab = "year",
                 ylab = "Individual id",
                 treatment = "threat",
                 data = data,
                 dense.plot = TRUE,
                 hide.x.axis.label = FALSE, # keep because not too many time points
                 hide.y.axis.label = TRUE,
                 matched.set = msets_exact[1])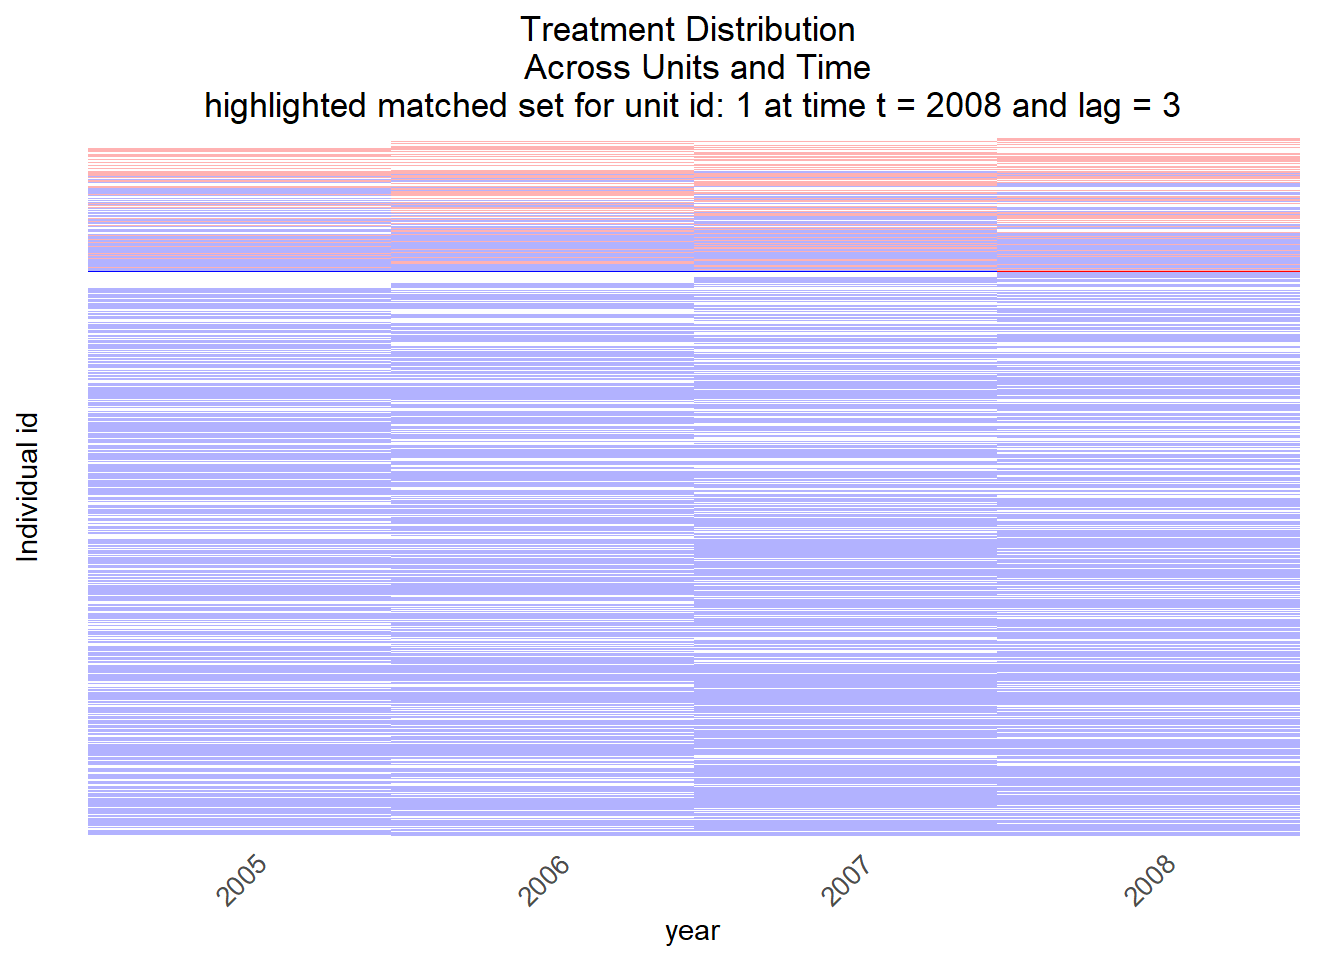
Figure 11.10: Visualization of control units (for 1 treated unit) after matching
Thereafter we check covariate balance:
get_covariate_balance(matched.sets = msets_exact,
                      data = data,
                      covariates = c("education", "age", "male", "income"),
plot = FALSE)| education | age | male | income | |
|---|---|---|---|---|
| t_3 | 0 | 0 | 0 | 0 |
| t_2 | 0 | 0 | 0 | 0 |
| t_1 | 0 | 0 | 0 | 0 |
| t_0 | 0 | 0 | 0 | 0 |
And check our final estimate:
PE_results <- PanelEstimate(sets = PM_results_exact, data = data)
#names(PE_results)
#PE_results[["estimates"]] # View the point estimates
summary(PE_results)
## Matches created with 3 lags
##
## Standard errors computed with 1000 Weighted bootstrap samples
##
## Estimate of Average Treatment Effect on the Treated (ATT) by Period:## $summary
## estimate std.error 2.5% 97.5%
## t+0 0.3925926 0.3299539 -0.2622315 1.06318
##
## $lag
## [1] 3
##
## $iterations
## [1] 1000
##
## $qoi
## [1] "att"The results seem to show that there is not effect (using the parameters chosen above, e.g. lag = 1, exact matching etc.)
References
Bauer, Paul C. 2015. “Negative Experiences and Trust: A Causal Analysis of the Effects of Victimization on Generalized Trust.” Eur. Sociol. Rev. 31 (4): 397–417.