Chapter 20 K-Means
Hello! Today, we’ll be learning about k-means, a clustering strategy. Clustering algorithms are a family of algorithms that are used to group observations based on their similarity to specific variables. Clustering is considered an unsupervised machine learning strategy because the computer is learning patterns from the variables, not from your interpretation of the variables.
K-means is a strategy that accepts continuous (numeric) variables. I have included a tutorial for how to use categorical variables when constructing a K-means model in R, but we’ll stick with continuous variables for this tutorial.
Let us first download our data (the pew survey) and load the packages! The main function we will use kmeans() is a base R function. However, factoextra is a package that is especially useful for visualizing and interpreting cluster analysis. It is used for a range of unsupervised strategies, including Principal Component Analysis, Hierarchical Clustering, and others. Learn more about factoextra in this sthda tutotial.
options(scipen=999)
library(tidyverse)
#install.packages("factoextra")
library(factoextra)

survey_data <- read_csv("data/pew_AmTrendsPanel_110_2022_revised.csv") %>%
  select(gun_bill_approval, perceived_party_difference, age, income, personal_fin)
#str(survey_data)
20.1 Data Cleaning/Wrangling
Importantly, k-means requires full observations to work. In other words, if you have any values that are NA, then kmeans() will not work. We can remove observations with an NA using na.omit(). (This is less relevant for our dataset, as we do not have NA values in this subset).
20.2 K Means Model
Now that we have our data, let us proceed with the k-means analysis! First, we’ll want to set the seed of our analysis (setting our seed makes it possible to replicate the data in the future). Then, we’ll use the kmeans() function. kmeans() takes at least 2 arguments: the data and the number of clusters (centers).
The goal of a k-means analysis is to minimize intra-cluster variation while maximizing inter-cluster variation. In other words, you want the observations in a cluster to be more similar with one another than they are similar to observations in other clusters.
set.seed(381)

k3 <- kmeans(survey_data, centers = 3)
print(k3) #this will also print out the results per observation too
## K-means clustering with 3 clusters of sizes 52, 250, 5872
##
## Cluster means:
## gun_bill_approval perceived_party_difference age income personal_fin
## 1 6.596154 59.653846 2.538462 5.038462 43.538462
## 2 3.348000 2.232000 6.192000 99.000000 4.852000
## 3 2.442439 1.475817 2.838215 4.865804 2.633515
##
## Clustering vector:
## [1] 3 3 3 3 3 3 3 3 3 3 3 3 3 3 3 3 3 3 3 3 3 3 3 3 3 3 3 2 3 3 3 3 3 3 3 2 3 3 3 3 2 3 3 3 3 3 3 3 3 3 2 3 3 3 2 2 3 3 3 3 1 3 3 3 3 3 3 2 3 3 2 3 3 3 3 3 3 3
## [79] 3 3 3 3 3 3 3 3 3 3 3 3 3 2 3 2 3 3 3 3 3 3 3 3 3 3 3 3 2 3 3 3 3 3 3 3 3 3 3 3 3 3 3 3 3 3 3 3 3 3 3 3 3 3 3 3 3 3 3 3 3 3 3 3 3 3 3 2 3 3 3 3 3 3 3 3 3 3
## [157] 3 3 3 3 3 3 3 3 3 3 3 3 3 3 3 3 3 3 3 3 3 3 3 3 3 3 3 3 3 3 3 3 3 3 3 3 3 3 3 3 3 3 3 3 3 3 3 3 3 3 3 3 3 3 3 3 3 2 3 3 3 3 3 3 3 3 3 3 3 3 3 3 3 3 3 3 3 3
## [235] 3 3 3 3 3 3 3 3 3 3 3 3 3 2 3 3 3 3 3 3 3 3 2 3 3 3 3 3 3 3 3 3 3 1 3 3 2 2 3 2 3 3 3 3 3 3 3 3 3 3 3 3 3 3 3 3 3 3 3 3 3 3 3 3 3 1 3 3 3 3 3 2 3 3 3 3 3 3
## [313] 3 3 3 3 3 3 3 3 3 3 3 3 3 3 3 3 3 3 3 3 3 3 3 3 3 3 3 3 3 3 3 3 3 3 3 3 3 2 3 3 3 3 3 3 3 3 3 3 3 3 3 3 3 3 3 3 3 3 3 3 3 3 3 3 3 3 3 3 3 3 3 3 3 3 3 3 3 3
## [391] 3 3 3 3 3 3 3 3 3 3 3 3 3 3 3 3 3 3 3 3 3 3 3 3 3 3 3 3 3 3 3 3 3 3 3 3 3 3 3 3 3 3 3 3 3 3 3 3 3 3 3 3 3 3 3 3 3 3 3 3 3 3 3 3 3 3 3 3 3 3 3 3 3 3 3 3 3 3
## [469] 3 3 3 3 3 3 3 3 3 3 3 3 3 3 3 3 3 3 3 3 3 3 3 3 3 3 3 3 3 3 3 3 3 3 3 3 3 3 3 3 3 3 3 3 3 3 3 3 3 3 3 3 3 3 3 3 3 3 3 3 3 3 2 3 3 3 3 3 3 3 3 3 3 3 3 3 3 3
## [547] 3 3 3 3 3 3 3 3 3 3 3 3 3 3 3 3 3 3 3 3 3 3 3 3 3 3 3 3 3 3 3 3 3 3 3 3 3 3 3 3 3 3 3 3 3 3 3 3 3 3 3 3 3 3 3 3 3 3 3 3 3 3 3 3 3 3 3 3 3 3 3 3 3 3 3 3 3 3
## [625] 3 3 3 3 3 3 3 3 3 3 3 3 3 3 3 3 3 3 3 3 3 3 3 3 3 3 3 3 3 3 3 3 3 3 3 3 3 3 3 3 3 3 3 3 3 3 3 3 3 3 3 3 3 3 3 3 3 3 3 3 3 3 3 3 3 3 3 3 3 3 3 3 3 3 3 3 3 3
## [703] 3 3 3 3 3 3 3 3 3 3 3 3 3 3 3 3 3 3 3 3 3 3 3 2 3 3 3 3 3 3 3 3 3 3 3 3 3 3 3 3 3 3 3 3 3 3 3 3 3 3 3 3 3 3 3 3 3 3 3 3 3 3 3 3 3 2 3 2 3 3 1 3 3 3 3 3 3 3
## [781] 3 3 3 3 3 1 3 3 3 3 3 3 3 3 3 3 3 3 3 3 3 3 3 3 3 3 3 3 3 2 3 3 3 3 2 3 3 3 3 3 3 3 3 3 3 3 3 3 3 3 3 3 3 3 3 3 1 3 3 2 3 3 2 3 3 3 3 3 3 3 2 3 3 3 3 3 3 3
## [859] 3 3 3 3 3 3 3 3 3 3 3 3 3 3 2 3 3 3 3 3 3 3 3 3 3 3 3 3 3 3 3 3 3 3 1 3 3 3 3 3 3 3 3 3 3 3 3 3 3 3 3 3 3 2 3 3 3 3 3 3 3 3 3 3 3 3 3 3 3 3 3 3 3 3 3 3 2 3
## [937] 3 3 3 3 3 3 3 3 3 3 2 3 3 3 3 3 3 3 3 3 3 3 3 3 3 3 3 3 3 3 3 3 3 3 3 3 3 3 3 3 3 3 2 3 3 3 3 3 3 3 3 3 3 3 3 3 3 3 3 3 3 3 3 3
## [ reached getOption("max.print") -- omitted 5174 entries ]
##
## Within cluster sum of squares by cluster:
## [1] 263406.1 163963.6 265053.0
## (between_SS / total_SS = 77.5 %)
##
## Available components:
##
## [1] "cluster" "centers" "totss" "withinss" "tot.withinss" "betweenss" "size" "iter" "ifault"K-means is a single-cluster assignment, so each observation will be automatically assigned to one cluster. You can extract the cluster results (per observation) from the data by extracting the $cluster atomic.
Below, we extract the clusters per each observation and then attach it to the survey data.
20.3 Visualization
Another useful thing to do is to visualize the results of the k-means analysis. To do so, we can use the fviz_cluster() function, which is from factoextra. Let us do this now with our 3-cluster analysis.
fviz_cluster(k3, data = survey_data,
#palette = c("#2E9FDF", "#00AFBB", "#E7B800"), #change the colors of the clusters
geom = "point", ggtheme = theme_minimal())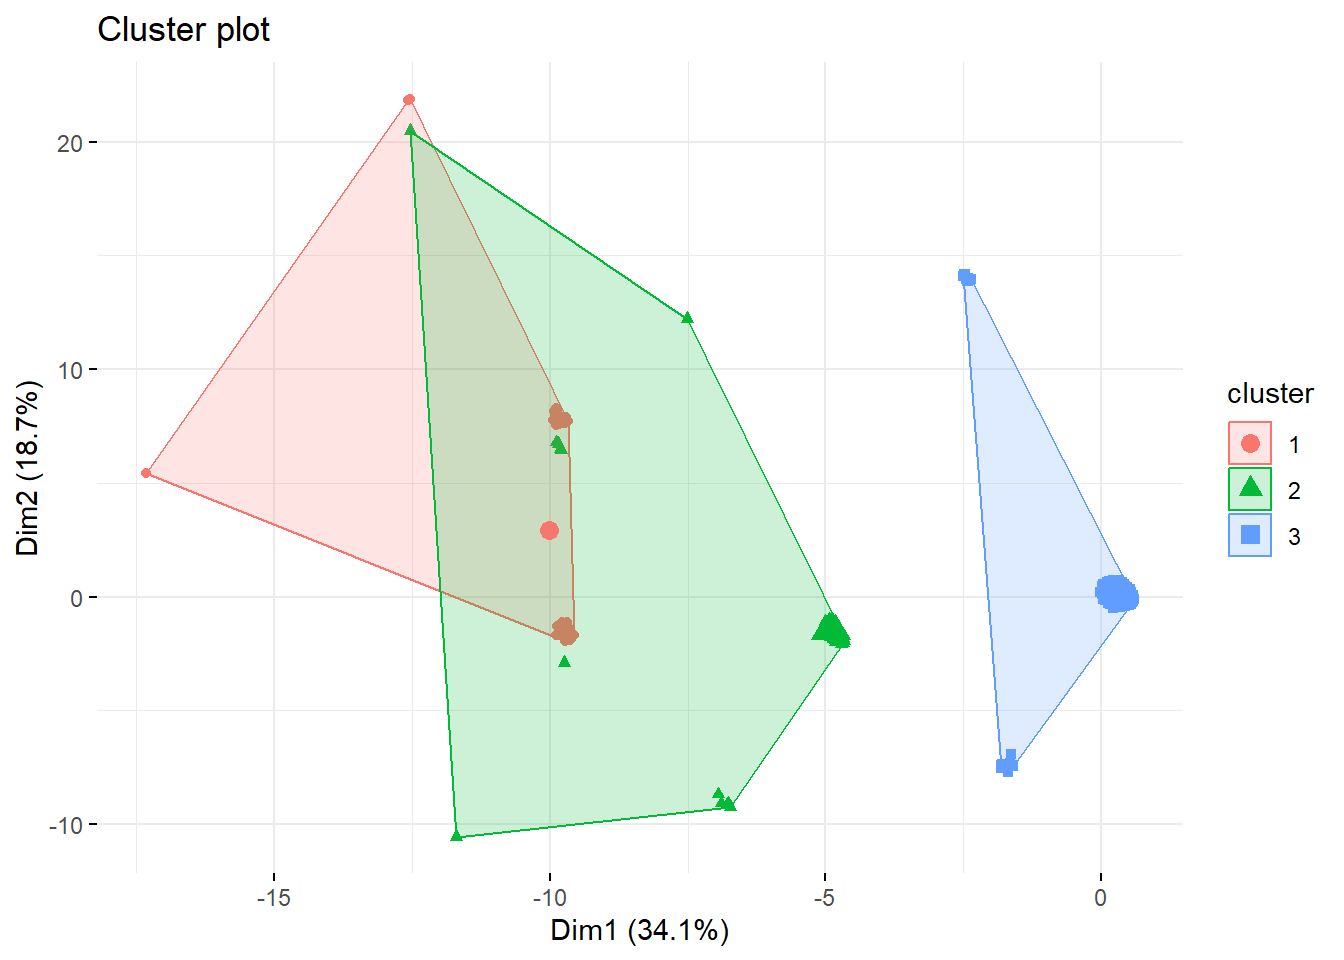 We could obviously do this with analyses including larger clusters. This can be especially useful to determine the optimal number of clusters.
k2 <- kmeans(survey_data, centers = 2, nstart = 25)
fviz_cluster(k2, data = survey_data,
             geom = "point", ggtheme = theme_minimal())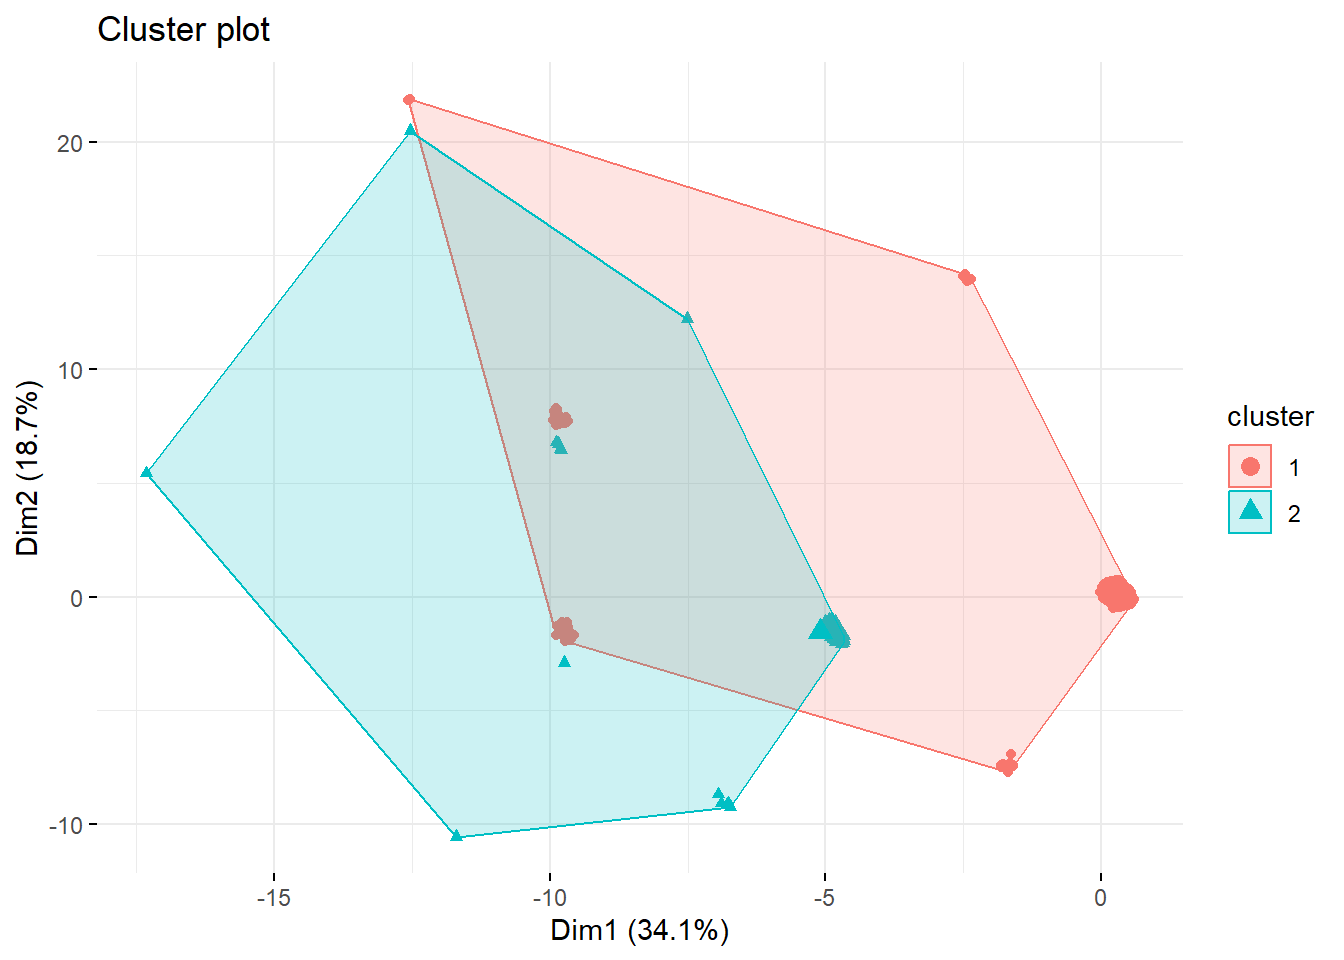
k4 <- kmeans(survey_data, centers = 4, nstart = 25)
fviz_cluster(k4, data = survey_data,
             geom = "point", ggtheme = theme_minimal())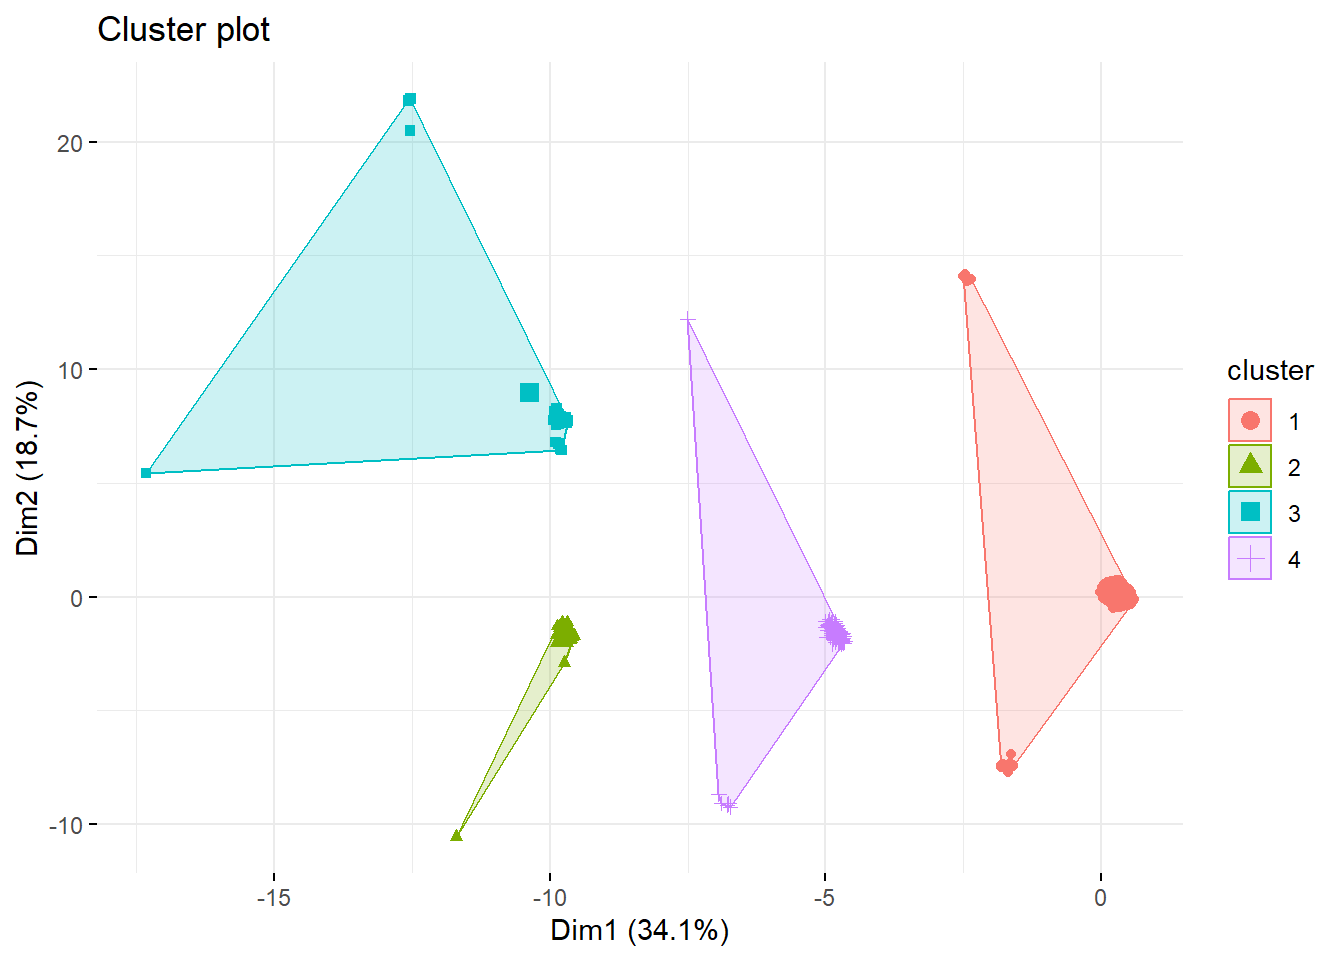
k5 <- kmeans(survey_data, centers = 5, nstart = 25)
fviz_cluster(k5, data = survey_data,
             geom = "point", ggtheme = theme_minimal())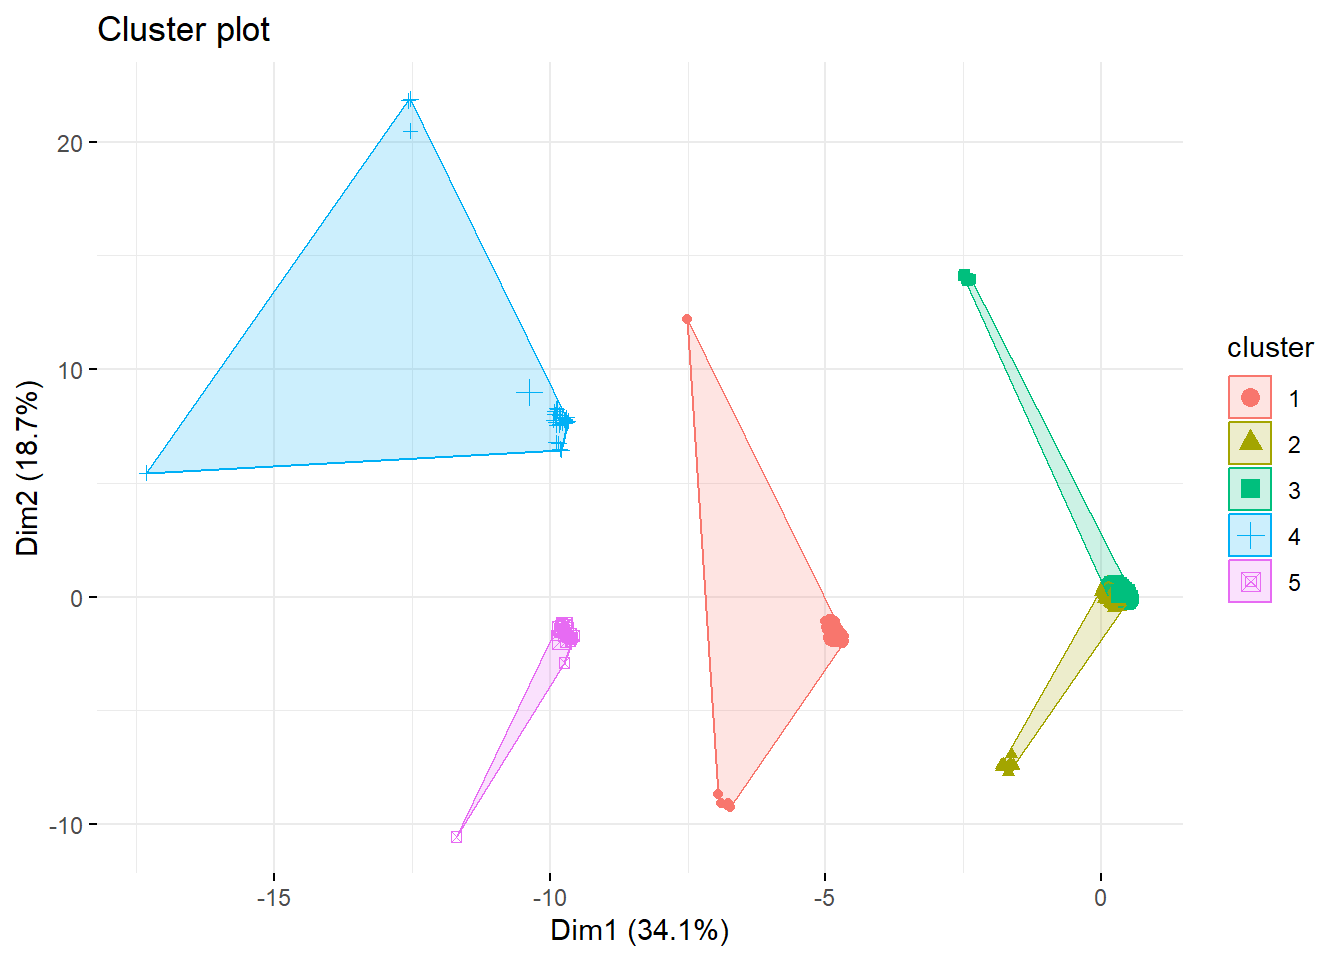
k9 <- kmeans(survey_data, centers = 9, nstart = 25)
fviz_cluster(k9, data = survey_data,
geom = "point", ggtheme = theme_minimal())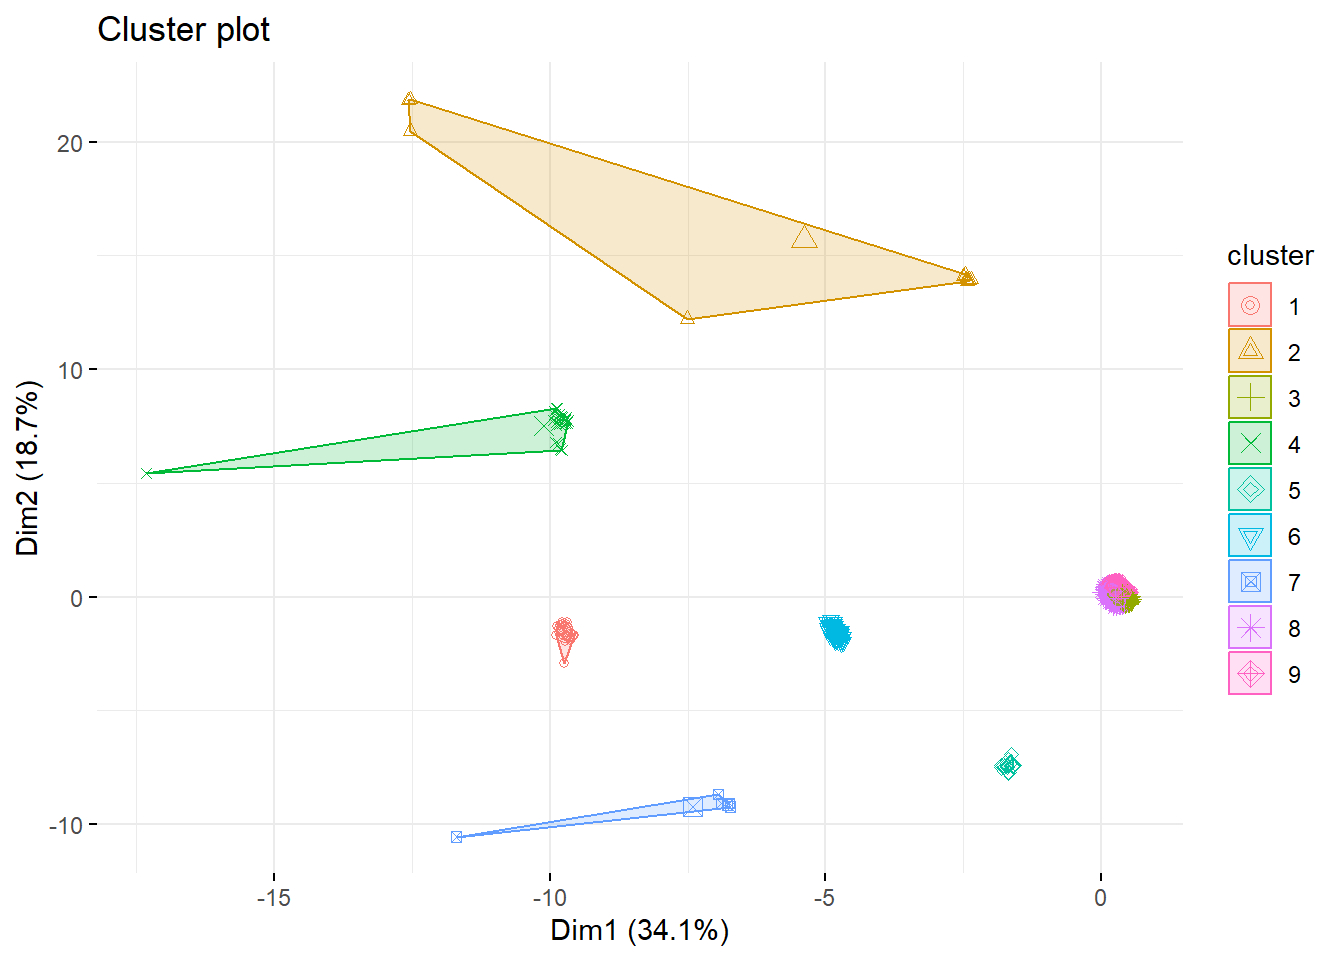 # Bonus: Choosing the K
Source: https://www.datanovia.com/en/lessons/determining-the-optimal-number-of-clusters-3-must-know-methods/
# Bonus: Choosing the K
Source: https://www.datanovia.com/en/lessons/determining-the-optimal-number-of-clusters-3-must-know-methods/
Want to determine the optimal number of clusters? Below, we use 3 different strategies, wss, silhouette, and gap_stat (the last one takes the longest). These strategies can also be used to analyze different clustering strategies (not just k-means).
One important way to interpret all k-selection models is to use the “elbow method.” In the elbow method, you are looking for a specific “elbow” in your data. When there is an elbow, the number of clusters (k) dramatically improves compared to its previous number of k (for example, 3 is way better than 2), but it does not improve as you increase the number of clusters (so 4 is not much better than 2).
20.4 WSS
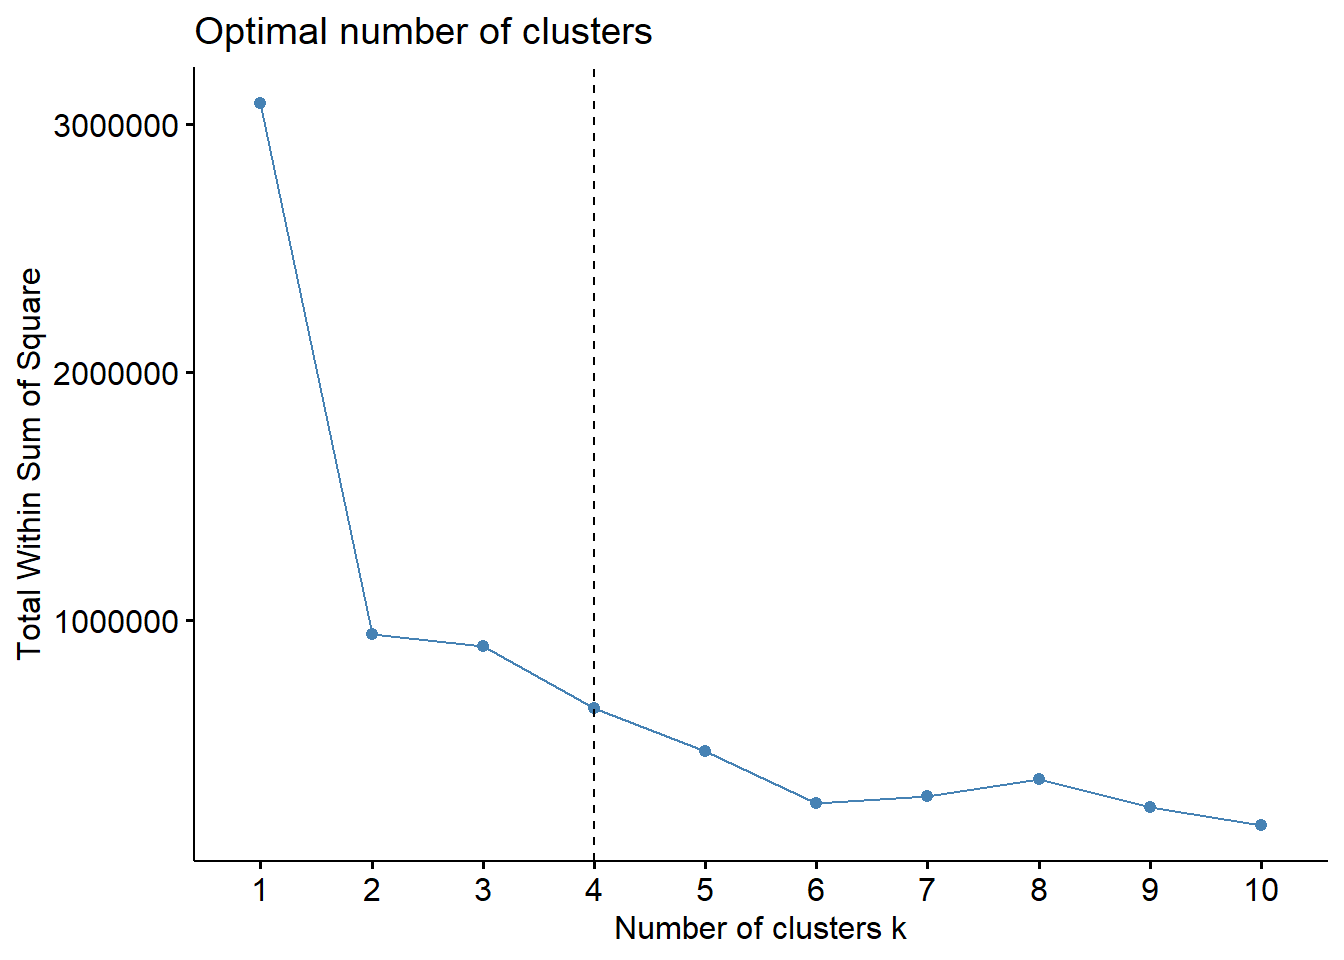 In this example, 4 appears to be the most optimal cluster, but there is also a marked drop in 2, which suggests that this may also be a useful number to cluster by.
20.5 Silhouette
Silhouette determines the quality of the cluster. If an observation fits well in a cluster, it will have a high average. Therefore, the higher the number, the better the clustering k.
 Note that the results of
 silhouette differ somewhat from wss. Rather than stressing out over how different they are, I encourage you to use information from both to determine the optimal number of k’s. In your paper, you should report the results of just the main model you have selected.
Want more practice with LDA topic modeling? Check out these tutorials: