7 Samples and Populations
So you’ve developed your research question, figured out how you’re going to measure whatever you want to study, and have your survey or interviews ready to go. Now all your need is other people to become your data.
You might say ‘easy!’, there’s people all around you. You have a big family tree and surely them and their friends would have happy to take your survey. And then there’s your friends and people you’re in class with. Finding people is way easier than writing the interview questions or developing the survey. That reaction might be a strawman, maybe you’ve come to the conclusion none of this is easy. For your data to be valuable, you not only have to ask the right questions, you have to ask the right people. The “right people” aren’t the best or the smartest people, the right people are driven by what your study is trying to answer and the method you’re using to answer it.
Remember way back in chapter 2 when we looked at this chart and discussed the differences between qualitative and quantitative data.
| Qualitative | Quantitative | |
|---|---|---|
| Purpose | Understanding underlying motivations or reasons; depth of knowledge | Generalize results to the population; make predictions |
| Sample | Small and narrow; not generally representative | Large and broad |
| Method | Interviews, focus groups, case studies | Surveys, web scrapping |
| Analysis | Interpretative, content analysis | Statistical, numeric |
One of the biggest differences between quantitative and qualitative data was whether we wanted to be able to explain something for a lot of people (what percentage of residents in Oklahoma support legalizing marijuana?) versus explaining the reasons for those opinions (why do some people support legalizing marijuana and others not?). The underlying differences there is whether our goal is explain something about everyone, or whether we’re content to explain it about just our respondents.
‘Everyone’ is called the population. The population in research is whatever group the research is trying to answer questions about. The population could be everyone on planet Earth, everyone in the United States, everyone in rural counties of Iowa, everyone at your university, and on and on. It is simply everyone within the unit you are intending to study.
In order to study the population, we typically take a sample or a subset. A sample is simply a smaller number of people from the population that are studied, which we can use to then understand the characteristics of the population based on that subset. That’s why a poll of 1300 likely voters can be used to guess at who will win your states Governor race. It isn’t perfect, and we’ll talk about the math behind all of it in a later chapter, but for now we’ll just focus on the different types of samples you might use to study a population with a survey.
If correctly sampled, we can use the sample to generalize information we get to the population. Generalizability, which we defined earlier, means we can assume the responses of people to our study match the responses everyone would have given us. We can only do that if the sample is representative of the population, meaning that they are alike on important characteristics such as race, gender, age, education. If something makes a large difference in people’s views on a topic in your research and your sample is not balanced, you’ll get inaccurate results.
Generalizability is more of a concern with surveys than with interviews. The goal of a survey is to explain something about people beyond the sample you get responses from. You’ll never see a news headline saying that “53% of 1250 Americans that responded to a poll approve of the President”. It’s only worth asking those 1250 people if we can assume the rest of the United States feels the same way overall. With interviews though we’re looking for depth from their responses, and so we are less hopefully that the 15 people we talk to will exactly match the American population. That doesn’t mean the data we collect from interviews doesn’t have value, it just has different uses.
There are two broad types of samples, with several different techniques clustered below those. Probability sampling is associated with surveys, and non-probability sampling is often used when conducting interviews. We’ll first describe probability samples, before discussing the non-probability options.
The type of sampling you’ll use will be based on the type of research you’re intending to do. There’s no sample that’s right or wrong, they can just be more or less appropriate for the question you’re trying to answer. And if you use a less appropriate sampling strategy, the answer you get through your research is less likely to be accurate.
7.1 Types of Probability Samples
So we just hinted at the idea that depending on the sample you use, you can generalize the data you collect from the sample to the population. That will depend though on whether your sample represents the population. To ensure that your sample is representative of the population, you will want to use a probability sample. A representative sample refers to whether the characteristics (race, age, income, education, etc) of the sample are the same as the population. Probability sampling is a sampling technique in which every individual in the population has an equal chance of being selected as a subject for the research.
There are several different types of probability samples you can use, depending on the resources you have available.
Let’s start with a simple random sample. In order to use a simple random sample all you have to do is take everyone in your population, throw them in a hat (not literally, you can just throw their names in a hat), and choose the number of names you want to use for your sample. By drawing blindly, you can eliminate human bias in constructing the sample and your sample should represent the population from which it is being taken.
However, a simple random sample isn’t quite that easy to build. The biggest issue is that you have to know who everyone is in order to randomly select them. What that requires is a sampling frame, a list of all residents in the population. But we don’t always have that. There is no list of residents of New York City (or any other city). Organizations that do have such a list wont just give it away. Try to ask your university for a list and contact information of everyone at your school so you can do a survey? They wont give it to you, for privacy reasons. It’s actually harder to think of popultions you could easily develop a sample frame for than those you can’t. If you can get or build a sampling frame, the work of a simple random sample is fairly simple, but that’s the biggest challenge.
Most of the time a true sampling frame is impossible to acquire, so researcher have to settle for something approximating a complete list. Earlier generations of researchers could use the random dial method to contact a random sample of Americans, because every household had a single phone. To use it you just pick up the phone and dial random numbers. Assuming the numbers are actually random, anyone might be called. That method actually worked somewhat well, until people stopped having home phone numbers and eventually stopped answering the phone. It’s a fun mental exercise to think about how you would go about creating a sampling frame for different groups though; think through where you would look to find a list of everyone in these groups:
Plumbers Recent first-time fathers Members of gyms
The best way to get an actual sampling frame is likely to purchase one from a private company that buys data on people from all the different websites we use.
Let’s say you do have a sampling frame though. For instance, you might be hired to do a survey of members of the Republican Party in the state of Utah to understand their political priorities this year, and the organization could give you a list of their members because they’ve hired you to do the reserach. One method of constructing a simple random sample would be to assign each name on the list a number, and then produce a list of random numbers. Once you’ve matched the random numbers to the list, you’ve got your sample. See the example using the list of 20 names below
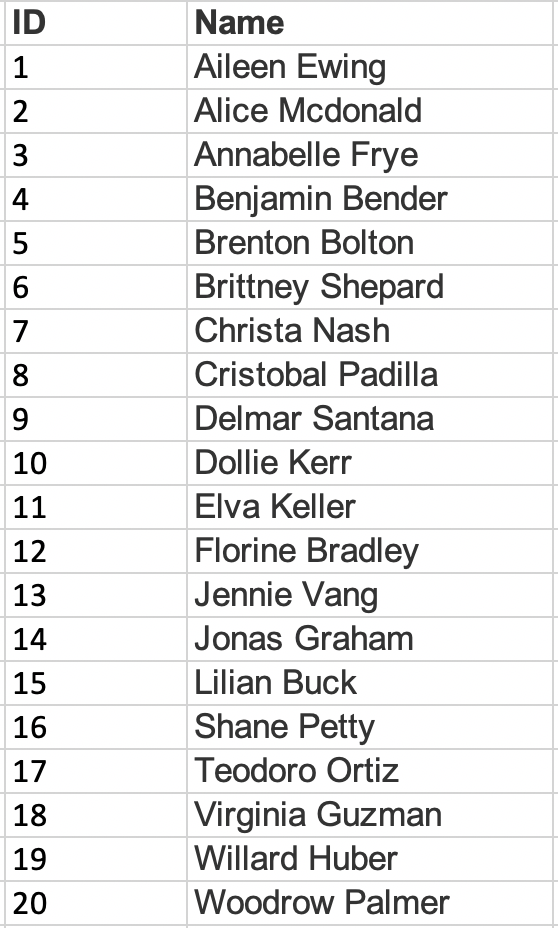
and the list of 5 random numbers.
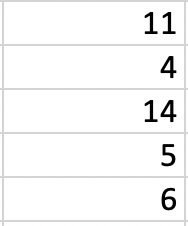
Systematic sampling is similar to simple random sampling in that it begins with a list of the population, but instead of choosing random numbers one would select every kth name on the list. What the heck is a kth? K just refers to how far apart the names are on the list you’re selecting. So if you want to sample one-tenth of the population, you’d select every tenth name. In order to know the k for your study you need to know your sample size (say 1000) and the size of the population (75000). You can divide the size of the population by the sample (75000/1000), which will produce your k (750). As long as the list does not contain any hidden order, this sampling method is as good as the random sampling method, but its only advantage over the random sampling technique is simplicity. If we used the same list as above and wanted to survey 1/5th of the population, we’d include 4 of the names on the list. It’s important with systematic samples to randomize the starting point in the list, otherwise people with A names will be oversampled. If we started with the 3rd name, we’d select Annabelle Frye, Cristobal Padilla, Jennie Vang, and Virginia Guzman, as shown below. So in order to use a systematic sample, we need three things, the population size (denoted as N), the sample size we want (n) and k, which we calculate by dividing the population by the sample).
N= 20 (Population Size) n= 4 (Sample Size) k= 5 {20/4 (kth element) selection interval}
We can also use a stratified sample, but that requires knowing more about the population than just their names. A stratified sample divides the study population into relevant subgroups, and then draws a sample from each subgroup. Stratified sampling can be used if you’re very concerned about ensuring balance in the sample or there may be a problem of underrepresentation among certain groups when responses are received. Not everyone in your sample is equally likely to answer a survey. Say for instance we’re trying to predict who will win an election in a county with three cities. In city A there are 1 million college students, in city B there are 2 million families, and in City C there are 3 million retirees. You know that retirees are more likely than busy college students or parents to respond to a poll. So you break the sample into three parts, ensuring that you get 100 responses from City A, 200 from City B, and 300 from City C, so the three cities would match the population. A stratified sample provides the researcher control over the subgroups that are included in the sample, whereas simple random sampling does not guarantee that any one type of person will be included in the final sample. A disadvantage is that it is more complex to organize and analyze the results compared to simple random sampling.
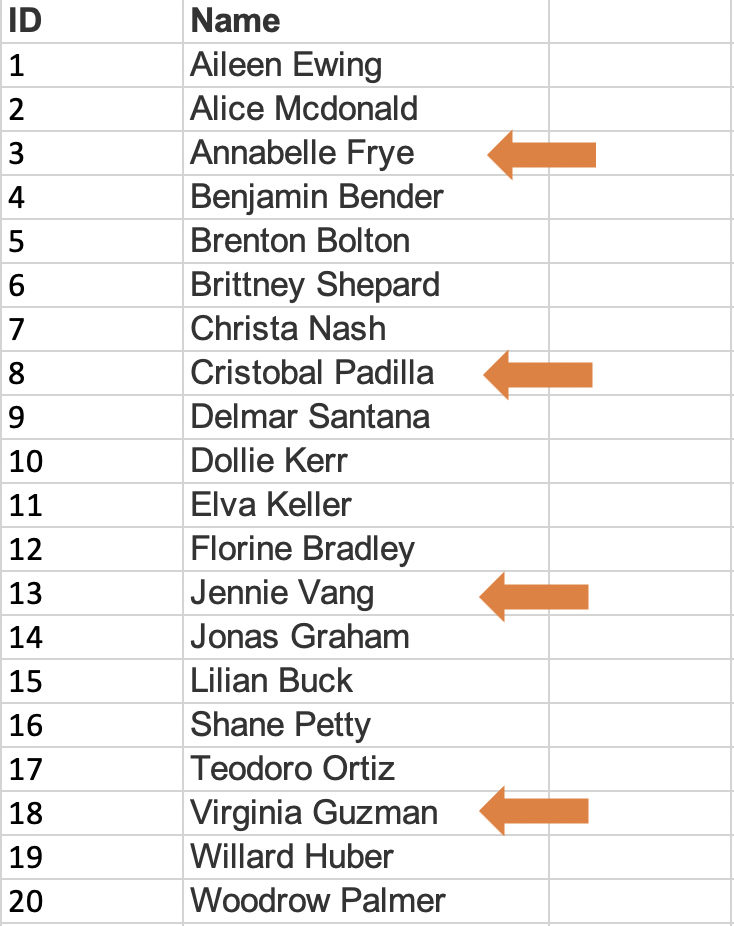
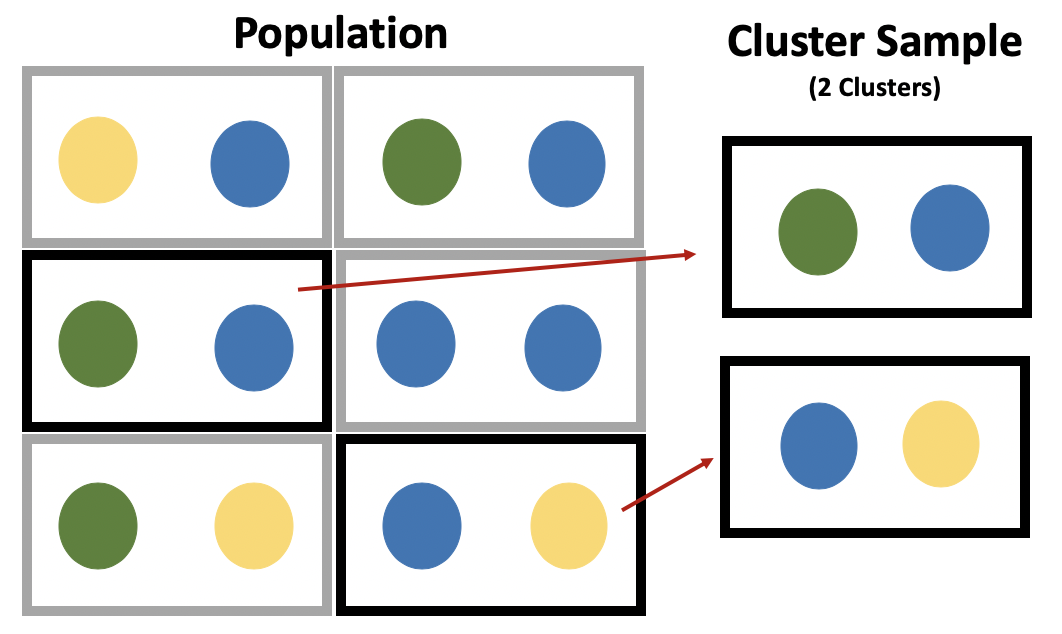
Cluster sampling is an approach that begins by sampling groups (or clusters) of population elements and then selects elements from within those groups. A researcher would use cluster sampling if getting access to elements in an entrie population is too challenging. For instance, a study on students in schools would probably benefit from randomly selecting from all students at the 36 elementary schools in a fictional city. But getting contact information for all students would be very difficult. So the researcher might work with principals at several schools and survey those students. The researcher would need to ensure that the students surveyed at the schools are similar to students throughout the entire city, and greater access and participation within each cluster may make that possible.
The image below shows how this can work, although the example is oversimplified. Say we have 12 students that are in 6 classrooms. The school is in total 1/4th green (3/12), 1/4th yellow (3/12), and half blue (6/12). By selecting the right clusters from within the school our sample can be representative of the entire school, assuming these colors are the only significant difference between the students. In the real world, you’d want to match the clusters and population based on race, gender, age, income, etc. And I should point out that this is an overly simplified example. What if 5/12s of the school was yellow and 1/12th was green, how would I get the right proportions? I couldn’t, but you’d do the best you could. You still wouldn’t want 4 yellows in the sample, you’d just try to approximiate the population characteristics as best you can.
7.2 Actually Doing a Survey
All of that probably sounds pretty complicated. Identifying your population shouldn’t be too difficult, but how would you ever get a sampling frame? And then actually identifying who to include… It’s probably a bit overwhelming and makes doing a good survey sound impossible.
Researchers using surveys aren’t superhuman though. Often times, they use a little help. Because surveys are really valuable, and because researchers rely on them pretty often, there has been substantial growth in companies that can help to get one’s survey to its intended audience.
One popular resource is Amazon’s Mechanical Turk (more commonly known as MTurk). MTurk is at its most basic a website where workers look for jobs (called hits) to be listed by employers, and choose whether to do the task or not for a set reward. MTurk has grown over the last decade to be a common source of survey participants in the social sciences, in part because hiring workers costs very little (you can get some surveys completed for penny’s). That means you can get your survey completed with a small grant ($1-2k at the low end) and get the data back in a few hours. Really, it’s a quick and easy way to run a survey.
However, the workers aren’t perfectly representative of the average American. For instance, researchers have found that MTurk respondents are younger, better educated, and earn less than the average American.
One way to get around that issue, which can be used with MTurk or any survey, is to weight the responses. Because with MTurk you’ll get fewer responses from older, less educated, and richer Americans, those responses you do give you want to count for more to make your sample more representative of the population. Oversimplified example incoming!
Imagine you’re setting up a pizza party for your class. There are 9 people in your class, 4 men and 5 women. You only got 4 responses from the men, and 3 from the women. All 4 men wanted peperoni pizza, while the 3 women want a combination. Pepperoni wins right, 4 to 3? Not if you assume that the people that didn’t respond are the same as the ones that did. If you weight the responses to match the population (the full class of 9), a combination pizza is the winner.

Because you know the population of women is 5, you can weight the 3 responses from women by 5/3 = 1.6667. If we weight (or multiply) each vote we did receive from a woman by 1.6667, each vote for a combination now equals 1.6667, meaning that the 3 votes for combination total 5. Because we received a vote from every man in the class, we just weight their votes by 1. The big assumption we have to make is that the people we didn’t hear from (the 2 women that didn’t vote) are similar to the ones we did hear from. And if we don’t get any responses from a group we don’t have anything to infer their preferences or views from.
Let’s go through a slightly more complex example, still just considering one quality about people in the class. Let’s say your class actually has 100 students, but you only received votes from 50. And, what type of pizza people voted for is mixed, but men still prefer peperoni overall, and women still prefer combination. The class is 60% female and 40% male.
We received 21 votes from women out of the 60, so we can weight their responses by 60/21 to represent the population. We got 29 votes out of the 40 for men, so their responses can be weighted by 40/29. See the math below.

53.8 votes for combination? That might seem a little odd, but weighting isn’t a perfect science. We can’t identify what a non-respondent would have said exactly, all we can do is use the responses of other similar people to make a good guess. That issue often comes up in polling, where pollsters have to guess who is going to vote in a given election in order to project who will win. And we can weight on any characteristic of a person we think will be important, alone or in combination. Modern polls weight on age, gender, voting habits, education, and more to make the results as generalizable as possible.
There’s an appendix later in this book where I walk through the actual steps of creating weights for a sample in R, if anyone actually does a survey. I intended this section to show that doing a good survey might be simpler than it seemed, but now it might sound even more difficult. A good lesson to take though is that there’s always another door to go through, another hurdle to improve your methods. Being good at research just means being constantly prepared to be given a new challenge, and being able to find another solution.
7.3 Non-Probability Sampling
Qualitative researchers’ main objective is to gain an in-depth understanding on the subject matter they are studying, rather than attempting to generalize results to the population. As such, non-probability sampling is more common because of the researchers desire to gain information not from random elements of the population, but rather from specific individuals.
Random selection is not used in nonprobability sampling. Instead, the personal judgment of the researcher determines who will be included in the sample. Typically, researchers may base their selection on availability, quotas, or other criteria. However, not all members of the population are given an equal chance to be included in the sample. This nonrandom approach results in not knowing whether the sample represents the entire population. Consequently, researchers are not able to make valid generalizations about the population.
As with probability sampling, there are several types of non-probability samples. Convenience sampling, also known as accidental or opportunity sampling, is a process of choosing a sample that is easily accessible and readily available to the researcher. Researchers tend to collect samples from convenient locations such as their place of employment, a location, school, or other close affiliation. Although this technique allows for quick and easy access to available participants, a large part of the population is excluded from the sample.
For example, researchers (particularly in psychology) often rely on research subjects that are at their universities. That is highly convenient, students are cheap to hire and readily available on campuses. However, it means the results of the study may have limited ability to predict motivations or behaviors of people that aren’t included in the sample, i.e., people outside the age of 18-22 that are going to college.
If I ask you to get find out whether people approve of the mayor or not, and tell you I want 500 people’s opinions, should you go stand in front of the local grocery store? That would be convinient, and the people coming will be random, right? Not really. If you stand outside a rural Piggly Wiggly or an urban Whole Foods, do you think you’ll see the same people? Probably not, people’s chracteristics make the more or less likely to be in those locations. This technique runs the high risk of over- or under-representation, biased results, as well as an inability to make generalizations about the larger population. As the name implies though, it is convenient.
Purposive sampling, also known as judgmental or selective sampling, refers to a method in which the researcher decides who will be selected for the sample based on who or what is relevant to the study’s purpose. The researcher must first identify a specific characteristic of the population that can best help answer the research question. Then, they can deliberately select a sample that meets that particular criterion. Typically, the sample is small with very specific experiences and perspectives. For instance, if I wanted to understand the experiences of prominent foreign-born politicians in the United States, I would purposefully build a sample of… prominent foreign-born politicians in the United States. That would exclude anyone that was born in the United States or and that wasn’t a politician, and I’d have to define what I meant by prominent. Purposive sampling is susceptible to errors in judgment by the researcher and selection bias due to a lack of random sampling, but when attempting to research small communities it can be effective.
When dealing with small and difficult to reach communities researchers sometimes use snowball samples, also known as chain referral sampling. Snowball sampling is a process in which the researcher selects an initial participant for the sample, then asks that participant to recruit or refer additional participants who have similar traits as them. The cycle continues until the needed sample size is obtained.
This technique is used when the study calls for participants who are hard to find because of a unique or rare quality or when a participant does not want to be found because they are part of a stigmatized group or behavior. Examples may include people with rare diseases, sex workers, or a child sex offenders. It would be impossible to find an accurate list of sex workers anywhere, and surveying the general population about whether that is their job will produce false responses as people will be unwilling to identify themselves. As such, a common method is to gain the trust of one individual within the community, who can then introduce you to others. It is important that the researcher builds rapport and gains trust so that participants can be comfortable contributing to the study, but that must also be balanced by mainting objectivity in the research.
Snowball sampling is a useful method for locating hard to reach populations but cannot guarantee a representative sample because each contact will be based upon your last. For instance, let’s say you’re studying illegal fight clubs in your state. Some fight clubs allow weapons in the fights, while others completely ban them; those two types of clubs never interreact because of their disagreement about whether weapons should be allowed, and there’s no overlap between them (no members in both type of club). If your initial contact is with a club that uses weapons, all of your subsequent contacts will be within that community and so you’ll never understand the differences. If you didn’t know there were two types of clubs when you started, you’ll never even know you’re only researching half of the community. As such, snowball sampling can be a necessary technique when there are no other options, but it does have limitations.
Quota Sampling is a process in which the researcher must first divide a population into mutually exclusive subgroups, similar to stratified sampling. Depending on what is relevant to the study, subgroups can be based on a known characteristic such as age, race, gender, etc. Secondly, the researcher must select a sample from each subgroup to fit their predefined quotas. Quota sampling is used for the same reason as stratified sampling, to ensure that your sample has representation of certain groups. For instance, let’s say that you’re studying sexual harassment in the workplace, and men are much more willing to discuss their experiences than women. You might choose to decide that half of your final sample will be women, and stop requesting interviews with men once you fill your quota. The core difference is that while stratified sampling chooses randomly from within the different groups, quota sampling does not. A quota sample can either be proportional or non-proportional. Proportional quota sampling refers to ensuring that the quotas in the sample match the population (if 35% of the company is female, 35% of the sample should be female). Non-proportional sampling allows you to select your own quota sizes. If you think the experiences of females with sexual harassment are more important to your research, you can include whatever percentage of females you desire.
7.4 Dangers in sampling
Now that we’ve described all the different ways that one could create a sample, we can talk more about the pitfalls of sampling. Ensuring a quality sample means asking yourself some basic questions:
- Who is in the sample?
- How were they sampled?
- Why were they sampled?
A meal is often only as good as the ingredients you use, and your data will only be as good as the sample. If you collect data from the wrong people, you’ll get the wrong answer. You’ll still get an answer, it’ll just be inaccurate. And I want to reemphasize here wrong people just refers to inappropriate for your study. If I want to study bullying in middle schools, but I only talk to people that live in a retirement home, how accurate or relevant will the information I gather be? Sure, they might have grandchildren in middle school, and they may remember their experiences. But wouldn’t my information be more relevant if I talked to students in middle school, or perhaps a mix of teachers, parents, and students? I’ll get an answer from retirees, but it wont be the one I need. The sample has to be appropriate to the research question.
Is a bigger sample always better? Not necessarily. A larger sample can be useful, but a more representative one of the population is better. That was made painfully clear when the magazine Literary Digest ran a poll to predict who would win the 1936 presidential election between Alf Landon and incumbent Franklin Roosevelt. Literary Digest had run the poll since 1916, and had been correct in predicting the outcome every time. It was the largest poll ever, and they received responses for 2.27 million people. They essentially received responses from 1 percent of the American population, while many modern polls use only 1000 responses for a much more populous country. What did they predict? They showed that Alf Landon would be the overwhelming winner, yet when the election was held Roosevelt won every state except Maine and Vermont. It was one of the most decisive victories in Presidential history.
So what went wrong for the Literary Digest? Their poll was large (gigantic!), but it wasn’t representative of likely voters. They polled their own readership, which tended to be more educated and wealthy on average, along with people on a list of those with registered automobiles and telephone users (both of which tended to be owned by the wealthy at that time). Thus, the poll largely ignored the majority of Americans, who ended up voting for Roosevelt. The Literary Digest poll is famous for being wrong, but led to significant improvements in the science of polling to avoid similar mistakes in the future. Researchers have learned a lot in the century since that mistake, even if polling and surveys still aren’t (and can’t be) perfect.
What kind of sampling strategy did Literary Digest use? Convenience, they relied on lists they had available, rather than try to ensure every American was included on their list. A representative poll of 2 million people will give you more accurate results than a representative poll of 2 thousand, but I’ll take the smaller more representative poll than a larger one that uses convenience sampling any day.
7.5 Summary
Picking the right type of sample is critical to getting an accurate answer to your reserach question. There are a lot of differnet options in how you can select the people to participate in your research, but typically only one that is both correct and possible depending on the research you’re doing. In the next chapter we’ll talk about a few other methods for conducting reseach, some that don’t include any sampling by you.