8 Alternative Methods of Data Collection
We’ve described a few of the most prominent methods of analysis for the social sciences in previous chapters. But interviews and surveys aren’t the only way to collect data. In this chapter we’ll describe a few other ways of collecting and using data. These tools might be useful as you develop your own research projects. The first type discussed, experiments, is considered the gold standard for science and is often harder to construct than a survey or interview. The other two methods or data types described don’t involve human interaction, and that significantly lowers the costs of your research project and means you may be able to begin on your research immediately. However, there are other limitations created by those methods.
8.1 Experiments
Experiments are far more common in the natural sciences than the social ones. That’s not because social scientists don’t like experiments, but because humans don’t like being experimented on.
The advantage of using an experiment is control. As the researcher you get to create the setting and the conditions for an experiment. With an experiment you’re not just seeing what people think (“what percentage of people support clean energy policies?”) but testing the impact of a treatment that you’ve identified (“does seeing that a politician of the same party supports clean energy make voters more likely to voice support”).
The core idea of an experiment is that you have two groups: the treatment and the control group. The two groups should be similar on any demographics or characteristics that would affect your outcome of interest. For instance, you’d want a mix of women and men, liberals and conservatives, young and old, in your two groups. That way, you can eliminate or minimize the impact of those things when you look at the results. Because the treatment and control group are similar on other characteristics, you can assume that the only meaningful difference between them is the treatment you give them, so any difference in the outcome is the result of that treatment.
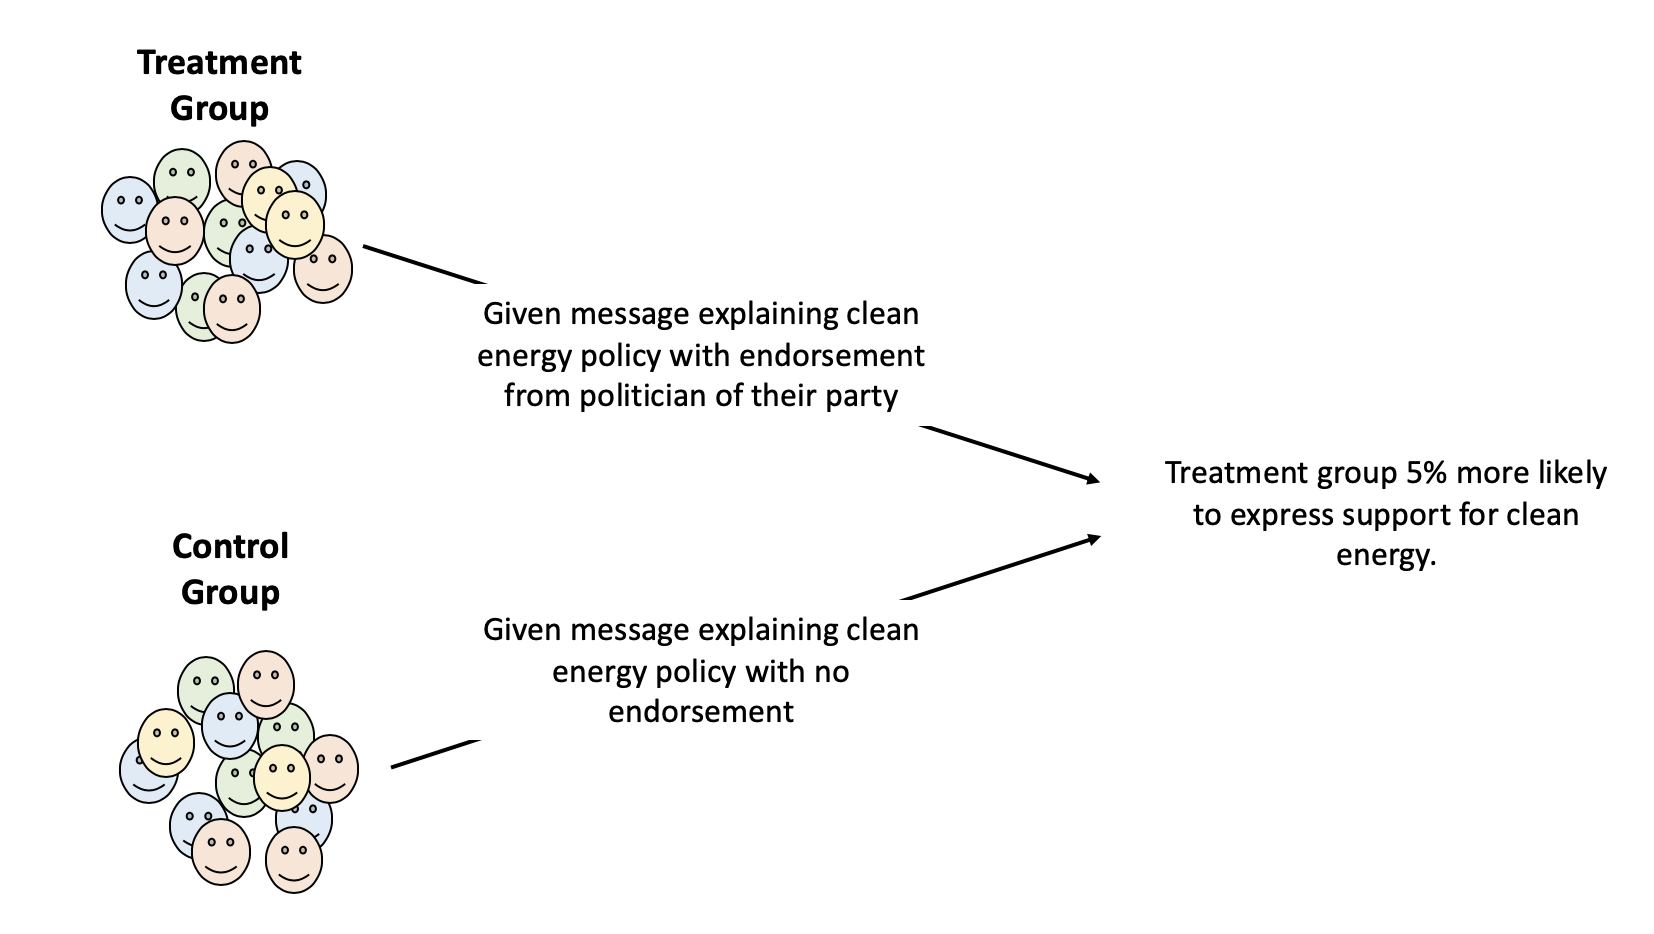
Let’s go back to the happiness study we started to develop earlier. You’ve adopted a definition of what you mean by the concept of happiness and developed a survey to get results that will tell you how happy people are along with other questions you think might be interesting. But there’s still a lot you can’t control. You can’t know if people are being honest in some cases, or whether they’re doing a good job of assessing their own happiness, or whether they’re having a particularly Terrible, Horrible, No Good, Very Bad Day. And there’ll be a lot of things you can’t ask about on your survey that might impact their happiness. An alternative strategy would be to do an experiment where you can try and more fully control for all those outside factors. We can use a real world example to think about what that might look like. Researchers at the University of Liège wanted to understand whether thinking about money impacts peoples happiness. One of the ways they used to measure happiness was by timing how long people spent savoring a piece of chocolate. Wait, why are they using savoring, and not happiness? Because savoring experiences has been shown to predict peoples happiness, and if they ask people whether they’re happy that means they have to trust people to rate their own experiences. But they can directly measure how long people spend eating a piece of chocolate, and they assume people that are happier will spend longer eating the sweet treat. In order to measure the impact of thinking about money they didn’t just tell people to think about money, they showed them a picture of money (the control group was given a blurred picture that didn’t show anything).
What did they find? The people that looked at the picture of money spent 32 seconds eating the chocolate, while the control group took 45 seconds. That might seem like a small effect, the news headlines won’t say “People thinking about a picture of money spent 13 fewer seconds eating chocolate.” But if their operationalizations are correct, this becomes much more important – the mere thought of money has an impact on us, reducing our ability to savor a pleasant experience.
It’s hard to construct a good experiment though. People generally won’t show up for free (or even for just a piece of chocolate). You need a lab space in order to control the conditions, and such activities generally take a lot of time to set up. Online experiments have become more common (you can run those on Amazon’s MTurk too) where you can recruit workers for very little and they can digitally participate in an experiment. Obviously, you wouldn’t want to mail them chocolate, but if you’re curious how messaging impacts political views, for example, it can reduce the barriers to entry on experiments.
8.2 Natural experiments
Because of those barriers and others, political science and public policy often rely on something called natural experiments. Could a political scientist convince a dozen cities to change the rules of their elections from year to year and join a treatment group, while another set of cities leaves everything the same? No. But sometimes cities or states choose to take an activity which allows the researcher to approximate an experiment in a natural setting. While that won’t provide the researcher as much control as they would want in a lab, they can still potentially identify the impact of the changes.
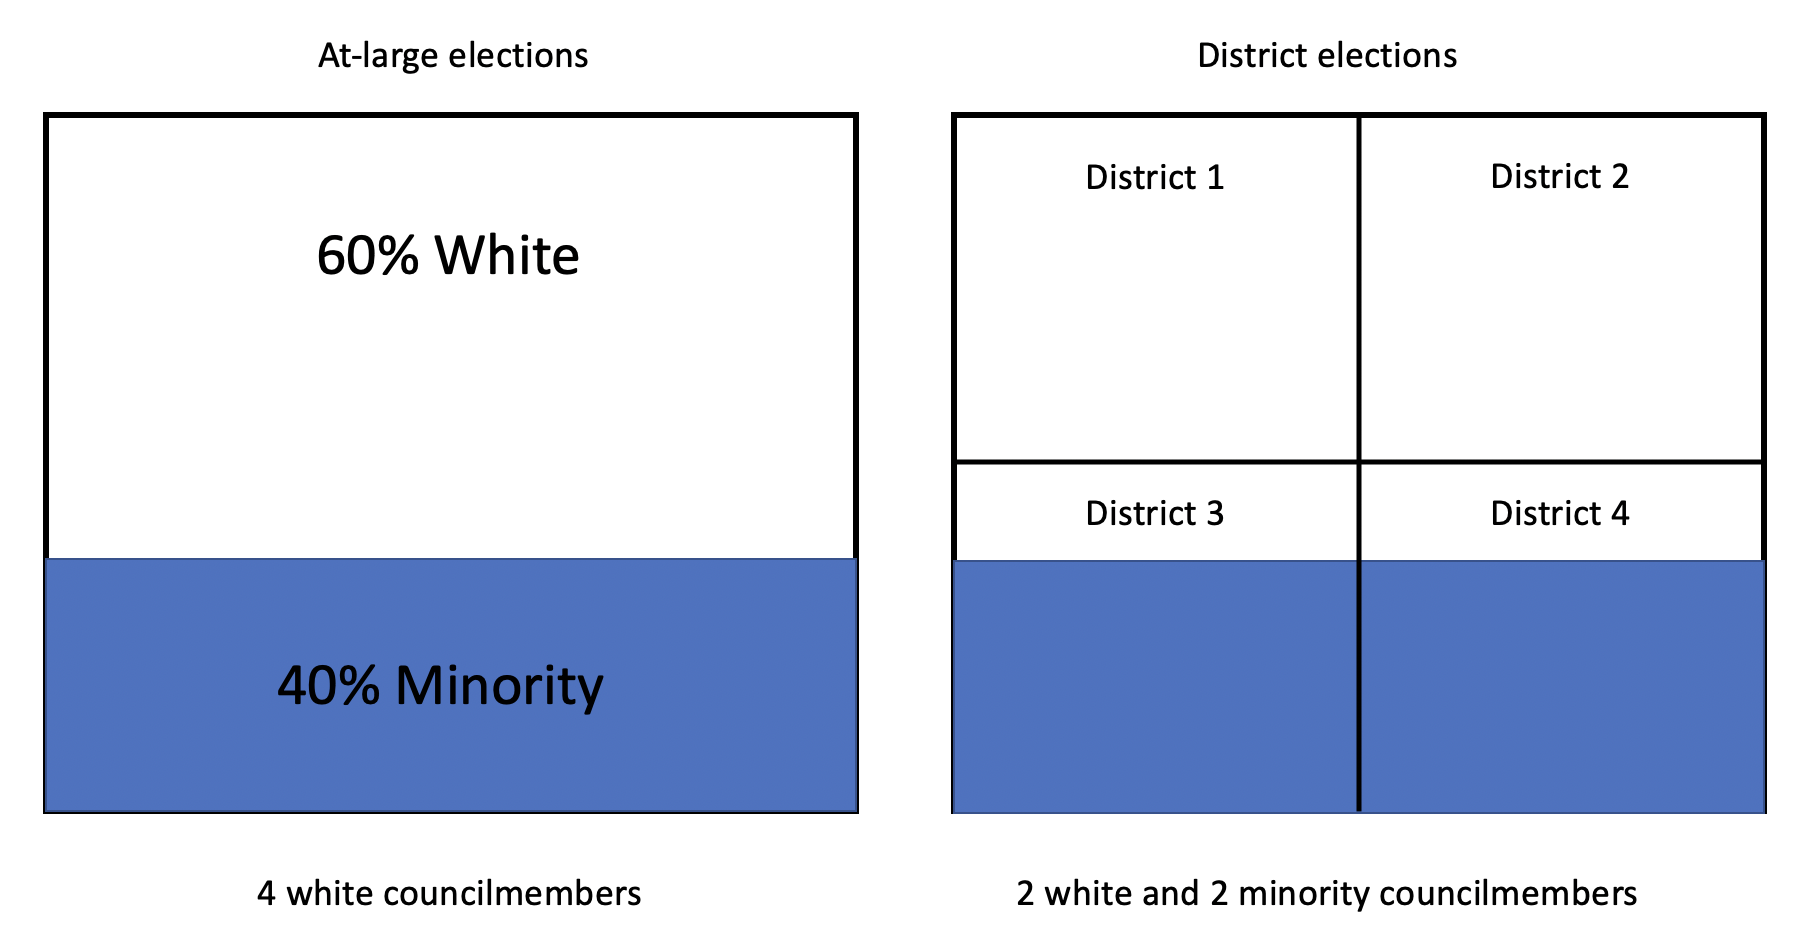
For instance, the state of California was concerned about minority representation on city councils that had at-large district elections. In an at-large district election voters vote for as many candidates for city council as there are position, while in a single district elections voters vote only for their representative. California was concerned that minorities, who are often geographically concentrated in a city, weren’t being represented in at-large elections. To give a very oversimplified example, let’s say the City of New Helvetia is 60% white and 40% minority. With an at-large electoral system (where everyone votes only for candidates of the same race), all 4 councilmembers will be white receiving 60% of the vote, while any minority candidates will fail to qualify. Splitting the city into 4 districts though would provide 2 white councilmembers and 2 minority councilmembers.
So California made it easier for legal challenges to force cities to go from at-large to single district elections with the hope that it would increase minority representation on city councils. Some cities made the change, others didn’t, meaning that the ones that did change become something of a treatment group. They’ve received the treatment of single district elections. Did it have an effect? Yes, according to the research that has been done so far; switching from at-large to single district elections increase minority representation by 10 to 12%. When cities or states suddenly implement new policies, it creates a great natural laboratory for researchers to track how those impact outcomes we can’t study with an experiment on individuals. Of course, natural experiments lack the amount of control a researcher has over a true experiment, but often they’re the best opportunity we have.
California didn’t enact that law so that researchers could study the effect of single district versus at-large elections. Researchers have to keep their ears to the ground and eyes on the news to identify opportunities to run natural experiments. My dissertation was something of a natural experiment. I studied minor league baseball stadiums, and I tread cities that built them as a treatment group that I compared to similar cities that didn’t. I didn’t ask any of the cities to do anything – in fact the stadiums had been built 15 years earlier. But any time a policy or a law is enacted there’s an opportunity to analyze its effects.
8.3 Textual Analysis
Experiments involve a lot of money and contact with the humans involved. Other methods of data collection can reduce those costs.
Just as we’ve already discussed using words as data in the case of interviews, we can use an entire body of written text as well. Sometimes we can use it in the same way as the types of words we gather from interviews, but it often also allows us different opportunities.
Let’s say you want to study changes in the arguments made before the United States Supreme Court. Are lawyers becoming more or less likely to cite precedent? Are their arguments targeted just towards the swing justices on the court, or are they attempting to get unanimous rulings? Those are good and interesting questions, but how are you going to study them? Getting a sampling frame of Supreme Court Justices would be easy (there’s only 9, you can find it on Wikipedia), but good luck getting an interview. Lawyers that argue in front of the Supreme Court are pretty busy too, a survey of them would probably return a 0% response rate. So what are you going to do?
You may be able to answer those questions mentioned above using the text of arguments made at the Supreme Court. The arguments are generally publicly available, and you could read them in order to identify codes related to your research questions – similar to the way you would read an interview.
One of the great reasons to consider textual analysis is because with the growth of the internet text it is overly abundant. Scholarly research is being done using emails, social media posts, online comments, blogs, newspaper articles, speeches, and any number of other ways that humans publish their words.
A great reason to think about using text is because it is available. Sometimes data collection will take some manual work. For instance, if you want to do research on how society reacts to people’s murders based on the victims race, you might download all such stories in a city’s newspaper and manually code the information. But those stories will take reading through all of the stories in the newspaper to identify the ones that are of interest. If you want to collect all of the oral arguments in front of the Supreme Court, the speeches by politicians in the early republic, or blog posts by the LGBTQ community all of those sources will require some elbow grease. But unlike surveys or interviews you don’t have to ask other people for help or for their participation, and collecting text is generally less expensive. The biggest cost is just the time and labor of collecting the data.
Textual analysis is also a great technique to use when attempting to triangulate information. Triangulation is a scientific approach to overcome weaknesses in a study by using different approaches to measure similar characteristics. In the qualitative chapter we discussed mixed-methods approaches, whereby we might use surveys and interviews in the same study. That’s an attempt at triangulation (as well as answering additional questions).
Say you’re studying stress levels in college students, and your survey shows that students self-report that they are very stressed and are getting more stressed as they move through college. That’s interesting for your research, but it comes with the caveat that asking someone whether they’re stressed doesn’t prove they’re stressed, they might be wrong or lying or just having a really bad day. But your survey becomes stronger if you can triangulate it with external data. You might be able to review blog posts by students to show that the language they used during their time at college indicates they are getting more stressed. In the same way you want to hear similar things from multiple people during interviews to trust it, you want to see similar signs from multiple forms of data more generally.
Open coding of the text, similar to how one does it with interviews, is only one way to do textual analysis. More advanced techniques requiring the analytical help of computers can be used as well. Sentiment analysis can be used to identify the sentiment of different blocks of text – such as tweets or Facebook posts. How positive or negative do people feel in your city? Using tweets as a sample of all residents if a city can be tricky because twitter isn’t representative of everyone, but it can give an indication of the overall mood of a place as people post more or fewer positive/negative tweets. That’s done at the national level by researchers at the University of Vermont every day.
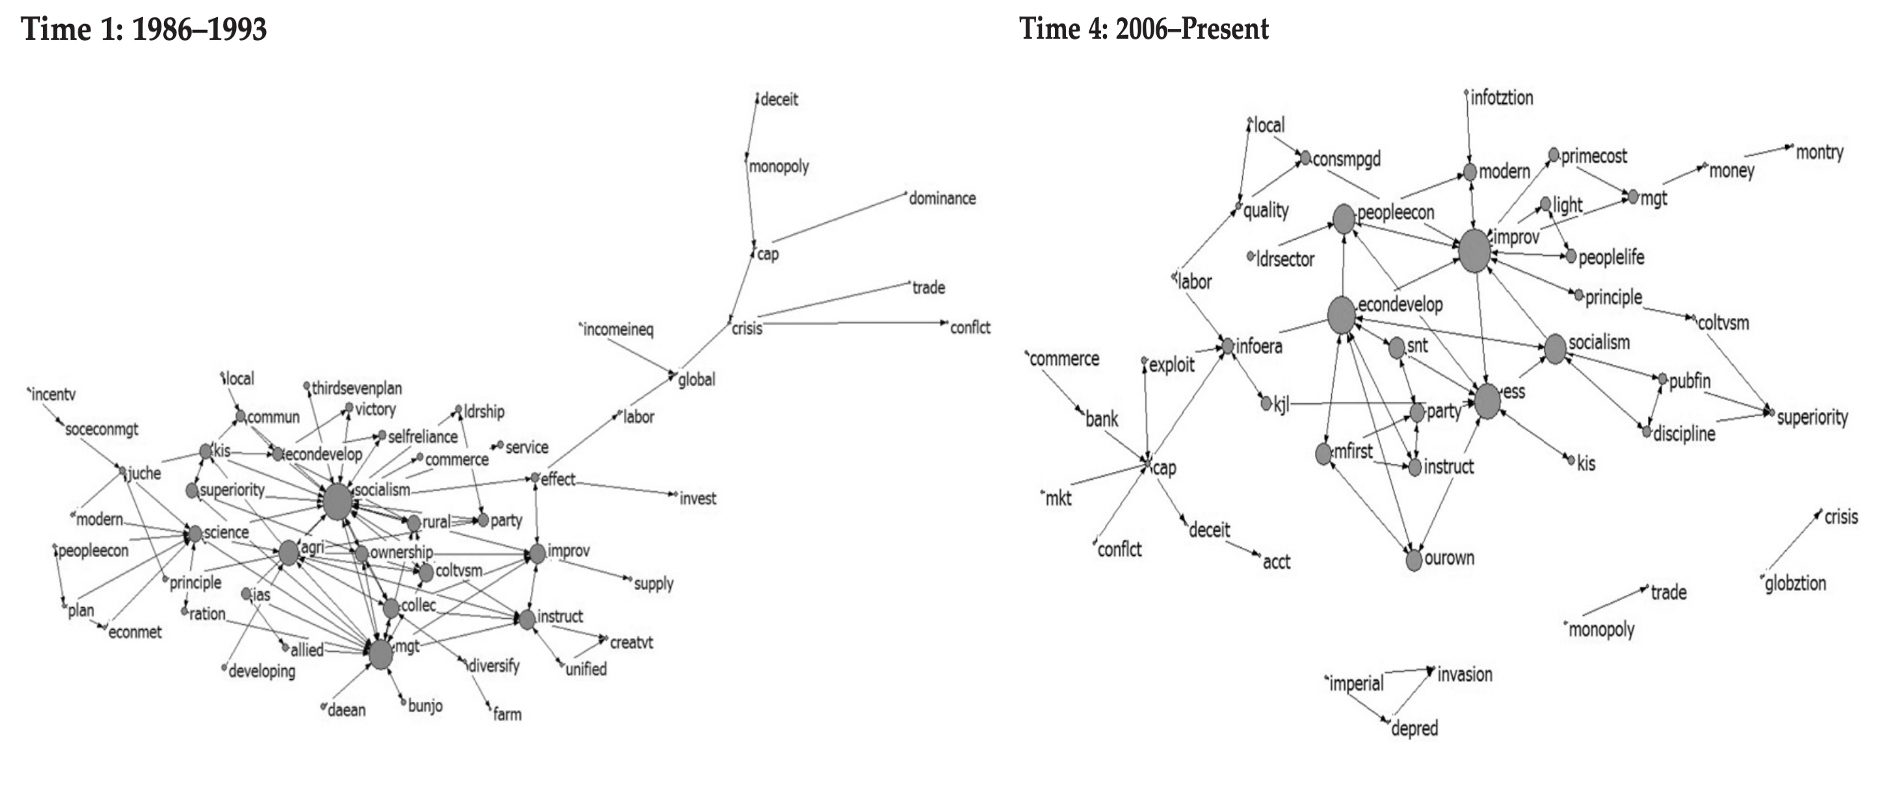
Alternatively, you might look at the specific structure of words and arguments in text to understand. That’s what researchers did when they looked at journal titles written by state-employed economists in North Korea, to understand how government concerns towards the economy had changed over time. The words are treated as a network, and so their use and connections can be seen as changing over time. The larger a word is in the figures below the more often it is used, and the lines connect it to other words its often used in a sentence along with. Below you can see that in the earliest period studied North Korea was focused on words like socialism, collectivism, and management, while in the later period (on the right) thinks like modernization and economic development take a central place. While semantic networks can identify the key words in a given text, it is up to the researcher to identify the context and meaning of the words being used.
8.4 Archival Data
We described quantitative analysis earlier as being done primarily with survey data, and that’s sometimes true. But often, a researcher doesn’t need to do the survey themselves. Similarly to finding text that is freely available, there are a large number of surveys and other quantitative data that are available online for use for free. These are called archival data because it is archived somewhere by someone. If you collect your own data that’s called primary data, but when you get the data second hand it’s called archival. It doesn’t refer to it being stored in some libraries dusty archive, it just means that it exists externally of you. The list of sites below is going to be fairly partial to begin. Hopefully future editions of this textbook will have a larger and more complete list of what’s available. My goal is just to give people an of all the interesting data that already exists.
A note of caution. Downloading that data isn’t as easy as installing an app on your iPhone. You have to understand the websites that hold the data and know what you want to find. That can take some time to understand, and it can be frustrating. You’ll have to create an online account probably and navigate a bunch of terms and nomenclature that’ll be unfamiliar. That said, spending a weekend getting used to a website is shorter than the time it would take the write a good survey, so using data that is already published is a lot quicker.
For instance, the US Census, which gathers information about the demographics, finances, and other characteristics of individuals and communities is available online. Data for the census is collected for individuals, but individuals are then grouped together to create summary measures for neighborhoods, counties, states and the nation. Census data was only collected every decade for a long time, but since 2005 an annual survey has been run that gives researchers a much finer grain understanding of changes in American demographics.
You can find anonymized data for individuals at IPUMS.
And you can find it for different geographies at NHGIS.
While the census askes a very large sample of people about their demographics and characteristics, it doesn’t ask them their opinions or activities. There are other surveys they do though. The Current Population Survey is used by the Bureau of Labor Statistics to understand changes in the American workforce, but it also asks detailed questions about people’s voting, employment, education, life style, food security, and others.
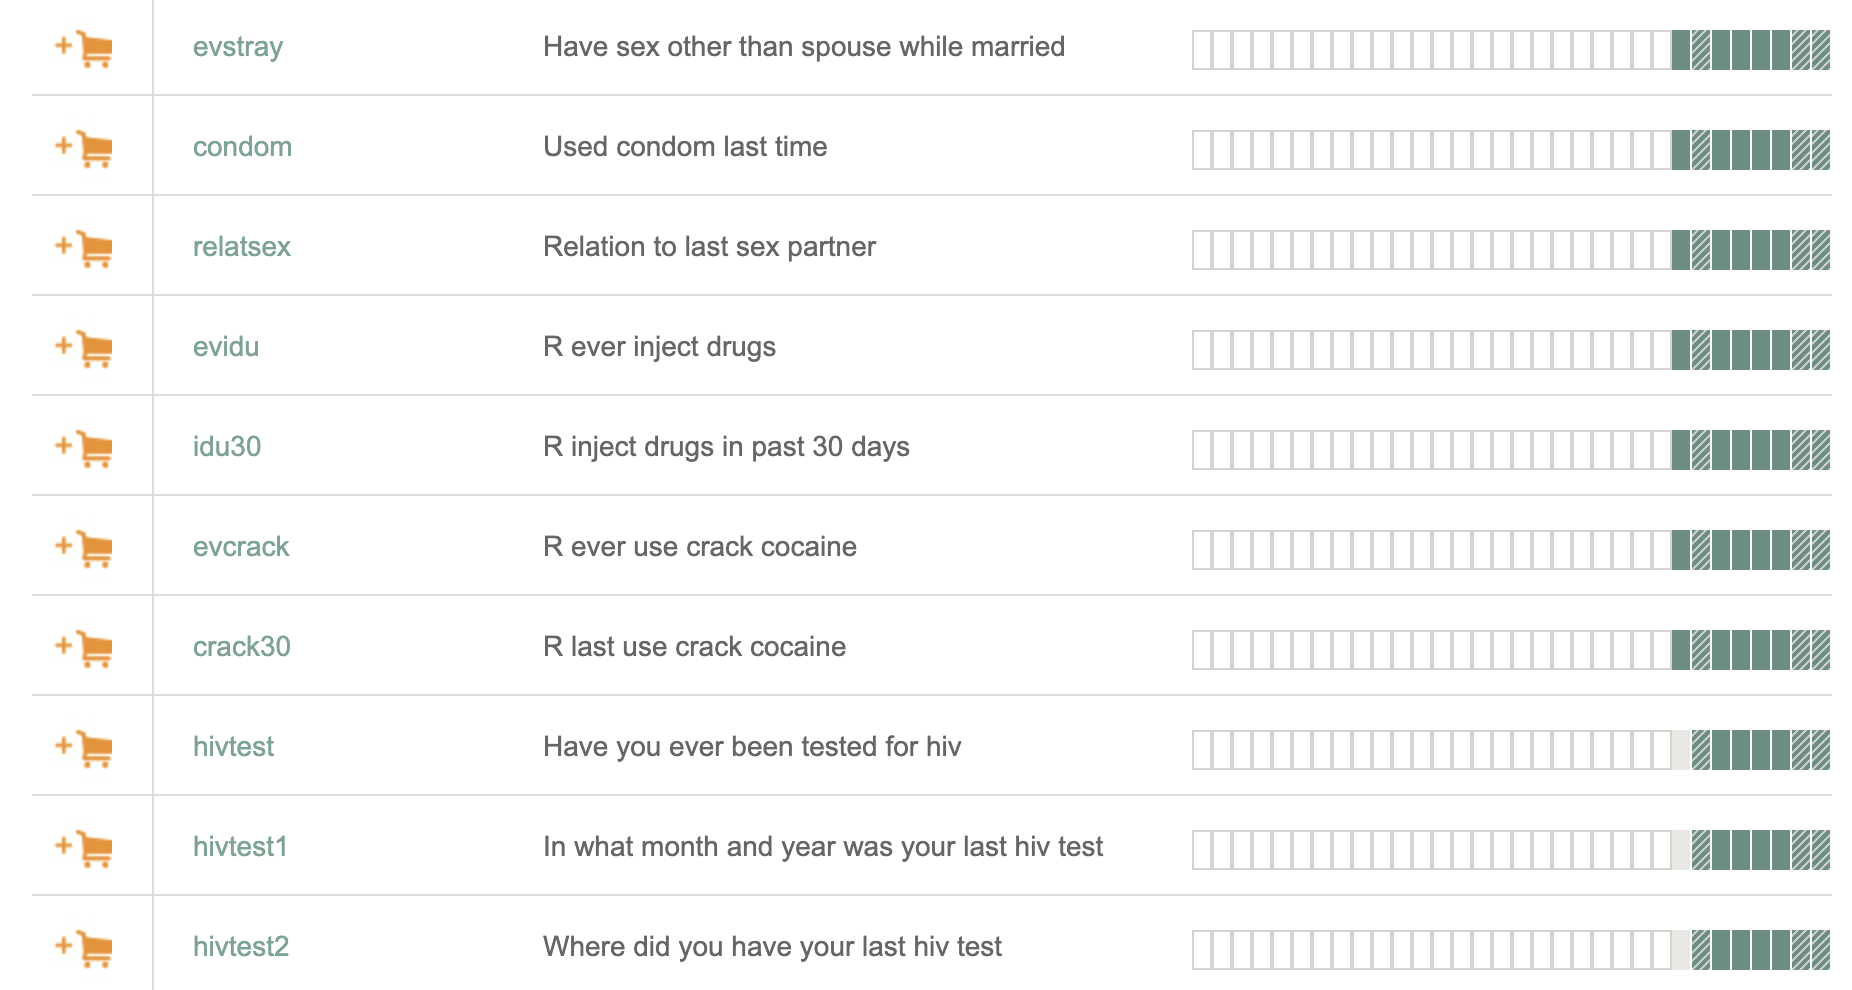
The General Social Survey is incredibly nosey. It is run every other year, and they ask people about their basic demographics as well as a litany of questions about people’s views (“do you think you can trust strangers?”, their private lives (“do you smoke marijuana?), and political positions (“do you think the military receives too much funding?). There’s a question in that survey for everyone. As of writing this, there are 6110 questions that have been asked as part of the survey since 1972. Most questions aren’t asked every year, but some are allowing researchers to study trends in people’s views. Really, I can’t express how many different things they ask about. I mean really, look at how personal these questions get below in this brief excerpt I took from the website. Those aren’t questions I would feel comfortable asking on a first date, but the General Social Survey asks them for a representative sample of Americans.
One other place you can find data that might be of use is from cities themselves. Cities collect data on their citizens all the time (locations of car accidents, arrest records, permit filings…). As part of the open data movement, citizens have asked that the data be available and accessible in return.
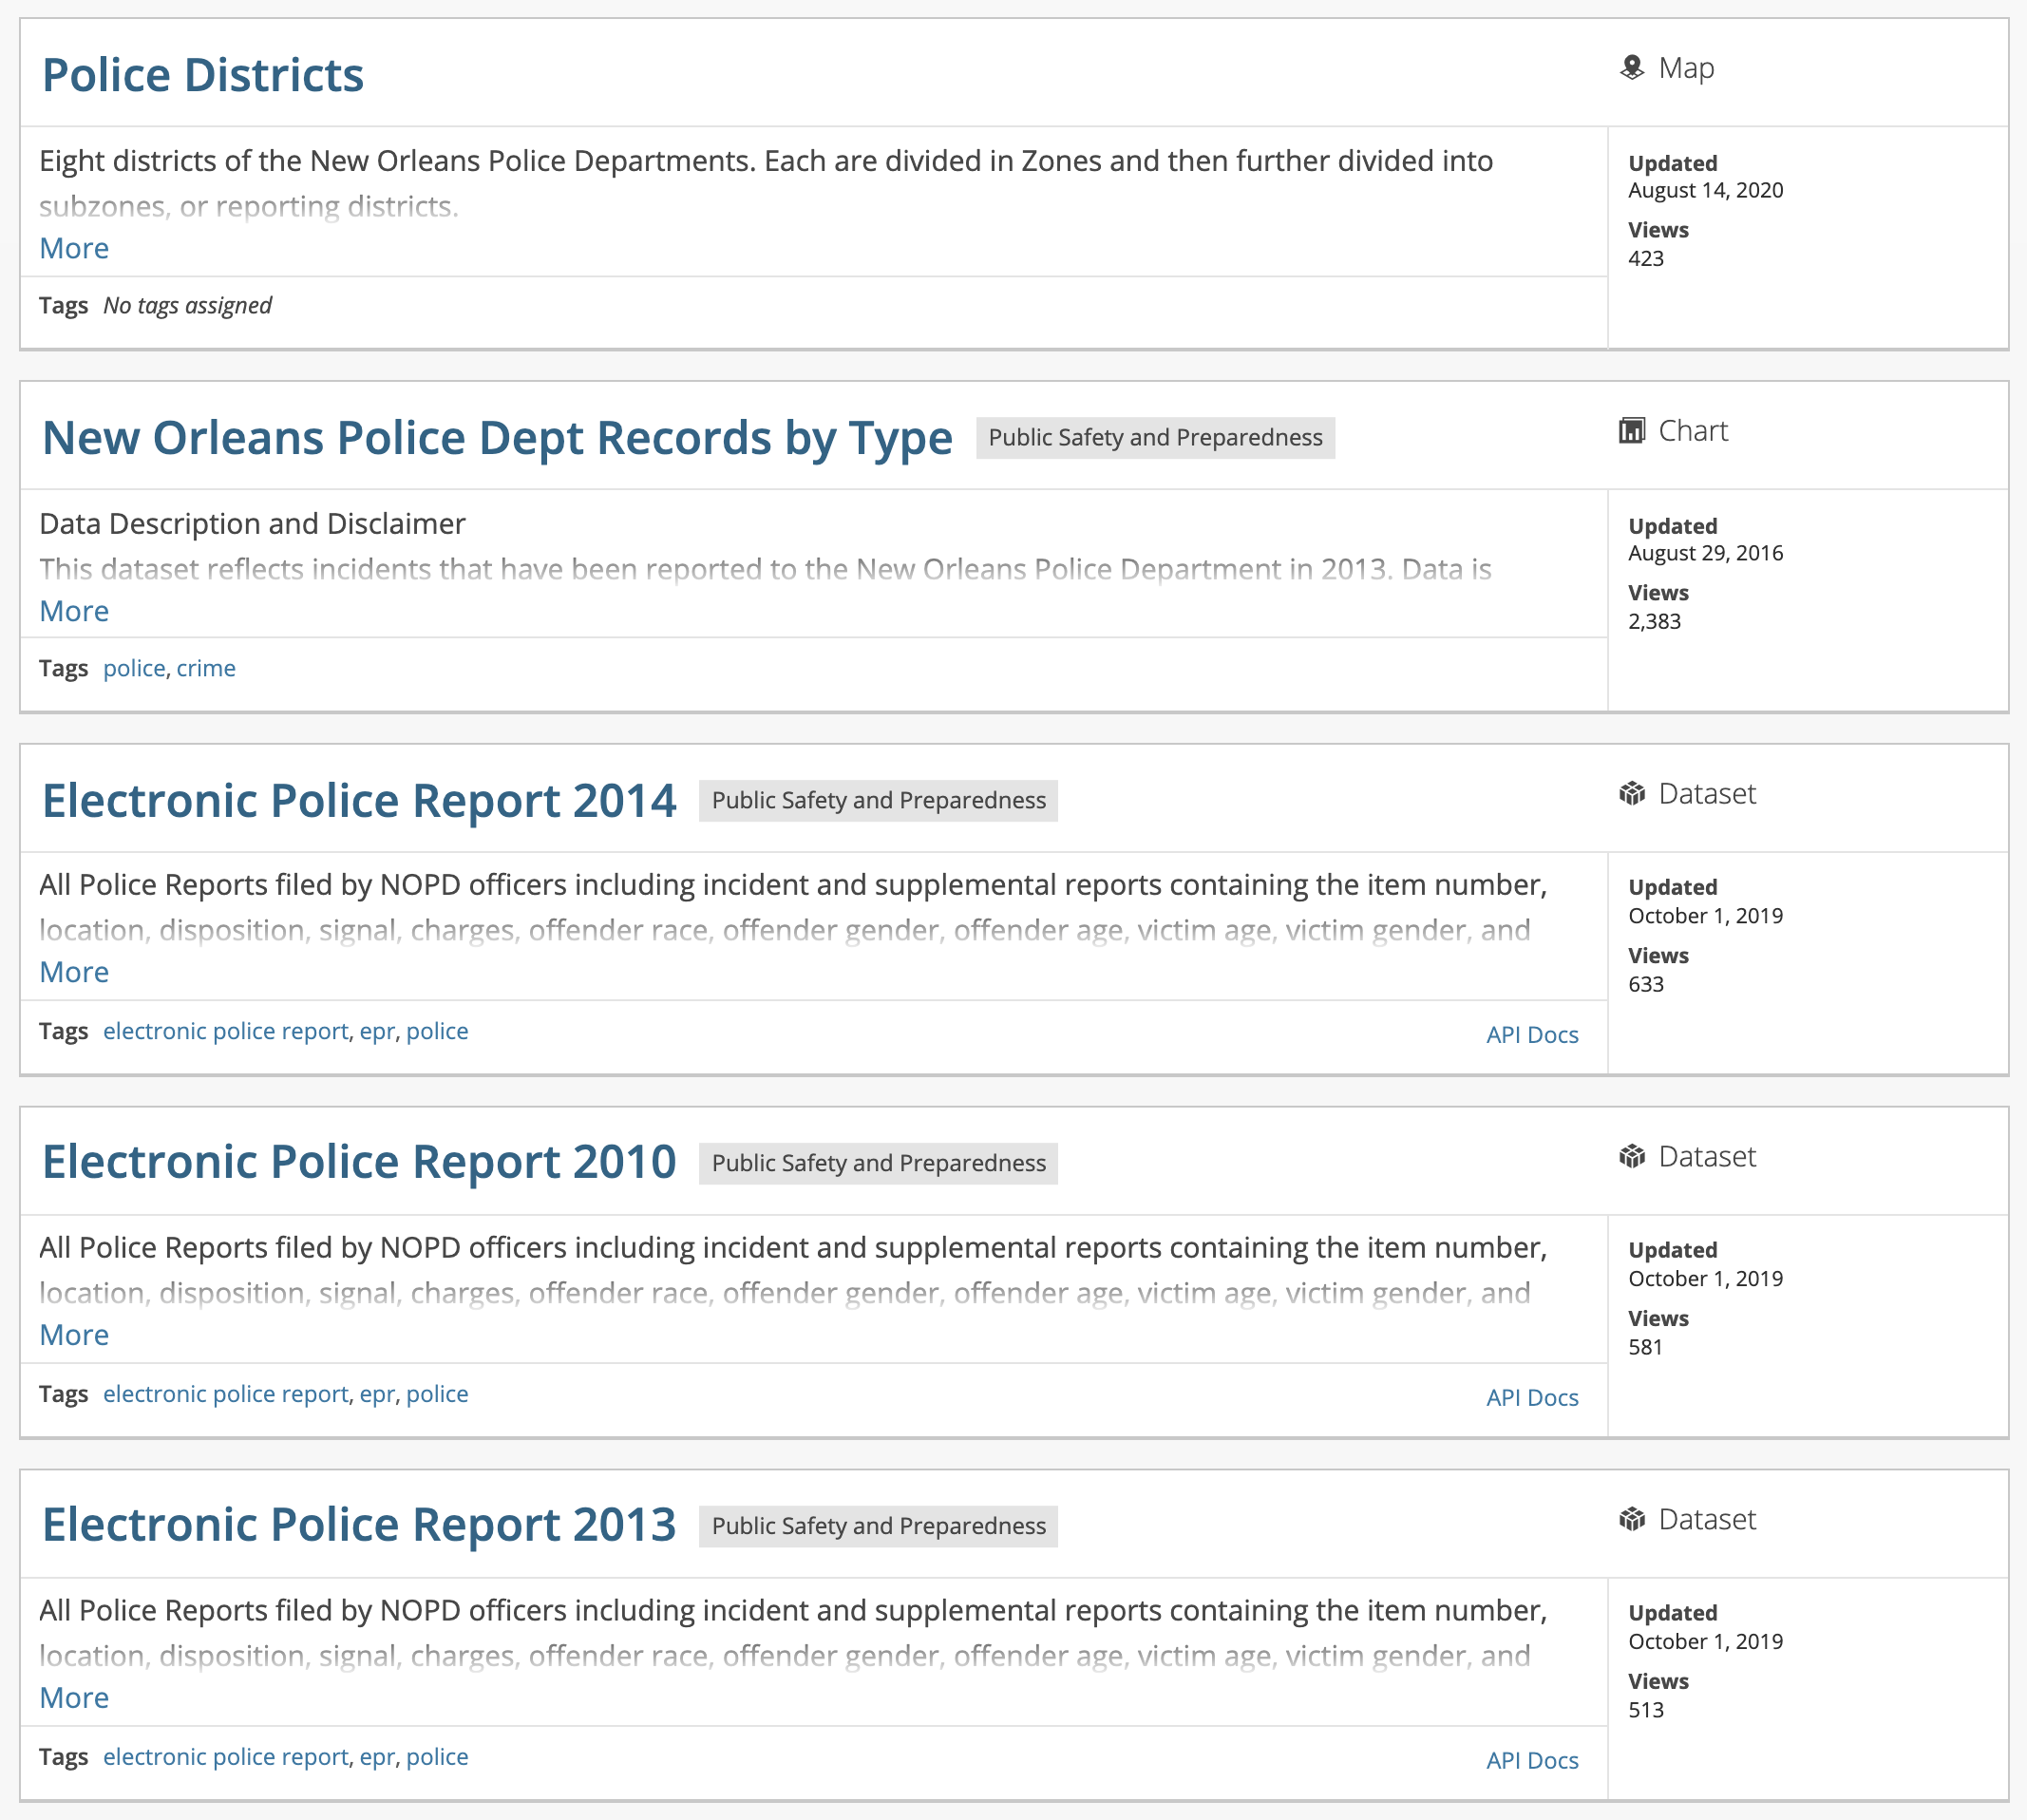
Most large cities now have a website where they publish publicly available versions of their data. You can connect this data to census data to understand how services match with community demographics, and answer other questions about how your city is being managed. Take a look at a partial list of the data that’s available related to police and crime for the City of New Orleans below. Again, a very partial list, and I’d encourage you to go search for your city’s data depository to see what is available.
Rather than try and continue listing data sources, take a look at this list someone elese made that seems pretty complete and interesting. There are a lot of interesting reseach questions yet to be answered just with the data listed on that blog.
Using these publicly available data don’t themselves constitute a different method in the way that an experiment does. But I wanted to include this section in part as a way to set up the rest of the book. Quantitative analysis might seem challenging, but it’s also very accessible because there is so much data available right now. If you can begin the understand the skills in the rest of this book, you can be on your way to doing independent research answering significant questions without having to develop a sampling frame or writing a questionnaire. That said, it’s important to understand those earlier sections so that you know where your data came from if you’re getting it online. Most chefs know a lot about raising cows, because they want to understand exactly where their beef is coming from.