5 Quantitative research and surveys
In the previous chapter we talked about different types of research. There we categorized research into three categories: secondary, applied, and academic. However, there are other ways to group research. One common distinction is between quantitative and qualitative research. Neither type is better or worse that the other, they’re simply different approaches to building new knowledge that can be more or less appropriate based on the goals of your research. In this chapter we’ll focus on quantitative research, and more specifically using surveys to build quantitative data. In the next chapter we’ll focus on qualitative research and talk about interviews. Those are the two most common ways of collecting data in the social sciences, although they are not the only ways (more are described in chapter 7).
5.1 Quantitative or qualitative
As was mentioned above, two types of research are quantitative and qualitative. We’ll describe qualitative research more in the next chapter, but it’s worth pausing to talk about both types here before we go into the specifics on either. The choice of which to use should be driven by the research question you’re pursuing. The most readily apparent difference will be in the data you’ll use. At its most basic level, quantitative data is numbers, whereas qualitative data focuses on words. You can analyze the numeric data using techniques which give you statistically robust answers to your questions. Qualitative data involves interpreting the words of respondents, and can provide answers all the same, but they won’t often carry the same statistical evidence.
| Qualitative | Quantitative | |
|---|---|---|
| Purpose | Understanding underlying motivations or reasons; depth of knowledge | Generalize results to the population; make predictions |
| Sample | Small and narrow; not generally representative | Large and broad |
| Method | Interviews, focus groups, case studies | Surveys, web scrapping |
| Analysis | Interpretative, content analysis | Statistical, numeric |
5.2 Using a survey
Let’s say you’re setting out to research what makes people happy. You’ve read the previous chapter, so you know the importance of defining your concepts. You’ve done that, and decided that the best way to understand how happy people are is to have them rate their level of happiness on a scale of 0-10. Great, but how are you going to get people to give you that information?
One way would be with a survey. A survey involves collecting data from a group of people by administering a standardized questionnaire. The questionnaire, or survey can be written documentation that is administered either in person (door-to-door), on paper (through the mail), by phone, or online. Survey research is a quantitative method that uses predetermined questions that aim to describe or explain features of a very large group or groups.
Surveys are really common. The way we know how many people are in the United States is based on a survey (US Census). How do we know the unemployment rate in the United States? A survey. How do TV stations call the election as soon as polls close, before 98% of ballots have been counted? Surveys.
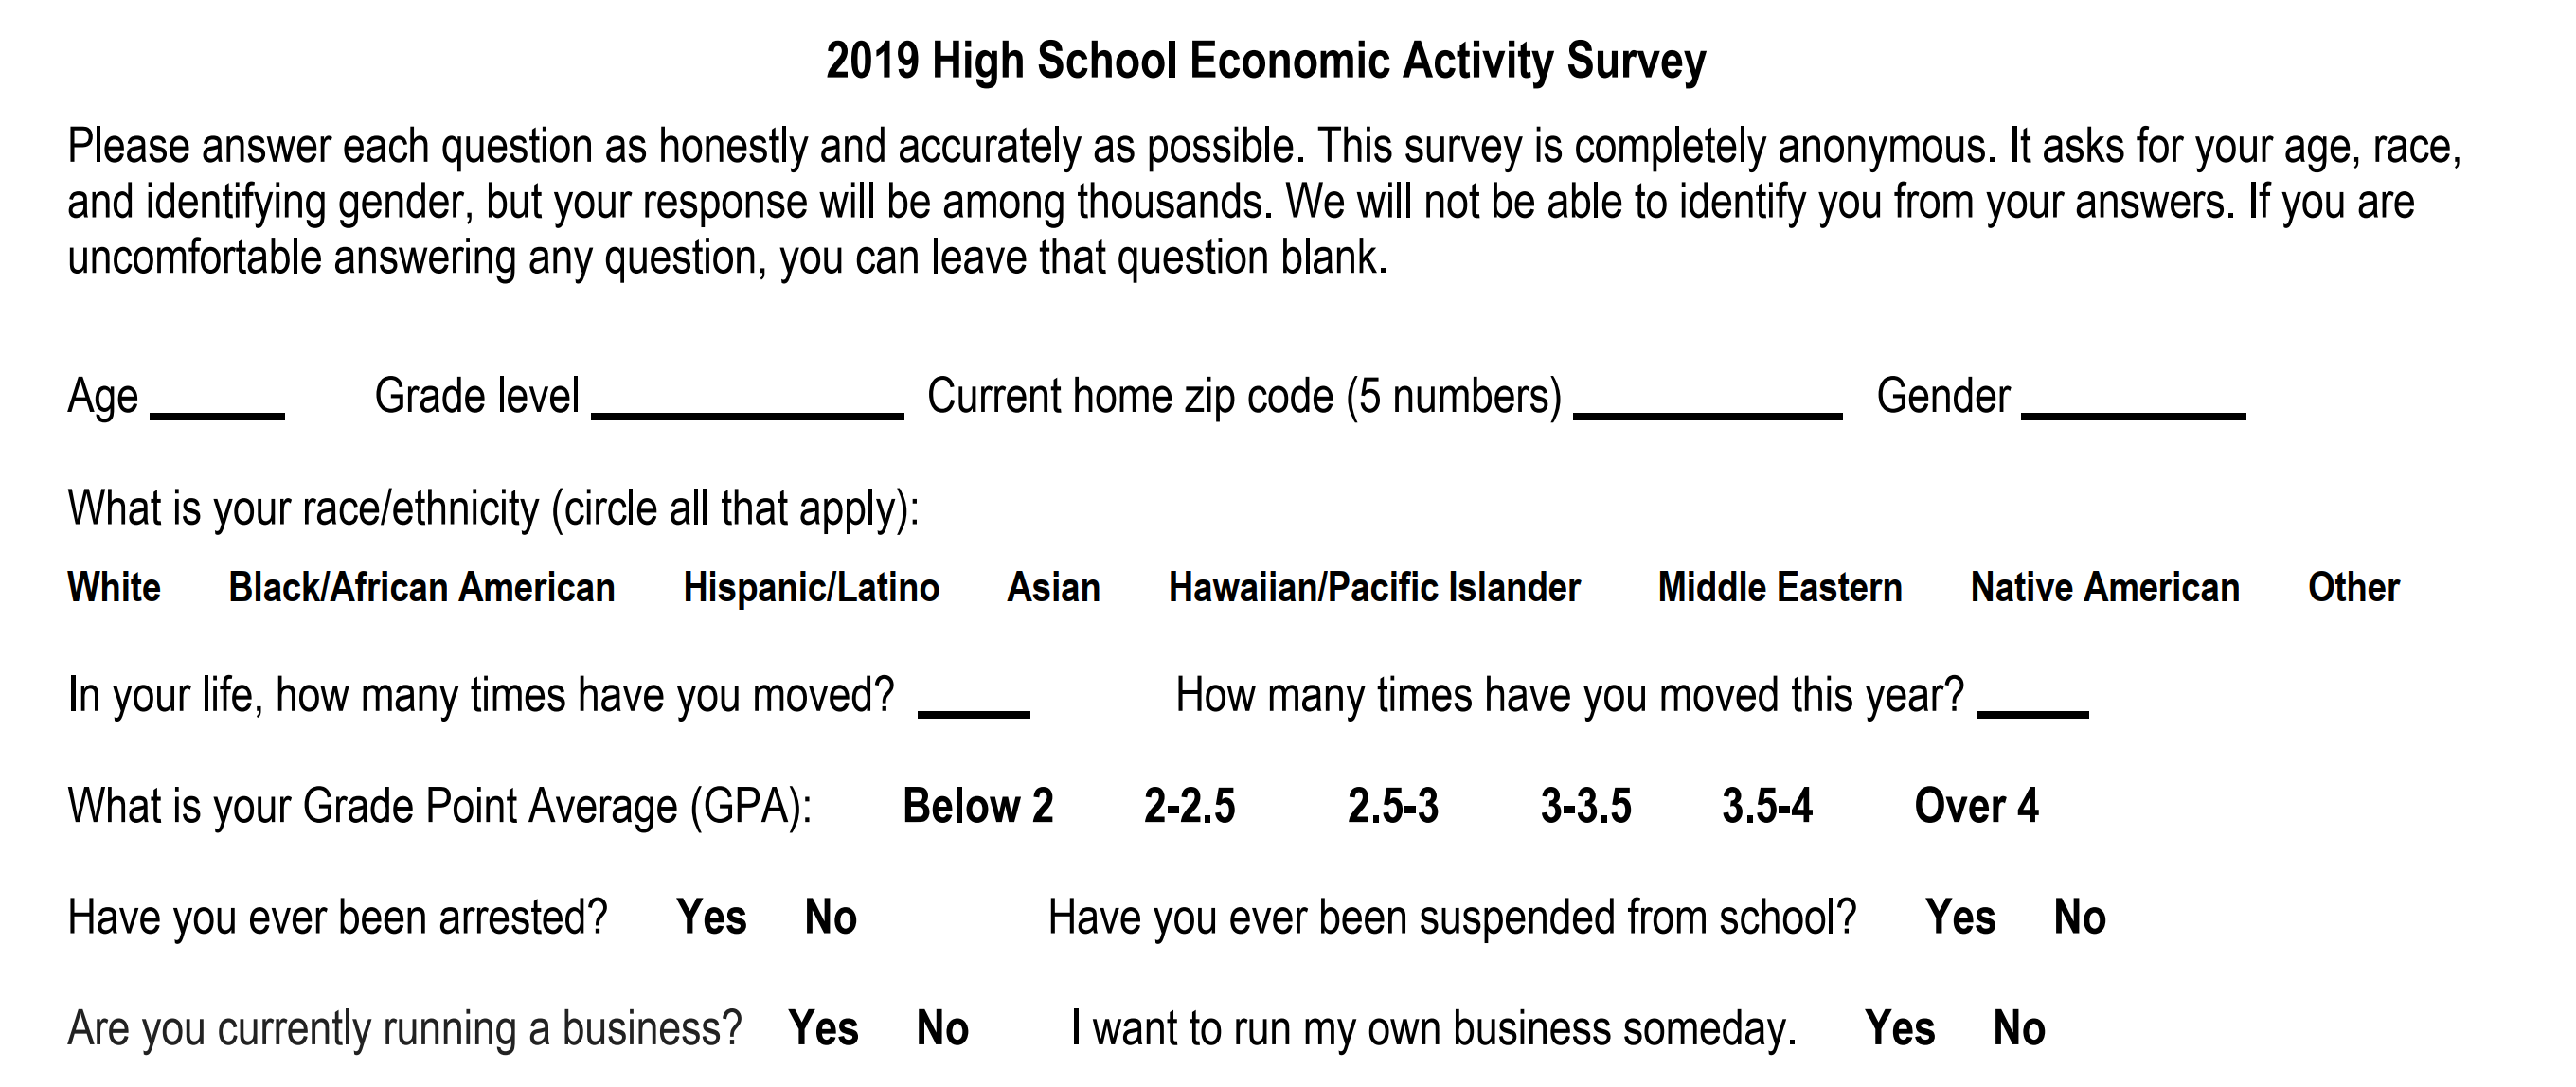
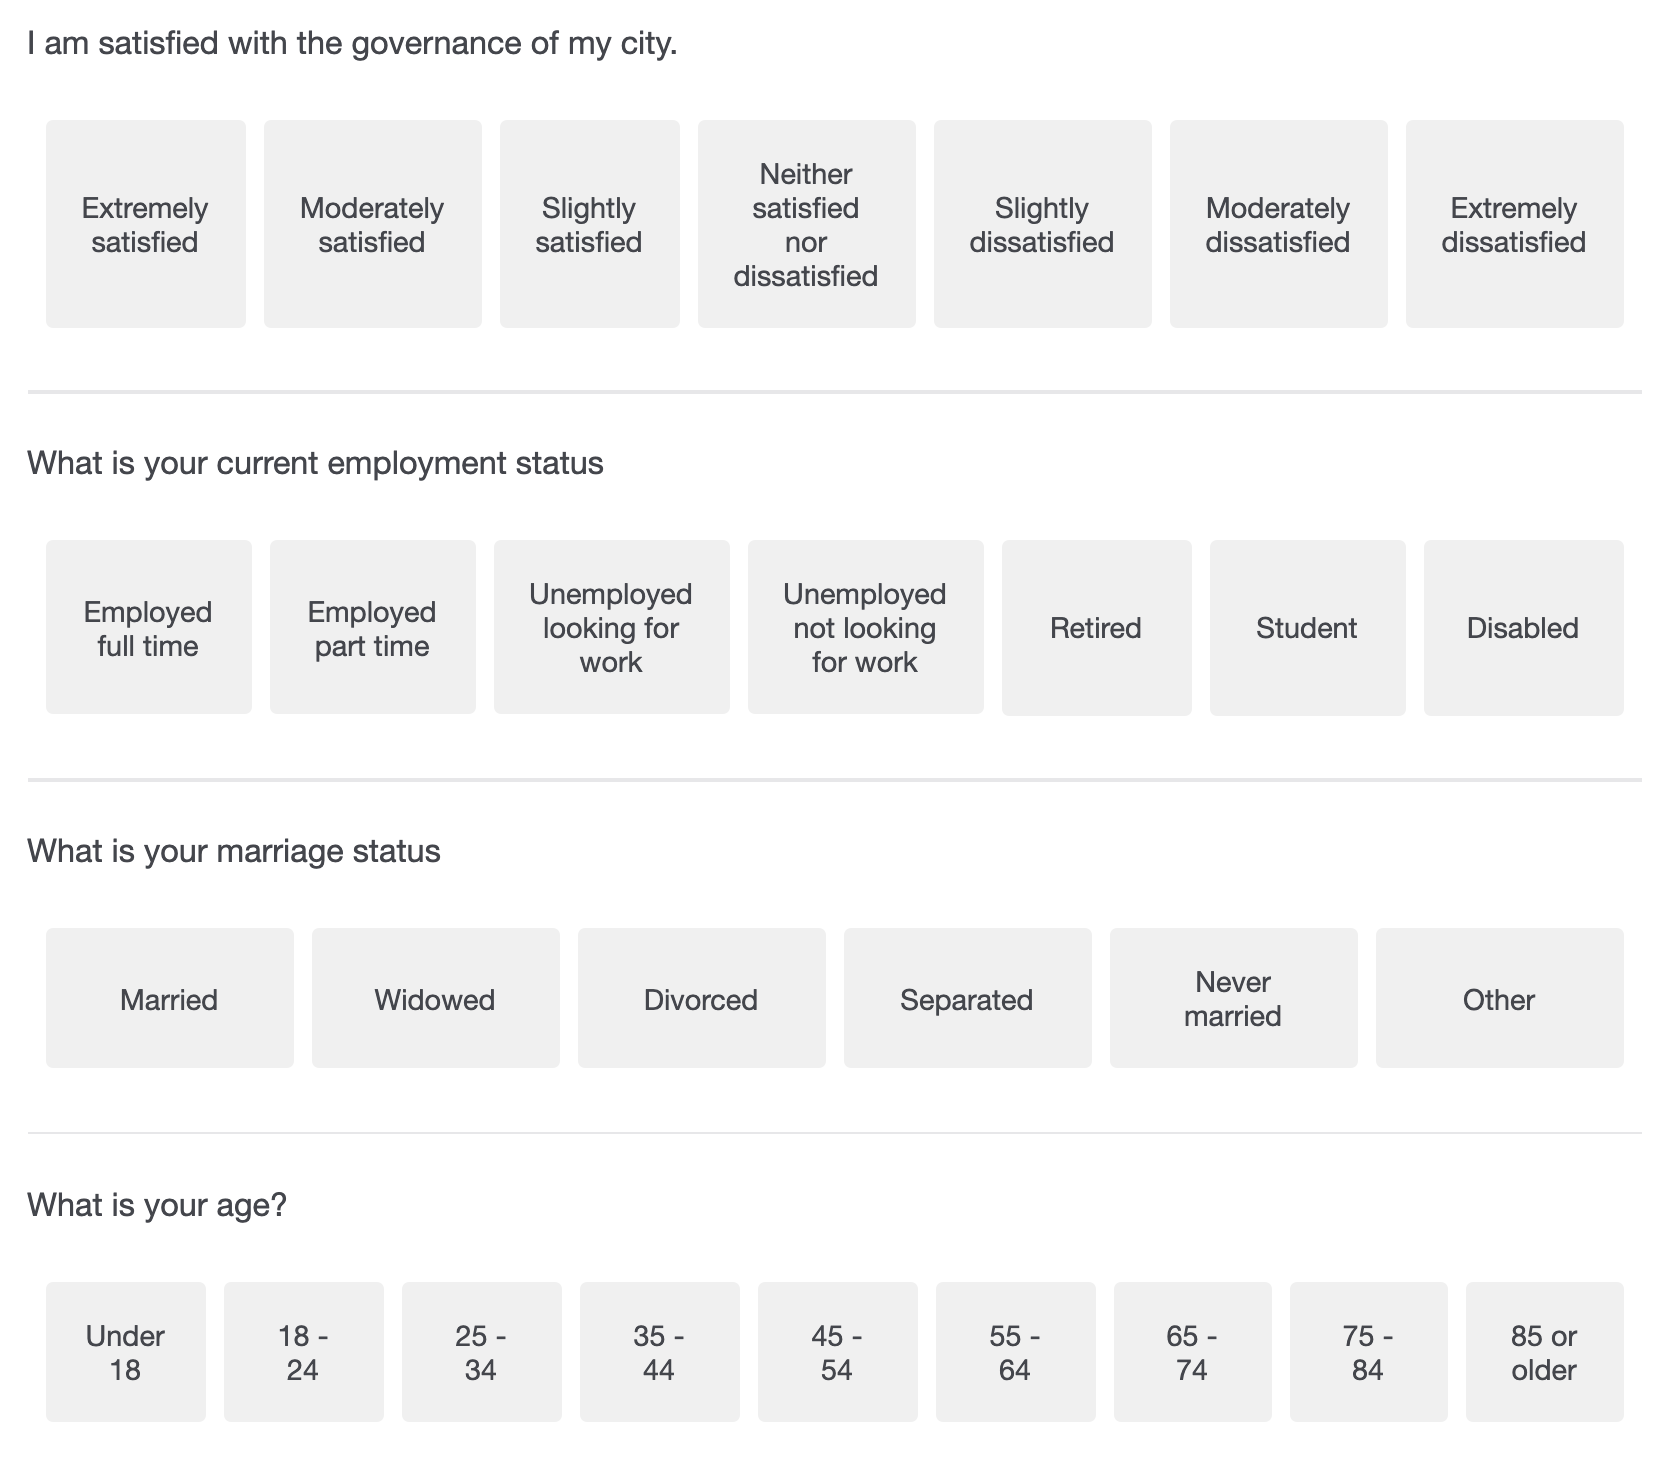
In this chapter I’ll try to walk you through the steps of developing a survey project. Let’s jump to the conclusion though, to make sure that we’re all on the same page. Below is a portion of a survey. It’s not the whole thing, just a few of the questions included on that survey. But that’s a survey, a form that asks respondents set questions and provides them space to answer them. There’s lots of ways you can deliver the survey, there’s a limitless number of questions you can ask, and you’ll still have to figure out who you’re going to survey. But that’s the end goal.
We’re going to talk about a lot of minutiae in this chapter, but it’s all important to doing a good survey.
5.3 Why survey?
The reason that researchers and society rely on surveys is because of their ability to provide information, even for people not asked to provide data. If you’re developing your happiness survey, are you going to gather the information from all 8 billion people on the planet? Imagine trying to get data about everyone just in your own neighborhood. That would be a challenge, to put it kindly. Luckily, you don’t have to. Researchers have developed ways to understand everyone based on the characteristics of a few.
Surveys, if correctly developed, can provide reliable information that can be generalized to the population. Generalizability means that what we learn from the sample (53% of the respondents like vanilla ice cream) can be related to everyone (53% of people likes vanilla ice cream). To formulate projections or broad-based conclusions, you need to conduct surveys that represent the public at large, which means including relevant groups (based on race, gender, age group, etc.) from a larger population in the correct proportions. We’ll talk more about populations and samples in a future chapter, but it’s worth knowing what’s possible.
Because of the ability to generalize the information we gather, surveys are often a cost effective form of research. The physical production of a survey questionnaire is relatively inexpensive. Even if you mail your survey and have to pay for postage, it’s far less expensive and time consuming than it would be to interview dozens or hundreds of respondents in person. However, it can take significant time to identify who you want to survey.
While surveys are advantageous in many respects, they’re not perfect! One of the biggest drawbacks with surveys is their inflexibility, which is to say, your questionnaire is your only means of collecting data. All you have is their answers to the questions, and if they don’t understand or interpret on of your questions correctly you might not get good data back. In addition, people aren’t great at accurately answering survey questions, even when they try. We’ll talk about ways to address that concern later though.
5.4 How to survey
There are a variety of ways in which a survey can be administered. Remember, how you conduct your survey—as well as when you administer it—will impact your response rate. Ideally, 100% of the people you send your survey to would send it back, but that will never happen. People are busy, they lose them, or they might just not care. Even offering a reward (money, gift cards, etc.) wont guarantee people will take the time to respond. Thus, it’s important to structure your survey in a way that helps to secure as many responses as possible. The response rate just refers to the percentage of people that the survey was sent to that you recieve a response from.
A traditional way to administer surveys is in the form of a self-administered questionnaire, a paper-and-pencil survey, in which participants are given a set of questions they respond to and then return either by mail or in person. Alternatively, it is increasingly common and cost effective to administer surveys online. Alternatively, you can also see people in person (door to door or standing in public spaces) and ask them to fill out the questionnaire.
The 2020 U.S. Census, for example, includes options to respond by mail, phone or online in an effort to produce a high response rate and more complete data.
5.5 Types of Surveys
An additional considerations is how you want to administer your survey with respect to time, and whether you want to survey your population at a single point or over an extended period.
One option is a cross-sectional survey, which is given at just one point in time. Such a survey will tell you how things were for the respondents at the particular time, such as who they would support in the presidential election in the third week of August. The respondents answers might change before and after the survey, so you’re essentially getting a snapshot of views and feelings at that moment.
A longitudinal survey, on the other hand, lets you make observations over an extended period of time. There are several types of longitudinal surveys you can conduct. Three of the mains ones are: trend, panel, and cohort surveys.
Trend surveys, as the name suggests, measure trends. If you conduct a trend survey, you are studying how people’s thoughts and views change over time. For example, if you want to know how Americans’ views on healthcare have changed over the past 10 years, you would ask the same questions to people at different points in time over a 10-year period. You wouldn’t have to survey the same people each time because as a researcher you’re more interested in the generalized trend over time than who is being sampled each time. What is critical is asking the same question worded the same way, to capture changes in people’s views.
A panel survey, on the other hand, focuses on the same people each time the survey is administered. An example of this would be if you studied the effects of exercise on 100 kids over a 10-year period beginning at age 12 and following them until they are 22. These surveys can produce impressive results. On the downside, however, panel surveys are costly and difficult to manage. It’s hard to keep track of dozens of people over a period of many years as they relocate, change jobs or names and pass away. As such, panel surveys take considerable resources and investment to administer.
A third type of longitudinal survey is a cohort survey, in which you identify a category of people of interest then randomly select individuals from within that category to survey over time. It is important to note that you don’t have to pick the same people each year; however, the people you do pick must fall into the same categories that you have previously selected. For instance in 1951 the British Doctors Study began by studying people who were exposed to smoking to understand whether it had an impact on the likelihood of lung cancer. They matched people who did smoke to non-smokers, and planned to continue tracking those two groups until 2001. However, it only took until 1956 for them to find convincing evidence that smoking increased cancer rates.
Which type of survey is best for you? It depends on the nature of your research project and the questions you’re trying to answer. Generally speaking, longitudinal surveys give us more information about trends, tendencies, opinions or ideas over a long period of time. Cross-sectional surveys have limited explanatory power because they only capture one moment. For instance, if I do a survey and find that healthier people are more likely to report riding their bike, do they bike because they’re healthy or are they healthy because they bike? We can’t tell just from that survey. However, if we survey the same people multiple times and see how biking and health change over time we can better identify the causal effect.
So why don’t we make every survey longitudinal? Because they can be costly and difficult to administer, and your research work may not require a temporal data analysis. Getting a high response rate on one survey is difficult, getting people to respond multiple times just compounds the problem. What’s important is that you understand the pros and cons of each type of survey and use the method that will produce, for you, the most meaningful data.
5.6 Writing Effective Questions
With survey’s it isn’t enough to just ask a question. You have to ask the right question. To get good information you have to be aware of all the ways your question could be misunderstood or could produce unreliable information. And first and foremost, you have to be aware that the thing you’re studying (humans) are complicated. We lie. We answer incorrectly. We randomly guess and answer questions we don’t have an answer for. We’re not very good at assessing ourselves. That’s why everyone makes the joke about 75% of drivers believing they’re above average drivers.
Let’s work through some of the things that can go wrong in your survey questions.
It is critical to avoid creating questions that could prompt respondents to give a socially desirable answer instead of an accurate one. In research, social desirability refers to the idea that respondents will try to answer questions in a way that will present them in a favorable light. Imagine asking a survey question regarding sensitive topics like abortion or racism to respondents. Some people might answer those types of questions without stating their true belief in order to appear socially acceptable, and so in general we know people will under report these behaviors. That makes them more difficult to study through a survey, but not impossible.
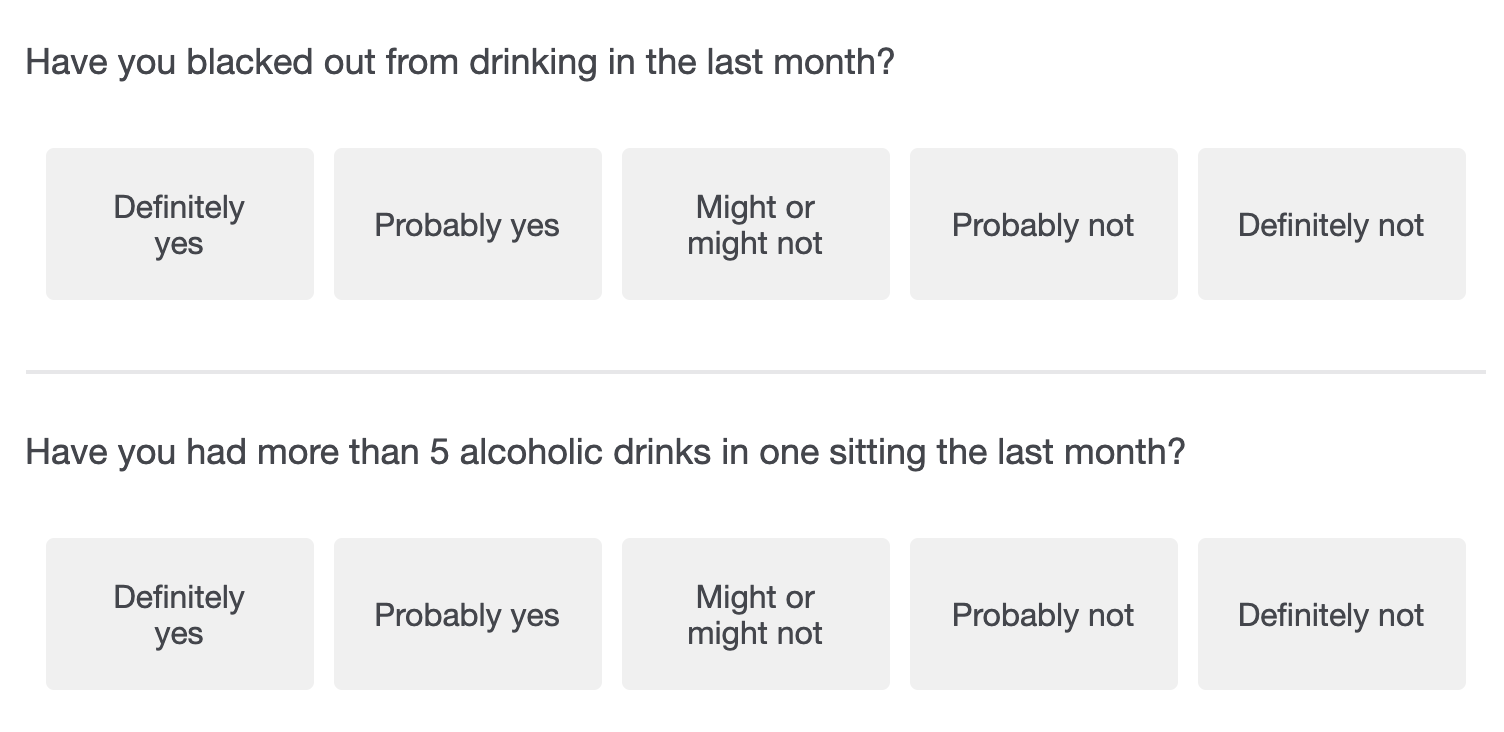
To take one example, what do you do if you want to run a survey on binge drinking at colleges? Simply asking a direct question like below probably wont produce accurate results.

One approach would be to ask the question multiple ways, giving people more opportunities to answer. And you’ll likely want to be specific in your questions. People might not consider themselves to be binge drinkers (or unfaithful, or racist, etc.), but if you ask whether they’ve had more than 5 drinks in one sitting the past week, they may be more honest about that without realizing that might make them a binge drinker. And asking factual-behavior based questions may help to avoid incorrect self appraisals.
Another problematic survey question is one that contains multiple questions, yet is posed as one single question. This is called a double-barreled question and has the potential to confuse the respondent. Take the question below for example about recent movies. If someone answers ‘Yes’ is it because they think new movies are too long or unoriginal, or both? We don’t know, it might be both, it might just be one. If you find the word “and” or “or” in your question, seriously think about breaking it into two separate questions.
 There aren’t just questions to avoid. There are also types of questions you might want to consider including, depending on what your survey is attempting to understand.
As we’ve discussed, people will lie and may do a poor job of accurately reporting information on themselves. In addition, there is no one single understanding of many terms, such as toughness, happiness, risk-aversion, etc. As such, you can’t just ask a respondent if they’re “tough” and expect to get an accurate response. A better strategy might be to ask multiple overlapping questions related to toughness, which together will help to approximate their personality.
You might expect people that are kind or optimistic will respond the same to every question, but that rarely happens. Changing the direction of a question from a positive wording to a negative wording can really shift how people evaluate themselves. For instance, asking whether someone is considerate, and someone is not considerate can produce opposite reactions. People typically aren’t kind or unkind, they exist on a spectrum between those two extremes. Asking multiple questions helps to identify where they exist within that continuum. For instance, see the questions below on toughness, which are pulled from the International Personality Item Pool, a database of survey questions that can be used to measure different personality traits. Taking these questions together and using them to measure whether someone is very tough, or sorta tough, or not tough, will give a more accurate result.

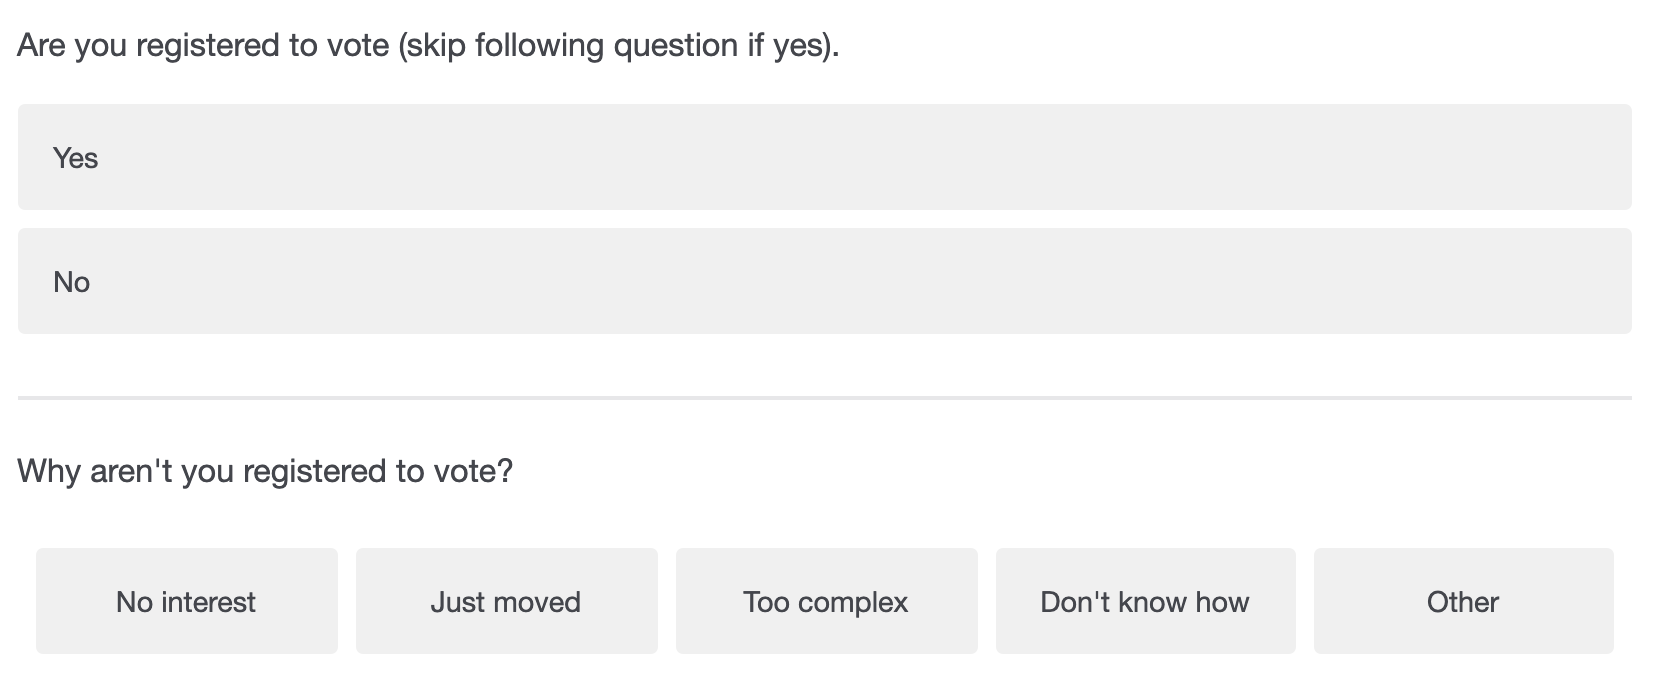
If you choose to only ask some questions about issues that only a few of your respondents have had experience with or may find relevant, it’s a good idea to use a filter question in your survey. A filter question is designed to identify some subset of survey respondents who are asked additional questions that are not relevant to the entire sample. Online surveys make filter questions a lot easier, because you can manually control what questions respondents see based on their answers. In the example below, we have to trust that the respondent understands whether to skip the next question or not.
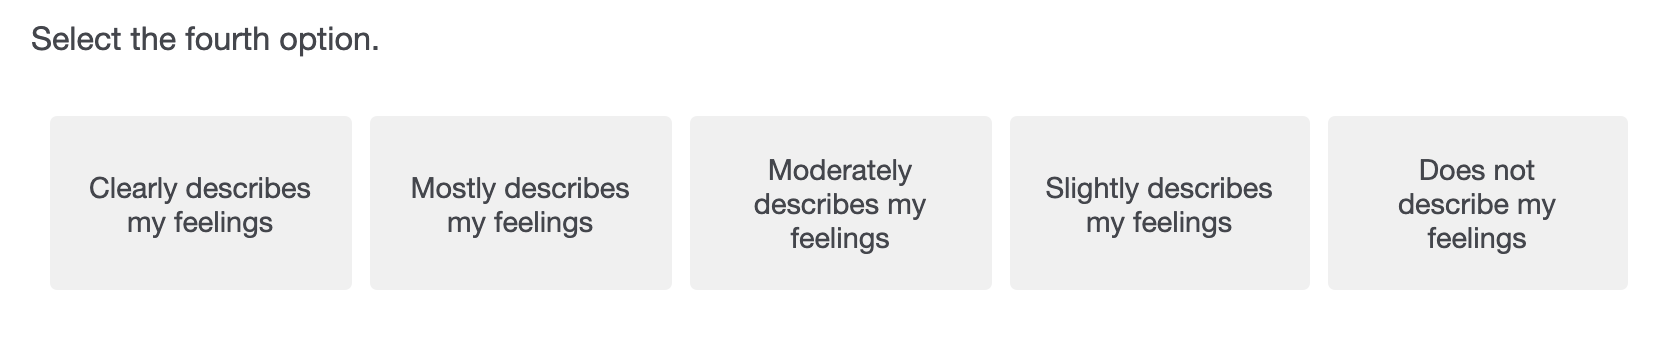
You also may want to make sure that your respondents are reading the questions. Let’s be honest, we’ve all filled out a survey and just started randomly checking boxes to get it done faster. You can add an attention filter by telling the respondent which option to choose, to make sure they’re taking the time to answer accurately. Once you see who gets the attention filter question wrong, you can remove their answers from the final data, since you won’t know whether they answered any of the other questions correctly.
5.7 Response Options
So, you’ve created clear, concise, and understandable survey questions, but have you put much thought into your response options? Response options are the answers that you provide to the people taking your survey. Researchers can choose from a number of response options, but like everything else in surveys there’s no one right option for all questions. The best option for any question will be determined by the purposes of the research and the question being asked.
5.7.1 close-ended vs. open-ended
One crucial consideration is whether your questions will be close-ended or open-ended. A close-ended question means the respondent must choose between a limited number of pre-determined responses to the question. Close-ended questions are often used in quantitative research because the responses can be counted up more readily (55% of respondents said Yes to supporting free puppies for all, etc.).
When designing responses to close-ended questions, it’s important to ensure that the responses offered are both exhaustive and mutually exclusive. Making responses exhaustive means that every possible answer that a respondent could have can fit into one of the responses. When responses are mutually exclusive, on the other hand, there are no possible answers a respondent could have that might fit into more than one category simultaneously. Imagine a survey in which respondents are asked how many children they have. They can select from the following responses: “Zero”; “One”; “Two”; “Three”; and “Four or More”. The responses are exhaustive because whether the respondent has no children or fifty children, there is an accurate response for them to choose. The responses are mutually exclusive as well because no matter how many children they have, there is only one accurate response. Making response options both exhaustive and mutually exclusive helps ensure that every respondent can answer questions effectively and helps improve the accuracy of the data collected by reducing errors. If the responses can’t be mutually exclusive you can also allow respondents to choose multiple options.
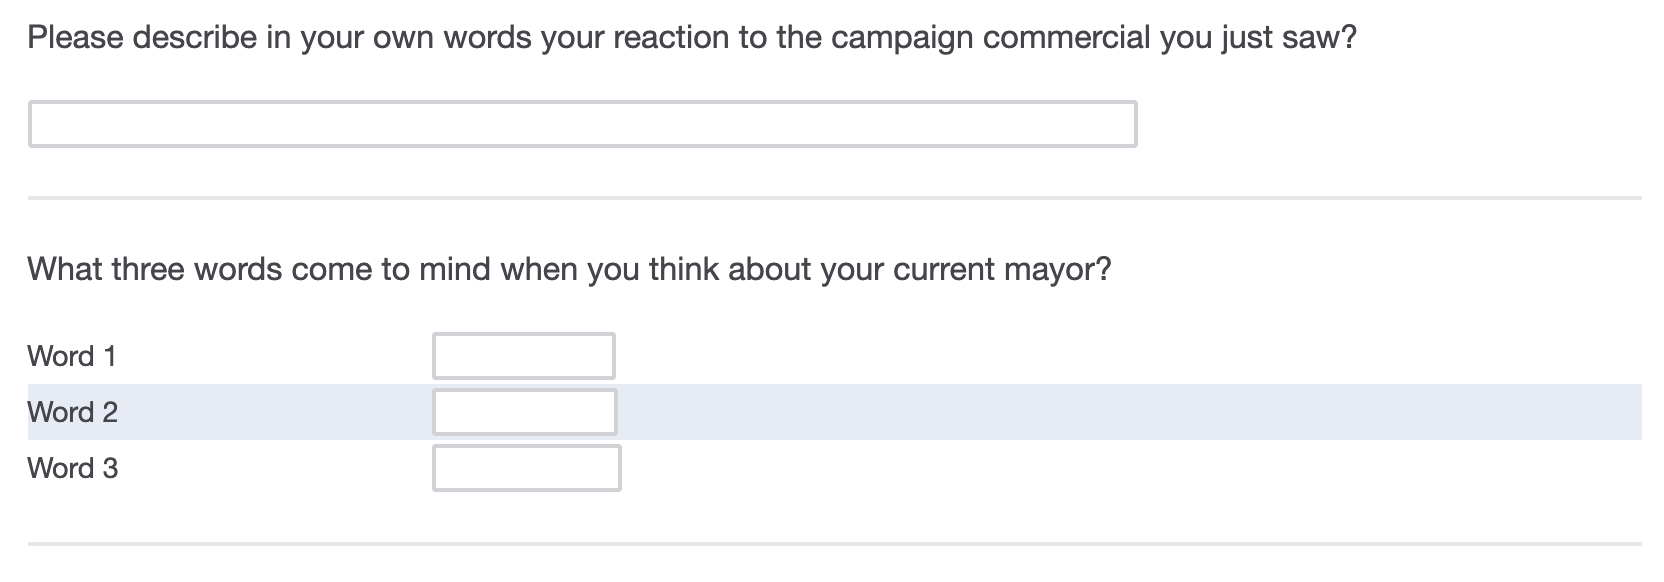
Survey questions can also be open-ended, meaning the respondent has the opportunity to answer the question in their own words, without pre-determined response options. Open-ended questions have the advantage of allowing the respondent to share more detailed information, and to share opinions or information that the researcher might not have thought to ask about. On the other hand, analysis of open-ended questions can be more difficult because the responses are harder to measure. Open ended questions also take a lot more time from your respondents and can lead to fatigue, so they should generally be used sparingly.
5.8 Scales
Giving people only the options to select yes or no can make it difficult for respondents to answer honestly. Do you like to break the rules? You might think sometimes, if you really need to, but you don’t break the rules all the time. So would you say yes or no? Giving people a range of responses will allow them to give a more accurate response.
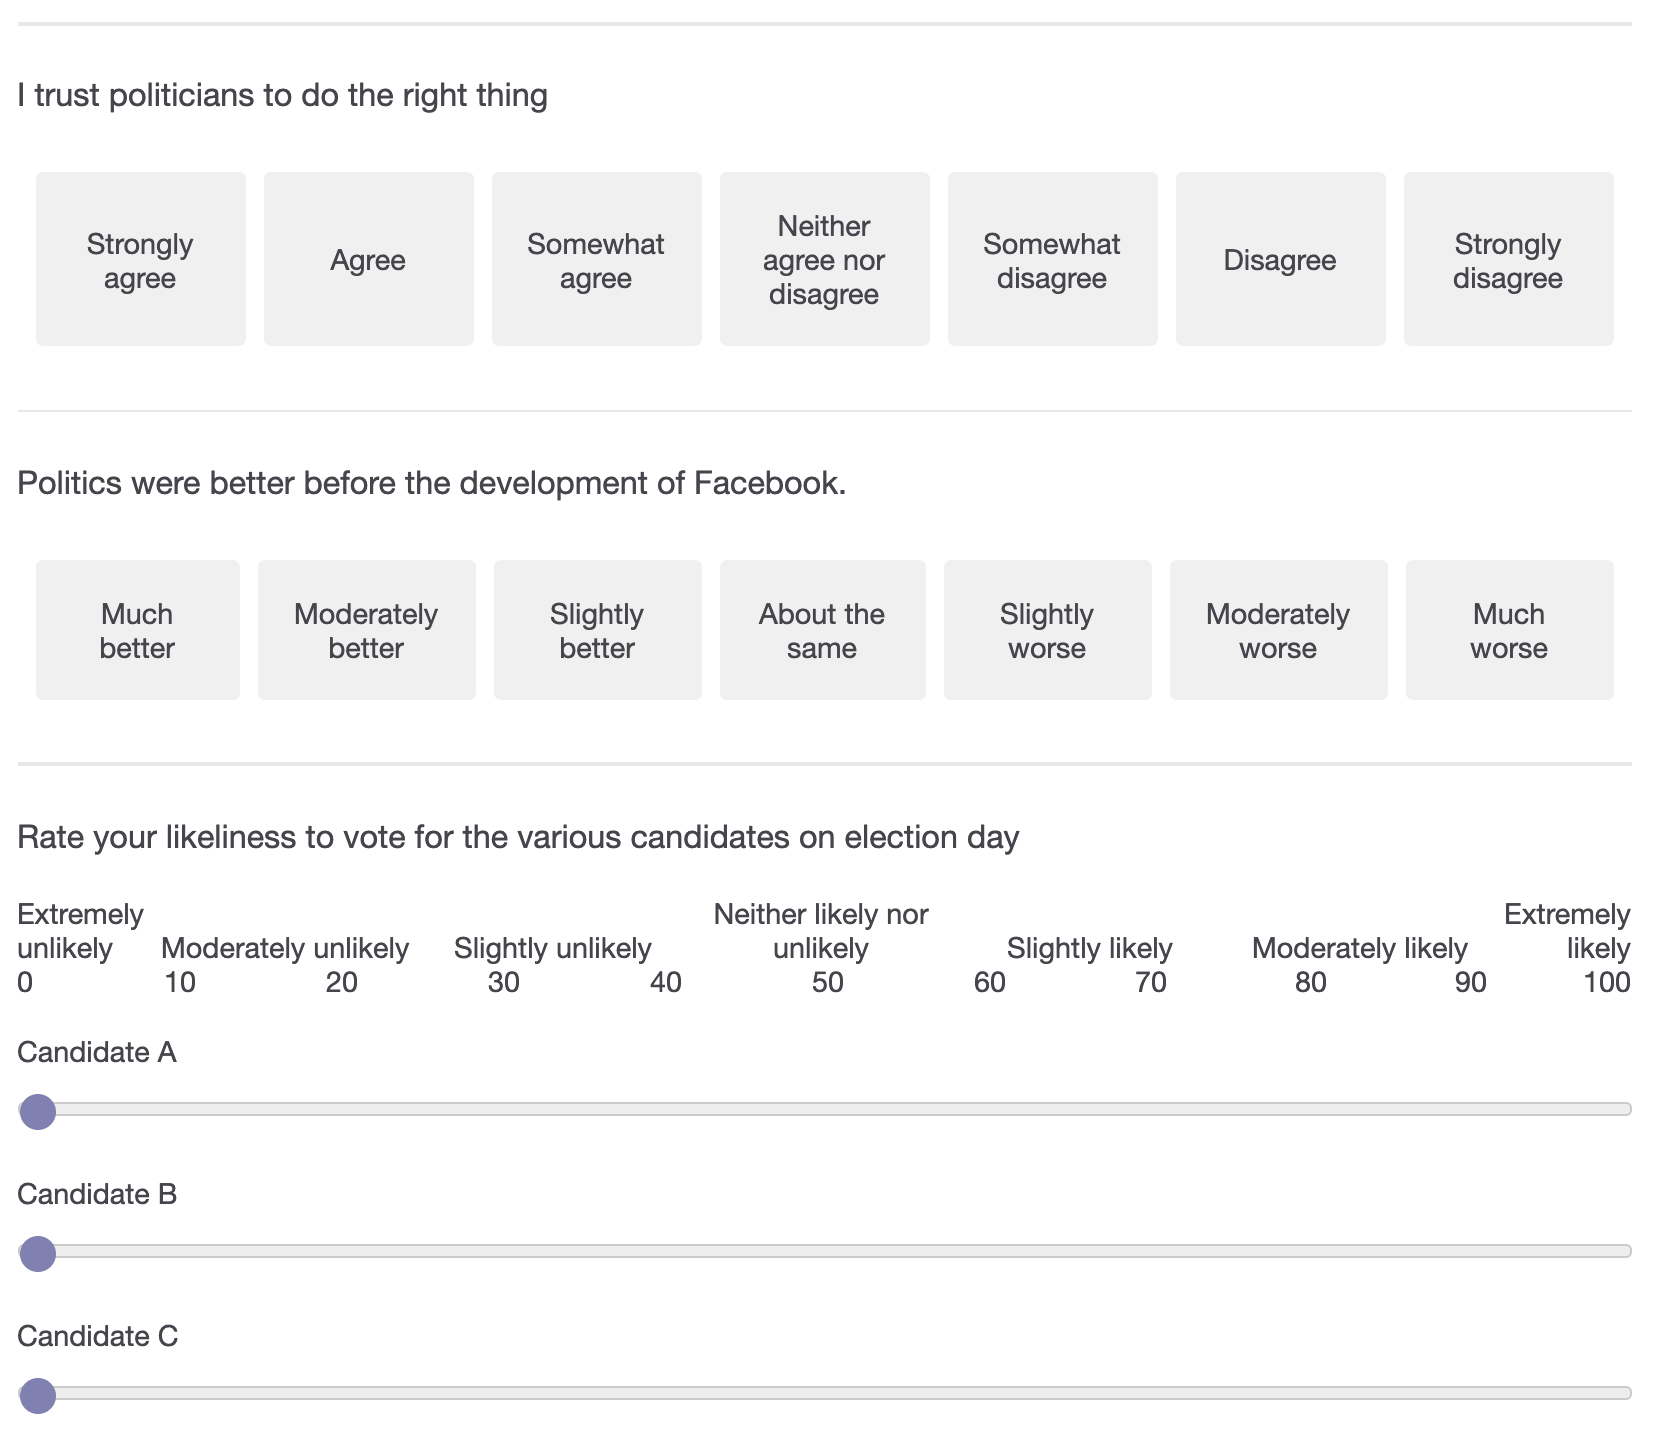
One common response option for close-ended survey questions is known as the Likert scale. A Likert scale allows a respondent to evaluate a statement using a range of possible options. This range is balanced, with an equal number of positive and negative choices, and often includes a neutral option. Likert scales most commonly measure agreement and disagreement, and often have five or seven response options, though they could conceivably include any number of choices. See the examples below.
Alternatively, respondents can be give the option to rate their agreement or reaction to a question using numeric options such as 0-5, 0-10, 0-100, etc.. Respondents may feel that they fall somewhere in between strongly agreeing and somewhat agreeing, so numeric responses allow them more freedom, however you wont know what a person thinks a 7 versus an 8 is in that case.
When using a Likert Scale, or a similar response option, researchers should be careful and intentional about whether to choose a neutral option, such as the “Neither Agree nor Disagree” option mentioned above. Doing so can encourage respondents to engage in related behaviors such as fence-sitting and floating. Fence-sitting refers to a respondent choosing a neutral option, even when they have an opinion. Floating refers to the opposite, when a respondent chooses an opinion that they don’t hold because there isn’t a neutral option. Both have the potential to influence a survey’s data, so researchers should be careful to anticipate whether one or the other might be a problem, and whether a neutral option is appropriate for a particular question.
5.9 Ready to start?
After reading this chapter you might realize there is a lot more nuance to designing surveys than you previously thought. With all these options and variables, how can the average researcher know they’ve designed the best survey for their particular research? One crucial step they can take is to conduct pre-testing. Pre-testing, as the name suggests, refers to sending out the survey to a sample of people before the actual research is conducted. Doing so can help the researcher understand how the respondents interact with the survey, including how long it takes, what questions are confusing or unclear, and if any of your questions are controversial. In this way, pre-testing is a necessary and invaluable way for researchers to identify problems with their surveys before the research is conducted.
5.10 After the Survey
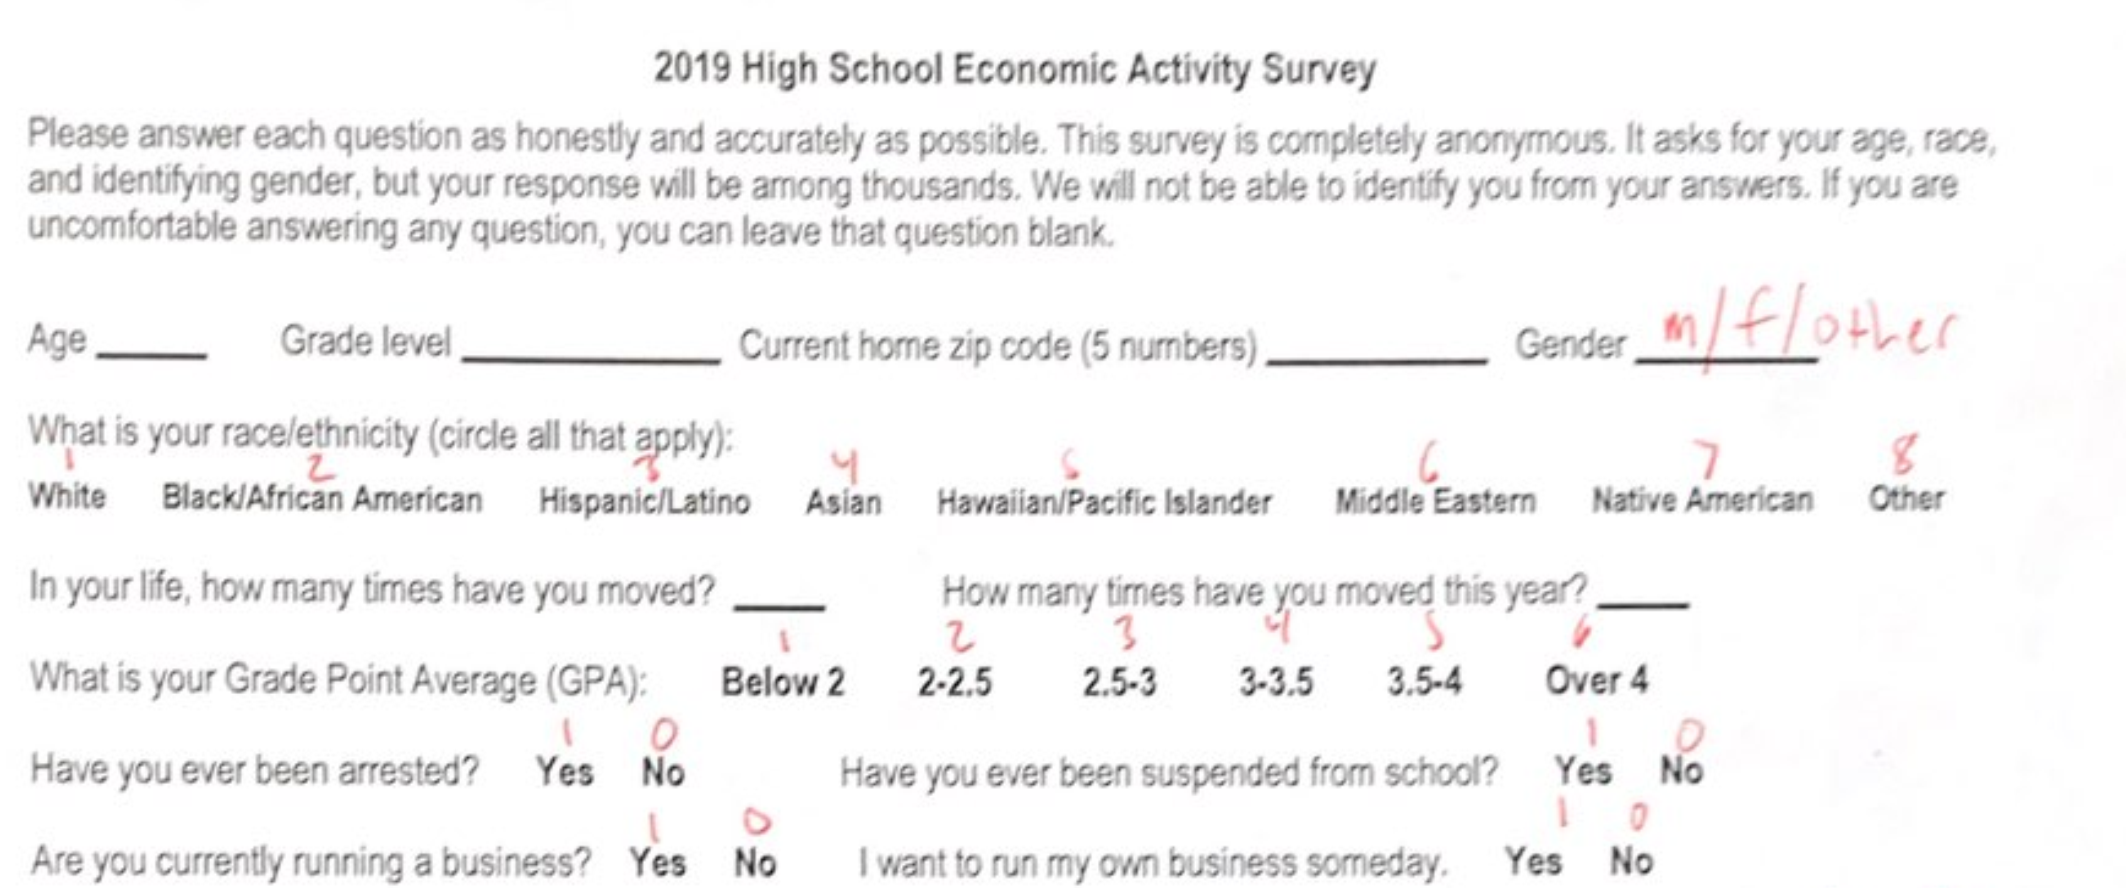
So you’ve run your survey. What does the data tell you, aren’t the answers jumping out at you? A survey is just the data collection – it won’t tell you anything anything on its own. The first thing you’ll need to do is code your survey so that it’s ready for analysis. The survey that was shown at the beginning of the chapter was done on pen and paper, so it had to be manually entered into a spreadsheet for analysis. As we discussed, quantitative research generally means using numbers and statistical techniques, so all those question you asked have to be converted. Look at the “code sheet” used to code that survey below.
Once the answers get coded into a spreadsheet, your data is ready for analysis. We’ll talk about the steps of that analysis in future chapters though, don’t worry. For now, you’re done with the survey, and we’ll move to another prominent method – interviews.