Chapter 4 Randomized controlled trials
4.1 Study design
A randomized controlled trial (RCT) is an experiment performed on human subjects (usually patients) in order to assess the efficacy of a treatment (or intervention) for some condition. It has two key features. First, the new treatment is given to a group of patients, the treatment group, and another treatment (standard of care or placebo treatment) is given to another group of patients, the control group, at the same time. Second, patients are allocated to one group or another by randomization. A more accurate name for RCT is randomized concurrently controlled clinical trial, because patients in the intervention and in the control group receive treatment at the same time.
There are often more than two treatments being compared in a single trial, such as a treatment in different doses. However, the fundamental principles of RCTs become clear already in the case of two groups. Moreover, the treatment is not necessarily a drug, but may also be a new surgical procedure, a certain therapy (e.g. acupuncture, psychotherapy), etc. Participants of an RCT may not get the “optimal” treatment, so there are important ethical aspects when conducting an RCT.
4.1.1 Historical context
Ronald Aylmer Fisher (1890-1962) and Austin Bradford Hill (1897–1991) were pioneers of randomization. In the 1920s, R.A. Fisher presented randomization as a crucial element of the design and analysis of experiment (Fisher, 1925). He also said about the importance of design:
“To consult the statistician after an experiment is finished is often merely to ask him to conduct a post mortem examination. He can perhaps say what the experiment died of.”
(Presidential Address to the First Indian Statistical Congress, 1938).
A.B. Hill also advocated for randomization (Hill, 1937) and was the trial statistician in one of the very first RCTs among humans: the MRC Strepromycin trial. However, this trial is not the first study using randomization and double blinding. In 1835, more than 100 years before the MRC Streptomycin Trial, the `Nuremberg salt test’ was performed, using randomization and double blinding to evaluate the efficacy of homeopathy. Stolberg (2006) summarized and commented on the study.
The MRC Streptomycin Trial
The Streptomycin trial was conducted by the Medical Research Council (MRC) in the U.K. in 1946-1947 and the results were published in 1948 (Streptomycin in Tuberculosis Trials Committee, 1948). Patients with pulmonary tuberculosis were randomly assigned to receive Streptomycin (a bactericidal antibiotic drug) and bed-rest, or bed-rest alone (the standard of care). The randomization series were not known to the investigator and the patient did not know whether they were in the treatment or control group. Results showed efficacy of Streptomycin against tuberculosis, albeit with minor toxicity and acquired bacterial resistance to the drug. Today, Streptomycin, in combination with penicillin, is used in a standard antibiotic cocktail to prevent bacterial infection in cell culture.
The Salk Polio Vaccine Trial
Polio was a major public health problem worldwide in the late 19th and early 20th centuries. Over 500,000 cases of polio were reported every year by the mid-20th century (https://www.who.int/news-room/spotlight/history-of-vaccination/history-of-polio-vaccination).
By 1953, several potential vaccines had been developed. One of the more promising was an inactivated virus vaccine developed by Jonas Salk at the University of Pittsburgh. Approximately 750’000 children were selected to participate in the study, about 340’000 declined to participate and another 8500 dropped out in the middle of the experiment (Francis Jr et al, 1955). The remaining children were randomized into a treatment and a control group with approximately 200’000 children in each group, as summarized in Table 4.1.
| Yes | No | Infection risk | |
|---|---|---|---|
| Yes | 82 | 200663 | 0.041% |
| No | 162 | 201067 | 0.081% |
The difference in the number of polio cases between groups was significant and could rightfully be interpreted as a clear indication that the vaccine was indeed effective.
4.1.2 Ethical issues of RCTs
There are important ethical aspects to consider when planning and conducting an RCT. First, a patient must never be given a treatment that is known to be inferior. Moreover, patients must be fully informed about possible adverse reactions, side-effects etc. They must give their consent, preferably in writing. Additionally, patients who have entered a trial may withdraw at any time and they must receive the most appropriate treatment available outside the trial.
For these reasons, large trials usually have a data and safety monitoring committee, which periodically reviews the evidence currently available from the trial and gives recommendations whether the trial should continue or terminate.
4.1.3 Structure of RCTs
RCTs have five key characteristics:
- A population of eligible patients
- A group of patients recruited from this population
- Existence of (at least) two treatment groups
- Allocation to treatment by randomization
- Outcome measures in the treatment groups are compared at the end of the trial.
Example 4.1 Polack et al (2020) conducted a multinational, placebo-controlled, observer-blinded, pivotal efficacy trial to assess the efficacy of the BNT162b2 vaccine candidate against laboratory-confirmed Covid-19. A pivotal trial is designed to provide the critical evidence needed to support regulatory approval of a drug or vaccine, typically in Phase III.
4.1.4 Eligibility criteria
A strict set of eligibility criteria allows to generalize the results of the trial to the population of eligible patients. We can distinguish inclusion and exclusion criteria.
Specification of eligibility criteria is particularly important for trials with long enrollment period (months, years) and multicenter trials. Otherwise, the type of patient recruited may change over the duration of the trial or may vary from center to center.
Example 4.1 (continued) The inclusion criteria in Polack et al (2020) were: adults 16 years of age or older, healthy or with a stable chronic medical condition. Some of the key exclusion criteria included: a medical history of Covid-19, treatment with immunosupressive therapy, or diagnosis with an immunocompromising condition. Out of the 44820 participants which were screened for the study, 1150 were excluded because they did not meet the eligibility criteria.
4.1.5 The need for a control group
At first sight it seems odd to include a control group (larger sample size, additional costs, possibly inferior treatment given to control group). But there is always patient variability in response to treatment, so without a control group we do not know to what extent patient response is due to treatment. For example, without a control group, regression to the mean may indicate an apparent, non-existing treatment effect.
Regression to the mean
Example 4.2 Regression to the mean in the absence of a control group is illustrated with an example from Senn (2011). Imagine a single-arm trial where all patients receive treatment. Suppose that the mean diastolic blood pressure (DBP) is the same at baseline (before treatment is given) and at follow-up (“at outcome”). So, there is no treatment effect, as illustrated in Figure 4.1 (left plot). The inclusion criteria of a hypothetical trial are hypertension at baseline, which is defined as DBP \(>\) 95 mmHg. The resulting distribution is shown in Figure 4.1 (right plot). In this hypothetical trial, mean DBP at follow-up is 100.6 mmHg, more than 2 mmHg higher than at baseline (98.0 mmHg). This suggests a treatment effect which is not present. Now suppose that this hypothetical trial was in fact the Placebo arm in a two-arm trial. An apparent Placebo effect in the Placebo arm of this trial will then be just an artefact due to regression to the mean (Dirnagl, Ulrich, 1996)!
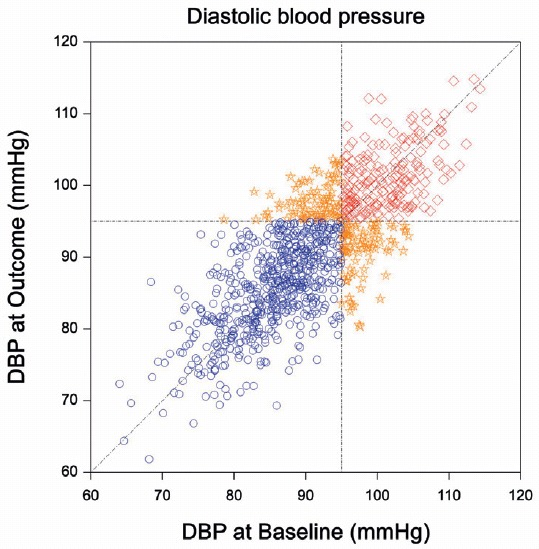
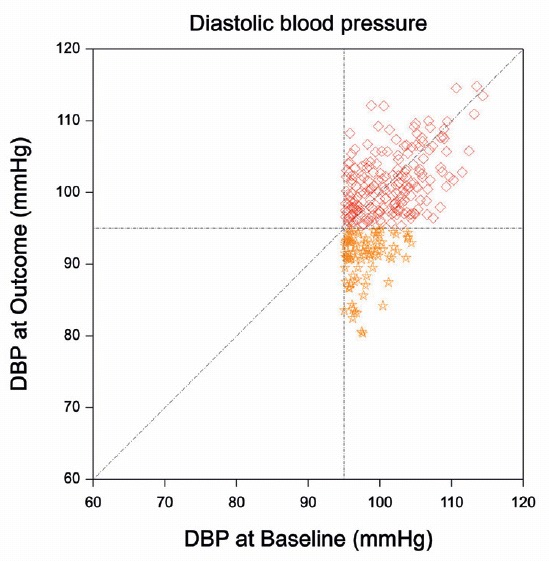
Figure 4.1: Regression to the mean in an example from Senn (2011). The left plot shows the joint distribution of diastolic blood pressure measurements at Baseline and at Outcome. The mean of both measurements is 90 mmHg. The right plot shows the truncated distribution of the patients that have been included in the hypothetical trial. The mean DBP at outcome is now more than 2 mmHg higher than at baseline.
Historical controls
Historical controls are an alternative to concurrent controls in situations where randomizing patients to a control treatment or placebo is not feasible, for practical or ethical reasons.
The main issue with historical controls is that there may be systematic differences between patients in the historical control group and patients in the treatment group, which might cause biased results. There might, for example, be some heterogeneity in the selection of patients and possible time trends such as a change in disease severity over time (e.g. different variants of COVID-19). In addition, there might be differences in the conduct and analysis of the historical and the new trial (Marion and Althouse, 2023).
Example 4.3 Coelho et al (2023) conducted an open-label, single-group, phase 3 trial to evaluate the use of transthyretin gene silencing as a treatment for hereditary transthyretin (ATTRv) amyloidosis. ATTRv amyloidosis is a life threatening genetic disorder for which several medications have been approved by the FDA. In order to not “unnecessarily expose participants to sequelae from a rapidly progressive and potentially fatal neurologic disease”, a historical placebo from a previous trial conducted between 2013 and 2017 was chosen.
4.1.6 The importance of randomization
Allocation at random aims to ensure that all prognostic factors (both known and unknown) are similarly represented in the two groups. That means that there is no systematic difference between the groups, which may have caused treatment difference.
Example 4.4 Table 4.2 summarizes the results of an observational study comparing two different treatments for renal calculi (Charig et al, 1986). The overall odds ratio (comparing treatment A to treatment B) is
\[\mbox{OR} = \frac{273 \cdot 61}{77 \cdot 289} = 0.75.\]
Therapy B is hence apparently more successful than Therapy A.
| Yes | No | Total | |
|---|---|---|---|
| Therapy A | 273 (78%) | 77 | 350 |
| Therapy B | 289 (83%) | 61 | 350 |
However, this study is non-randomized, and the distribution of the two therapies differs among patients with small resp. large kidney stones, see Table 4.3.
| yes | no | total | yes | no | total | |
|---|---|---|---|---|---|---|
| Therapy A | 81 (93%) | 6 | 87 | 192 (73%) | 71 | 263 |
| Therapy B | 234 (87%) | 36 | 270 | 55 (69%) | 25 | 80 |
The odds ratio in the subgroups of patients with small kidney stones is
\[ \mbox{OR} = \frac{81 \cdot 36}{6 \cdot 234} = {2.10} \]
and the odds ratio in the subgroup of patient with large kidney stones is \[\mbox{OR} = \frac{192 \cdot 25}{71 \cdot 55} = {1.23}.\]
This subgroup analysis hence reveals that Therapy A is more successful than Therapy B in both subgroups. This is an example of Simpson’s paradox. The success rate was on average higher for small kidney stones (seem to be easier to cure) and because patients receiving therapy B included a much larger proportion of patients with small kidney stones, this therapy seemed better when the size of kidney stones was ignored. If the size of kidney stones is adjusted for, we can see that A is better for both sizes, but because A was given mostly to patients with large kidney stones, with lower average success rate, we could not see this before.
4.2 Bias in RCTs
We will now discuss in detail the five types of biases that may occur in RCTs, as described in Matthews (2006). There are many more types of biases, see for example https://catalogofbias.org/.
4.2.1 Selection bias
Selection bias occurs if the study sample is systematically different from the population it was intended to represent.
Two types of sampling methods can be distinguished: random sampling (also called “probability sampling”), where population members have an equal probability of being selected into the study, and non-random sampling (“non-probability sampling”). An example of non-random sampling is convenience sampling, where patients are selected if it is convenient and they are easily accessible. This type of sampling is prone to selection bias.
4.2.2 Allocation bias
Randomization ensures - in principle - that the groups to be compared are balanced with respect to all relevant prognostic factors. Allocation bias occurs if there is a systematic difference between participants in how they were allocated to treatment groups. We do not expect this to happen if randomization is properly done. However, it is sometimes forgotten that proper randomization rests on adequate allocation concealment. Allocation concealment means that the allocation sequence is not known to those selecting the participants and assigning them to the intervention groups until the moment of assignment. If the allocation sequence is not concealed, it may be possible to subvert the recruitment of participants into the study and their allocation to treatment.
Trials with small sample size may also result in imbalance with respect to prognostic factors, simply due to the stochastic process of allocation. There are methods to address the latter problem in the design phase, e.g. via stratification.
4.2.3 Assessment bias
At the end of the trial, and during its course, observations are made on a variety of outcome variables. Some of these variables may have a subjective component, depending on the observer (e.g. blood pressure). If the observer knows the treatment being given to the patient, then the value of an observation might be influenced by the knowledge of the treatment. This will lead to assessment bias. This problem can be addressed by blinded outcome assessment.
4.2.4 Stopping bias
It is tempting to assess the outcomes of a trial repeatedly and to stop the trial once a promising result has been obtained. This can be done as part of a prespecified method for assessing the data, so-called group sequential methods (see Section 11.1.2). However, naive repeated checking of “significance” will introduce stopping bias. Stopping bias is illustrated in Example 4.5.
Example 4.5 Data with 250 patients per group are generated without any difference in the underlying means. A \(t\)-test is performed every 10 patients (5 per group). The particular trajectory shown in Figure 4.2 flags a significant difference early in the trial on the basis of 60-90 patients at the standard 5% significance level (1.96 threshold for the absolute value of test statistic). However, at the end of the trial, no significant difference can be observed. An extensive simulation reveals that such a significant difference will occur at some point in time in 36% of the cases. If we would only assess significance at the end of the trial based on 500 patients, then this proportion would be equal to the nominal significance level of 5%.
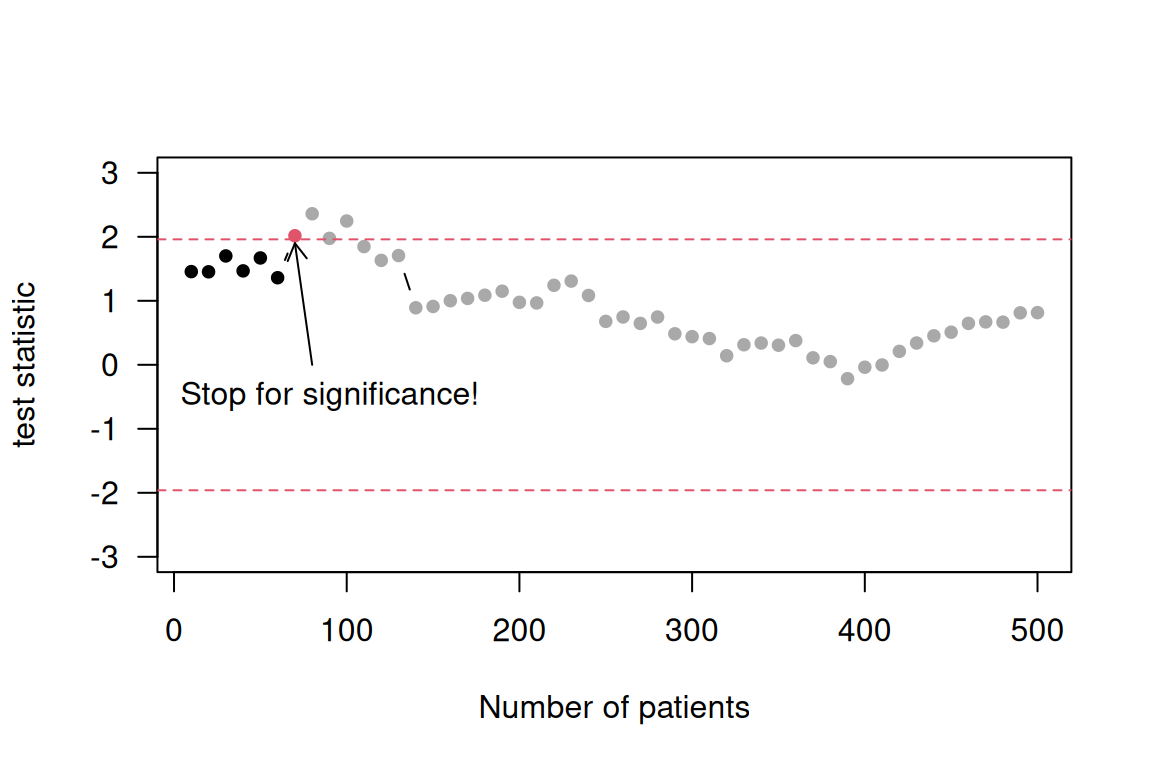
Figure 4.2: Stopping bias illustrated in accumulated data generated without any treatment effect.
4.2.5 Publication bias
Successful publication of the results of a clinical trial will depend on the referees and editors of suitable journals. Papers reporting positive (typically “significant”) findings are more likely to be published than those that do not. This will lead to publication bias. Also, papers are more likely to be written and submitted by the investigators if the outcome of the trial was positive.
Some attempts have been made to address this problem, e.g. mandatory registration of clinical trials before the study is conducted (http://clinicaltrials.gov/). Today, trial results are required to be published on this website within one year after the trial has finished.
4.3 Target trials
Randomized controlled trials are the gold standard for assessing the effectiveness and safety of new drugs or interventions. However, they might be restricted to a specific study population, and are not always feasible due to ethical or financial considerations. In that case, observational data can be used to emulate a target trial. Details on the challenges and conduct of target trials are explained in Hernán et al (2022) and Matthews et al (2022), for example.
4.4 ICH E9 guidelines
Founded in 1990, the International Conference on Harmonisation (ICH) strives for harmonisation in regulatory requirements worldwide to ensure that safe, effective and high-quality medicines are developed. It brings together regulatory authorities and pharmaceutical industry to discuss scientific and technical aspects of pharmaceuticals.
The presence of bias may seriously compromise the ability to draw valid conclusions from clinical trials. Many of the principles outlined in ICH E9 from 1998 focus on minimizing bias, see ICH (1998).
According to ICH E9, the sources of bias discussed earlier in this chapter are referred to as “statistical” bias. The bias introduced through deviations in conduct is referred to as “operational” bias. Some sources of bias arise from the trial design. For example, an assignment of treatments such that patients at lower risk are systematically assigned to one treatment. Other sources of bias arise during the conduct and analysis of a trial. For example, exclusion of patients from analysis based upon knowledge of patient outcomes may affect the accurate assessment of the treatment effect. Therefore, it is important to identify potential sources of bias as completely as possible so that attempts to limit such bias may be made.
At the early stage, we could use principles of trial design and conduct to reduce bias. For example, we could pre-specify objectives, endpoints, and analysis methods to prevent data-driven choices. We could also ensure blinding by keeping patients, doctors, and sponsors unaware of treatment assignment to avoid conscious or unconscious influence. Randomization can also help, by assigning patients to treatments by chance to balance known and unknown confounding factors. What’s more, adding control for comparison is helpful for discriminating outcomes caused by the treatment from outcomes caused by other factors, such as the natural progression of the disease or patient expectations.
There are also something we can do after the trial is closed. We can follow the principles of trial analysis to reduce bias. For example, we can control the Type I error probability at a pre-specified threshold, and limit false positive findings to reduce stopping bias. Reliable treatment estimates are important to facilitate regulatory decisions and inform patients and doctors. Intention-to-treat (ITT) can also help to reduce bias, by evaluating the treatment effect on the basis of the intention to treat a patient rather than the actual treatment given. ITT will be discussed more in Chapter 11.
4.5 Additional references
An introduction to randomized controlled clinical trials is given in Matthews (2006). The design of experiments is discussed in Chapter 2 in Bland (2015). Regression to the mean is discussed in the Statistics Notes Bland and Altman (1994a), Bland and Altman (1994b). A practical example for allocation concealment is Adamsen et al (2009), and Hijazi et al (2009) for convenience sampling.