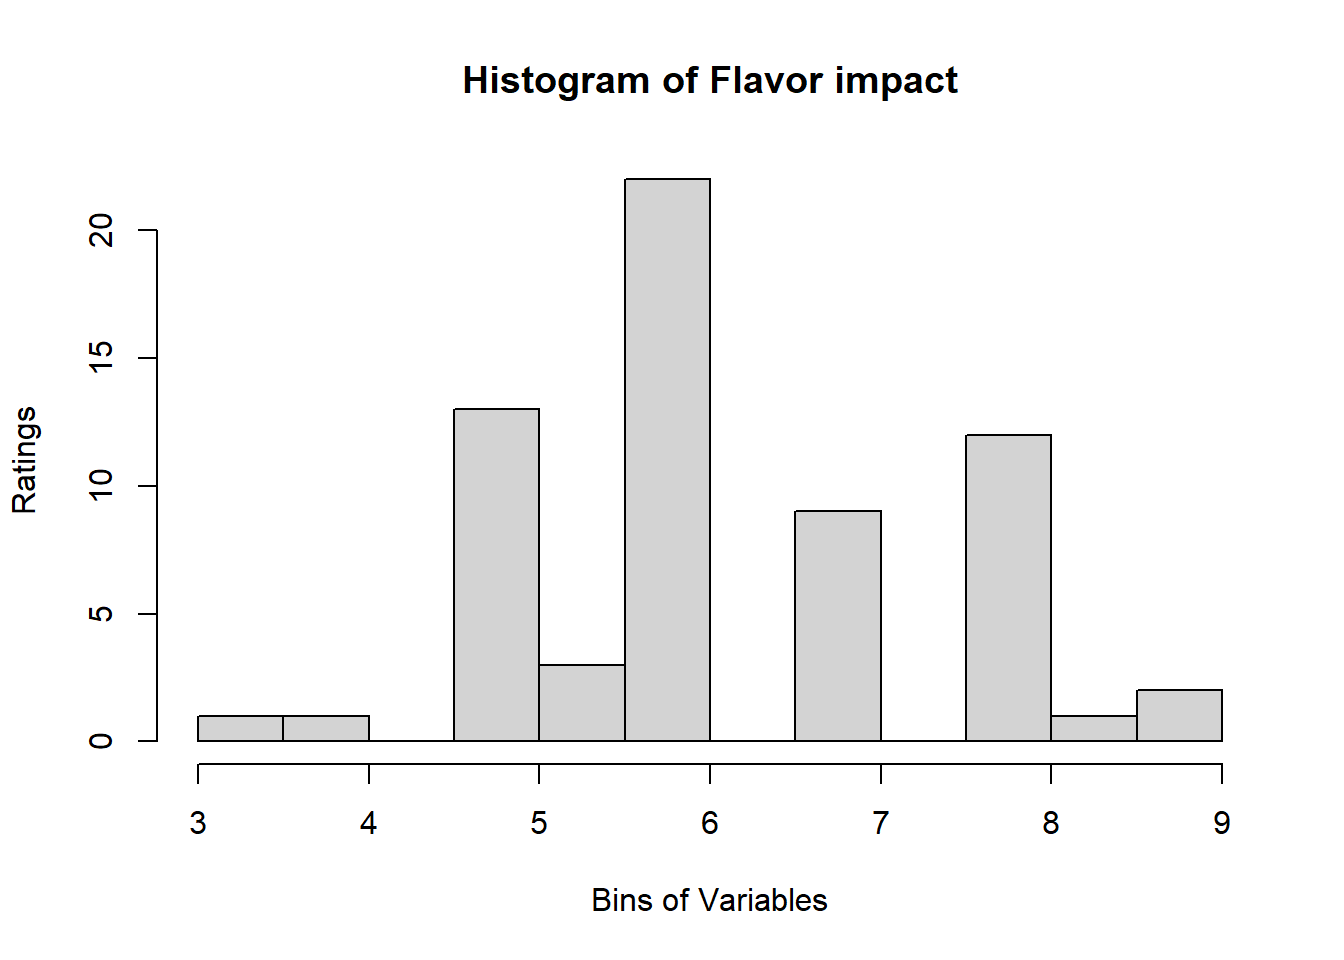
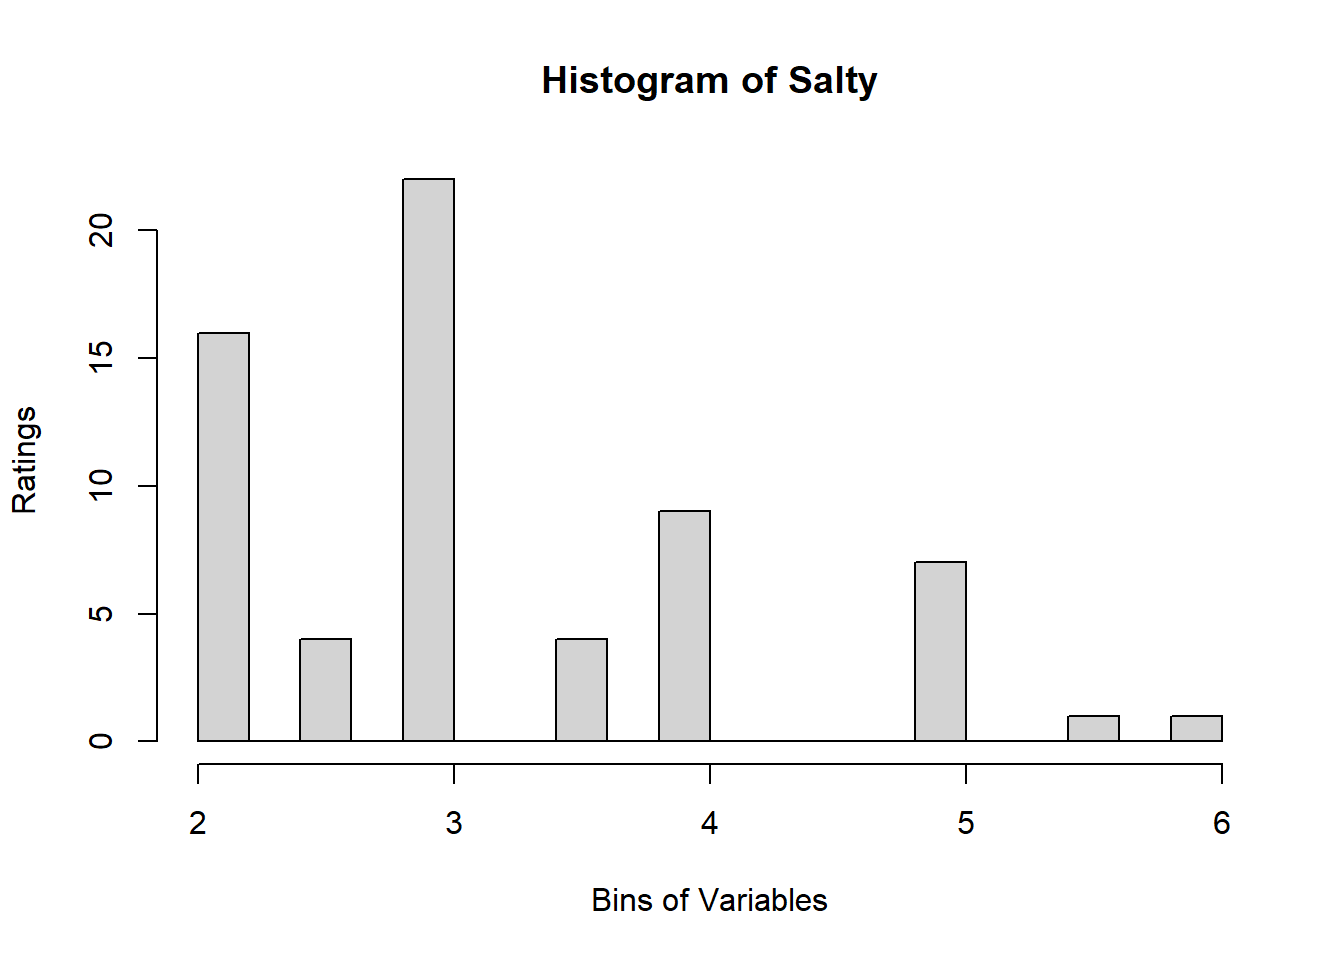
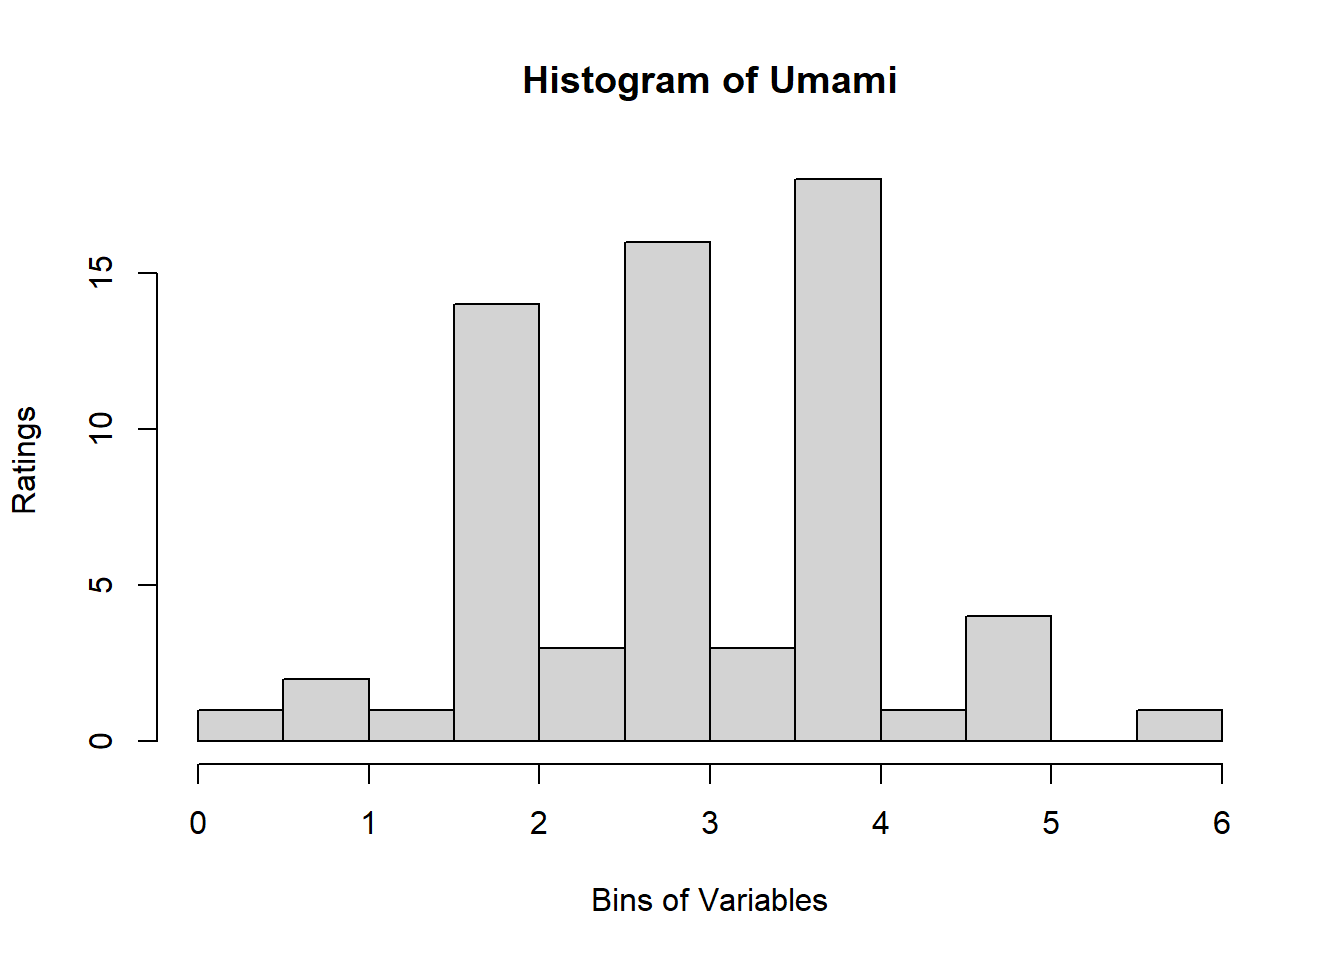
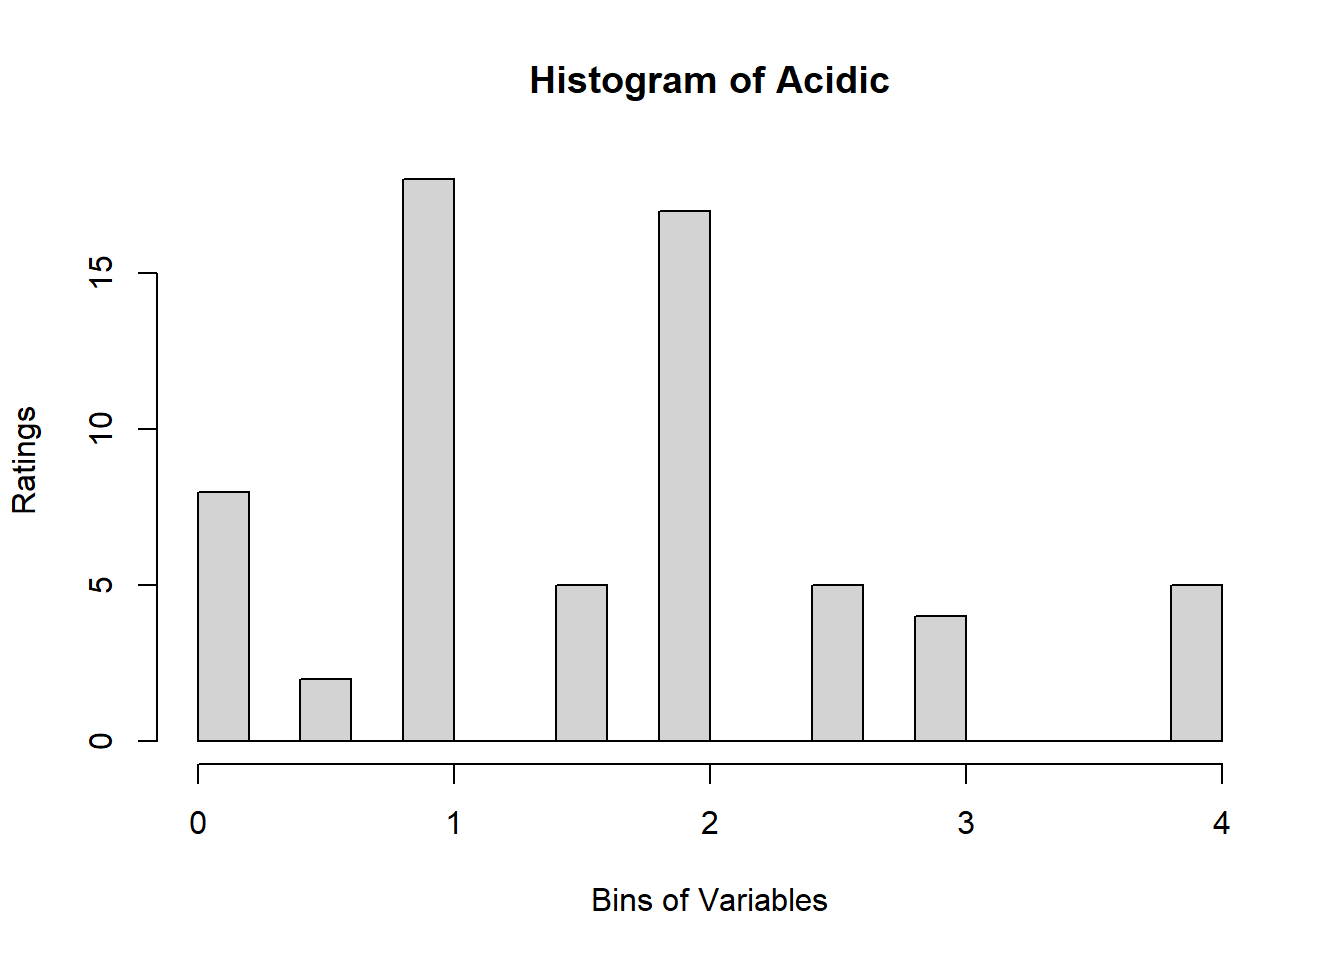
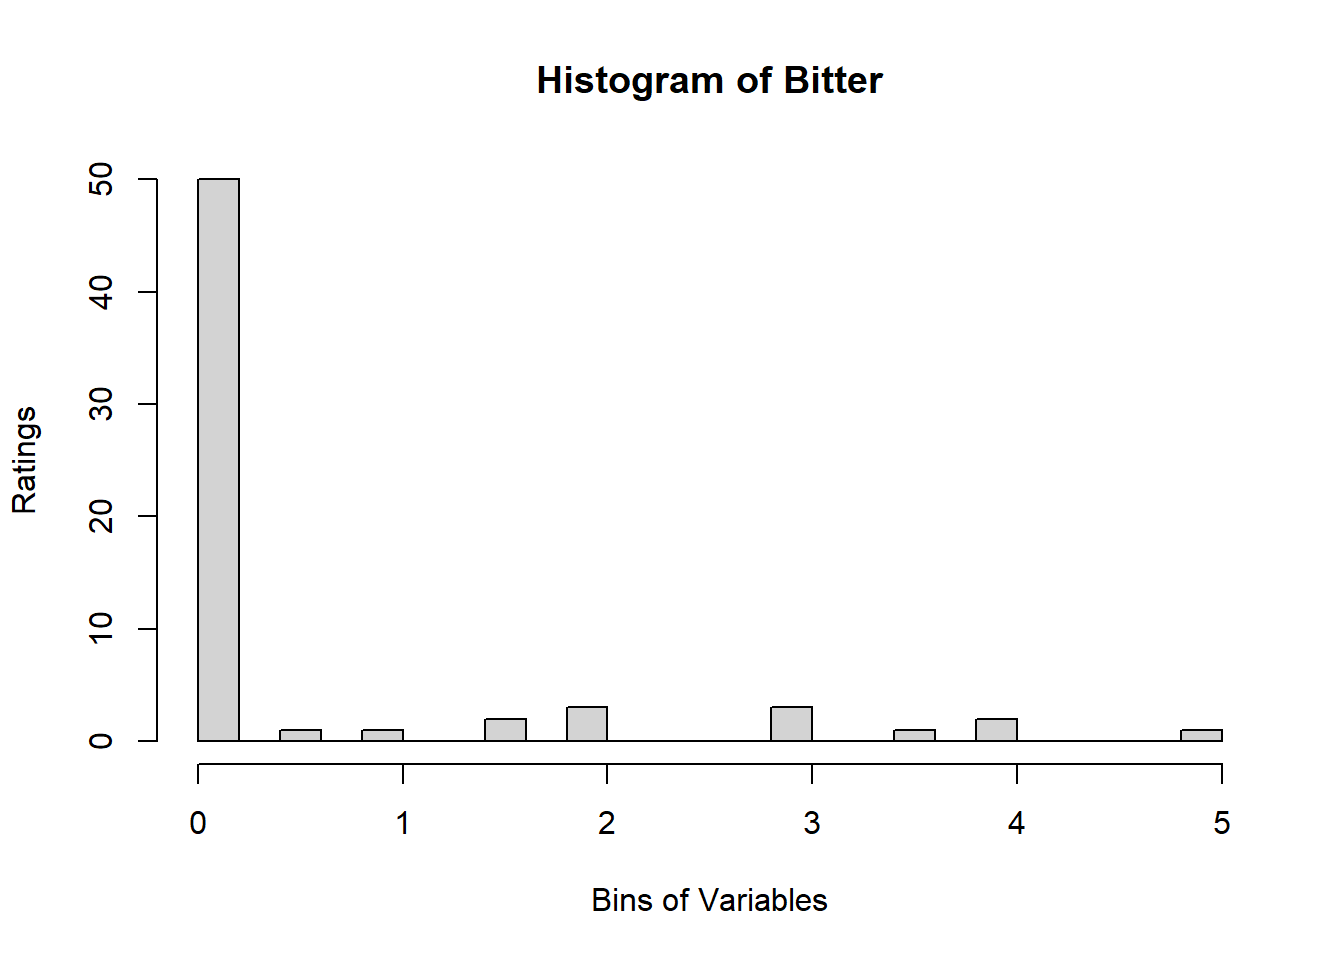
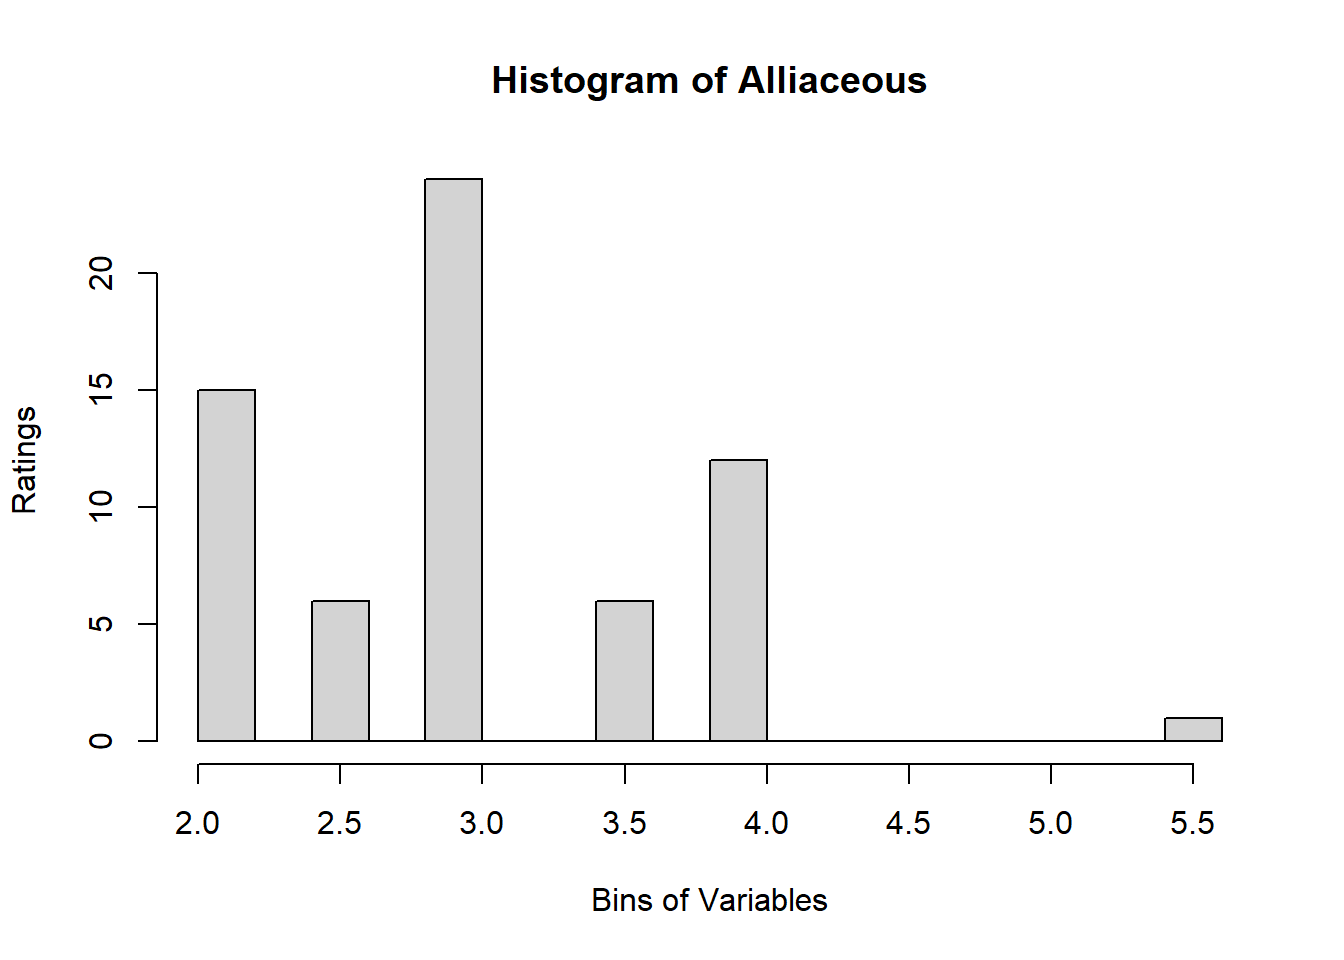
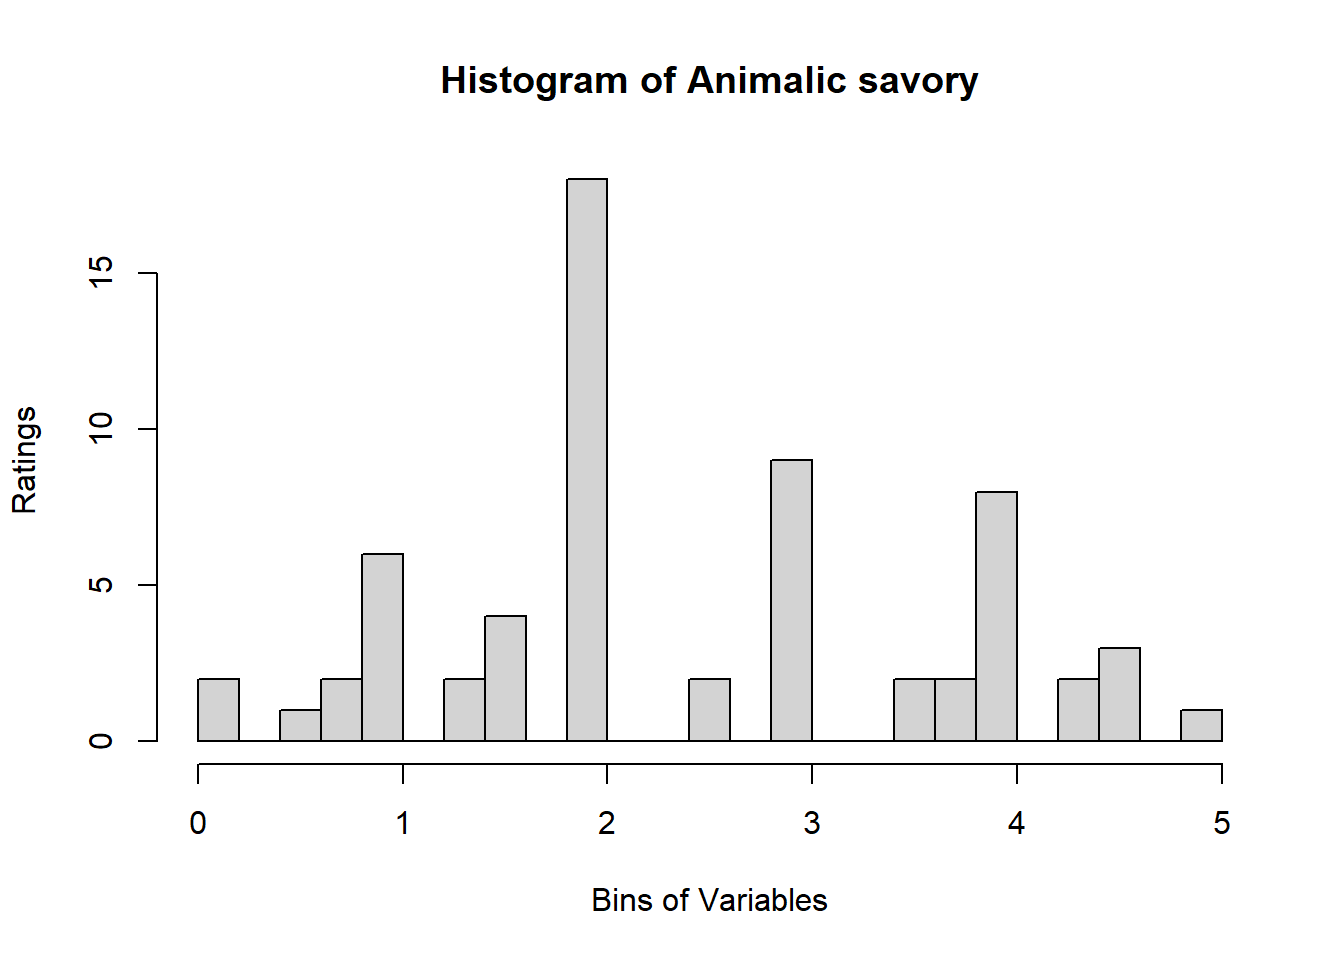
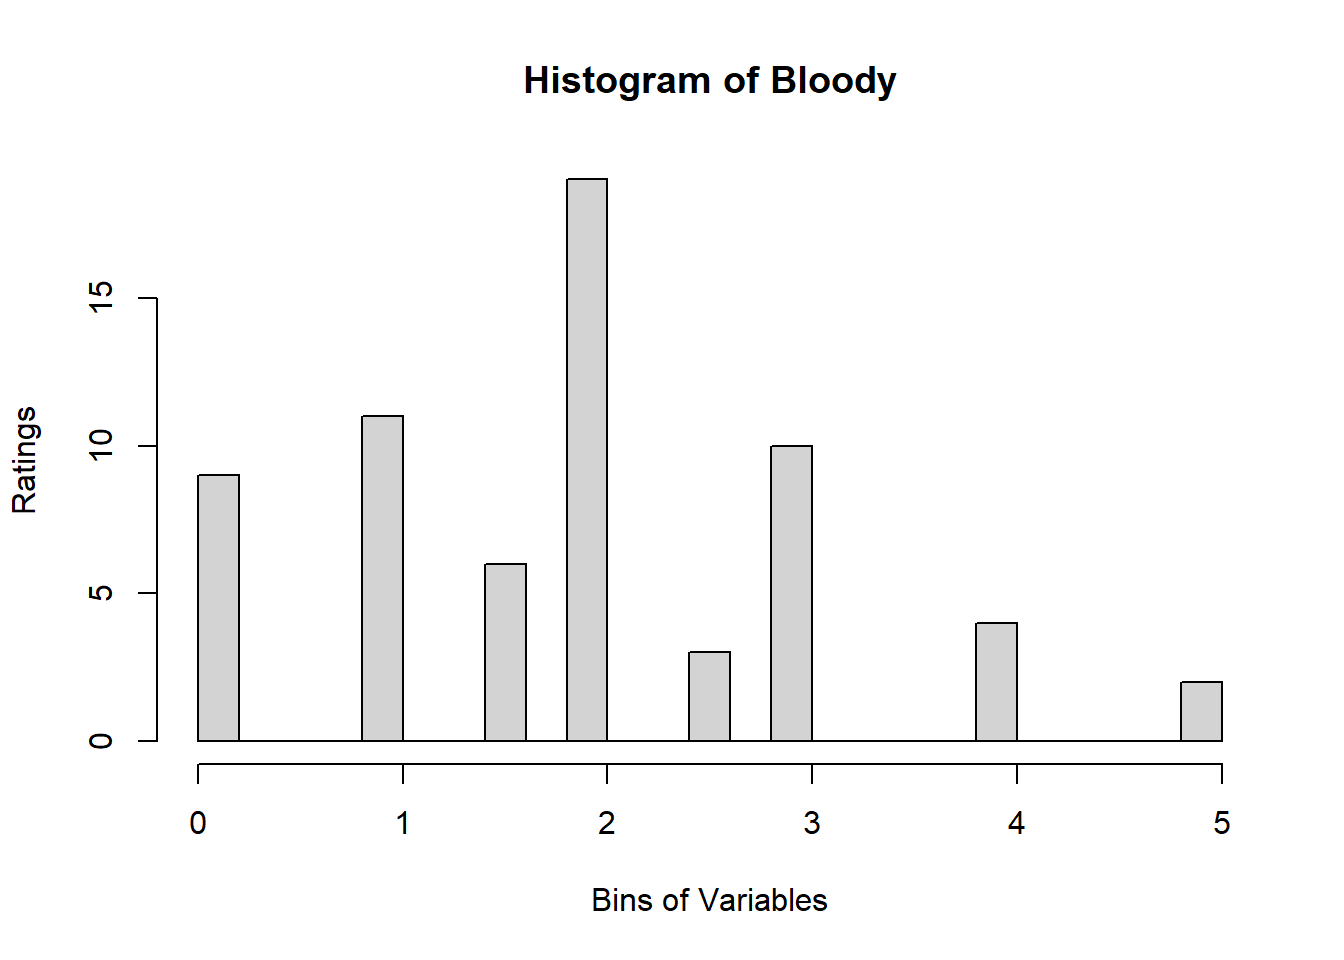
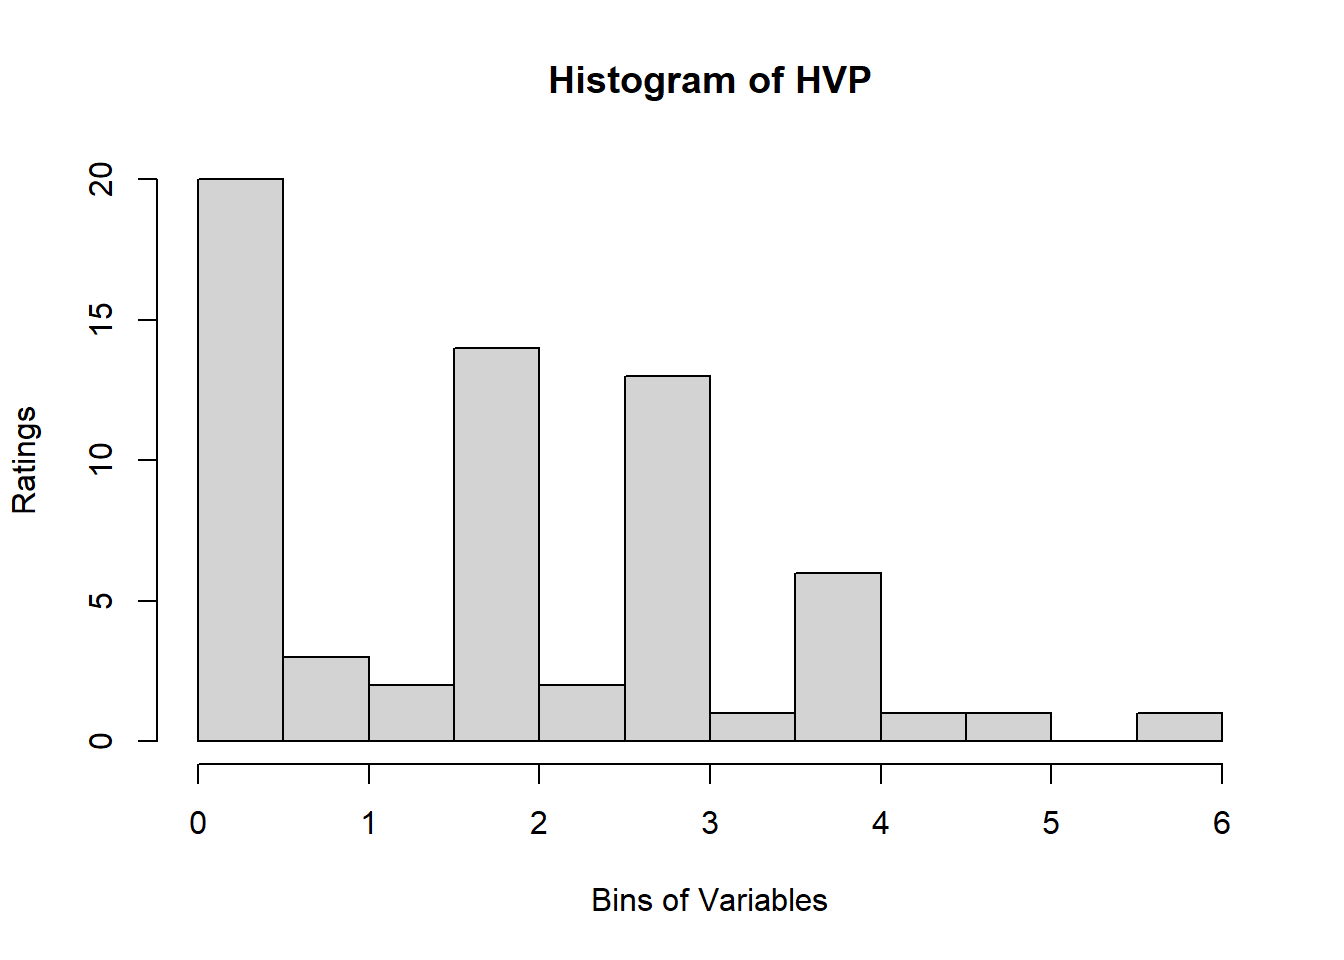
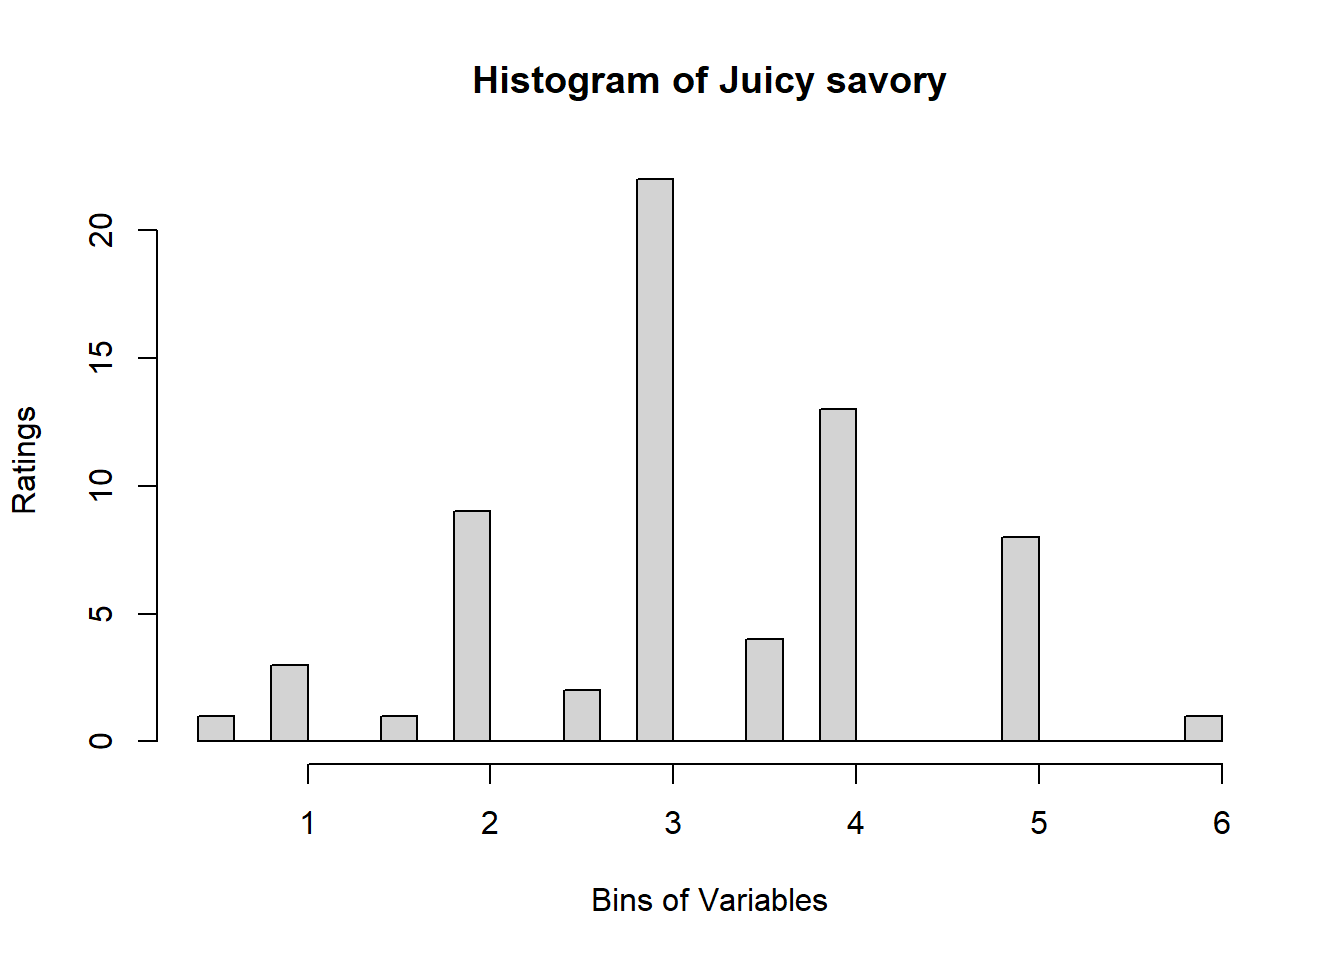
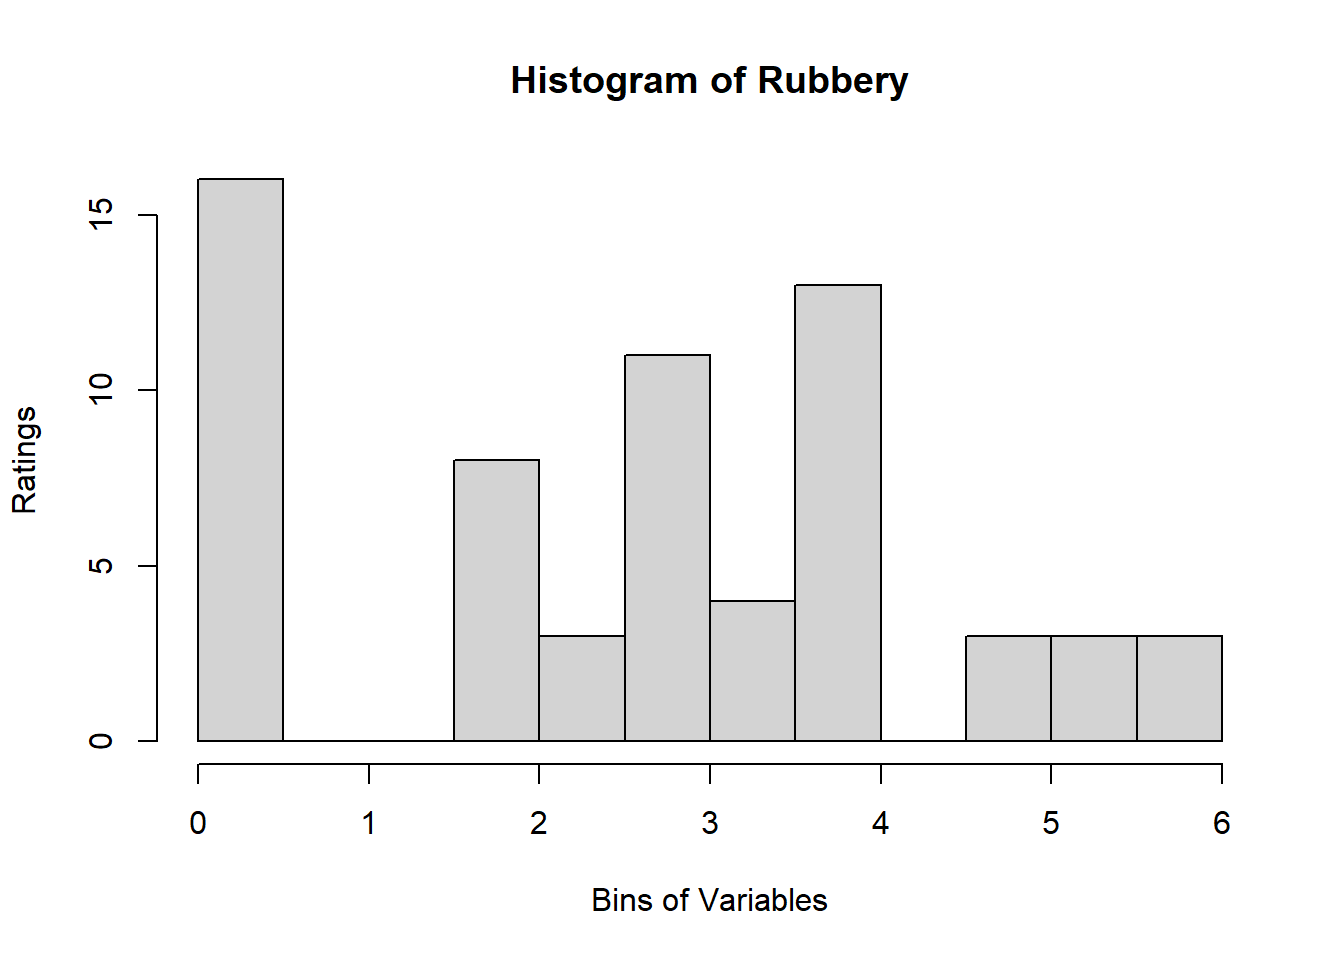
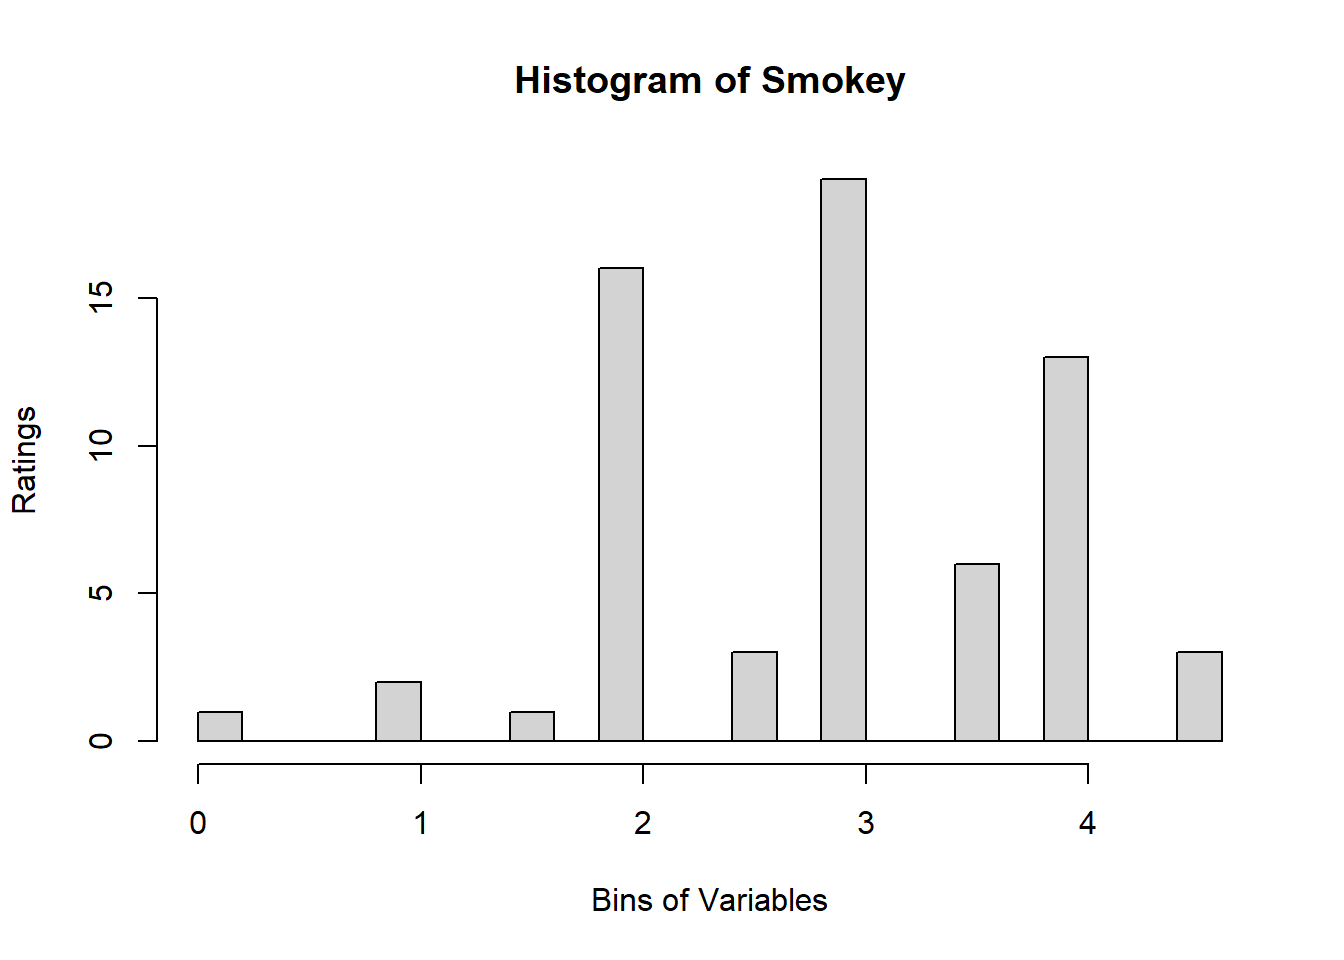
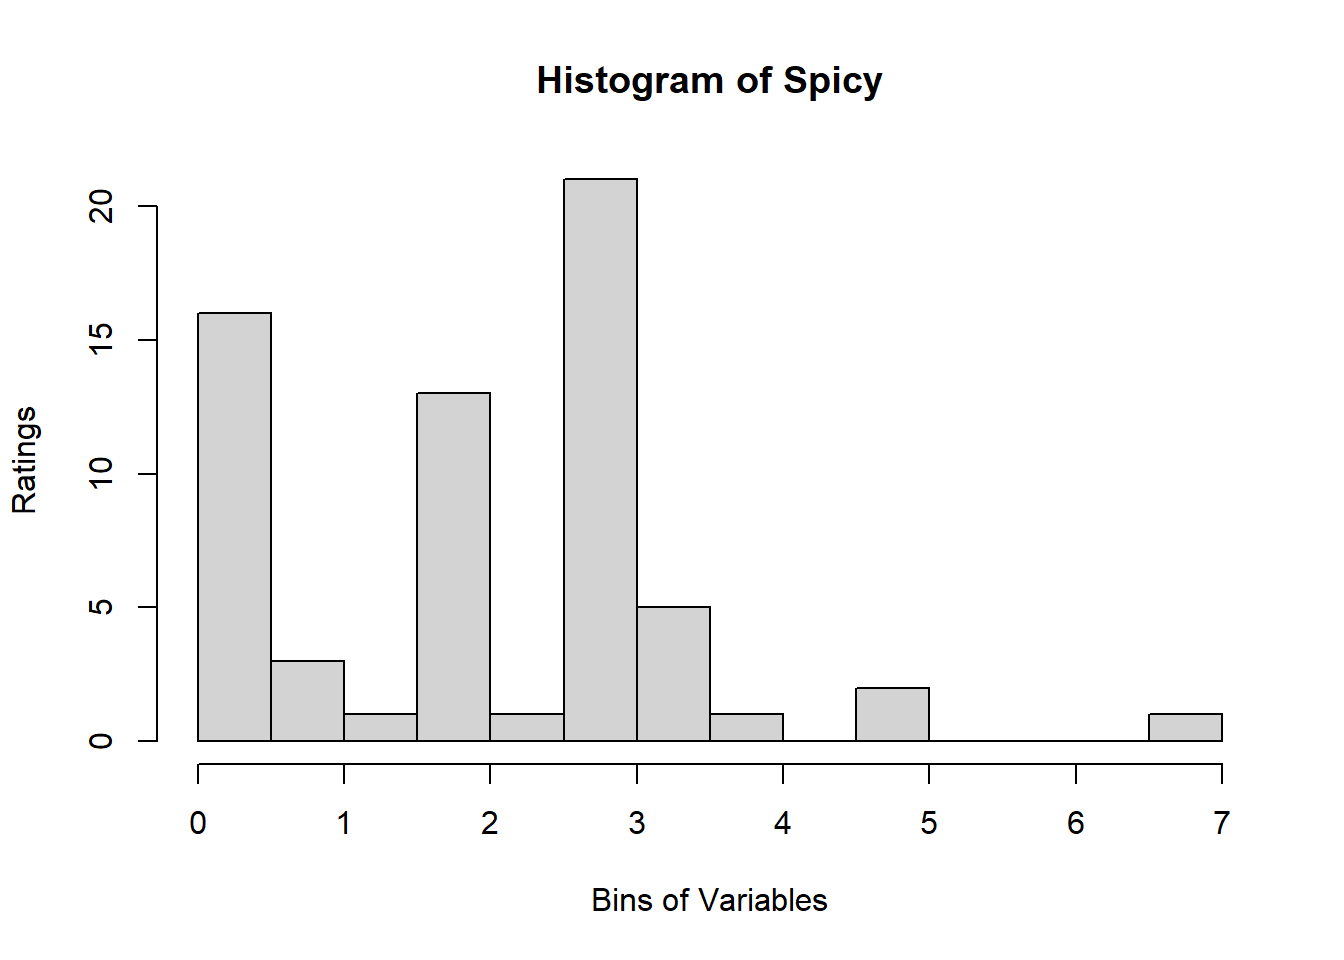
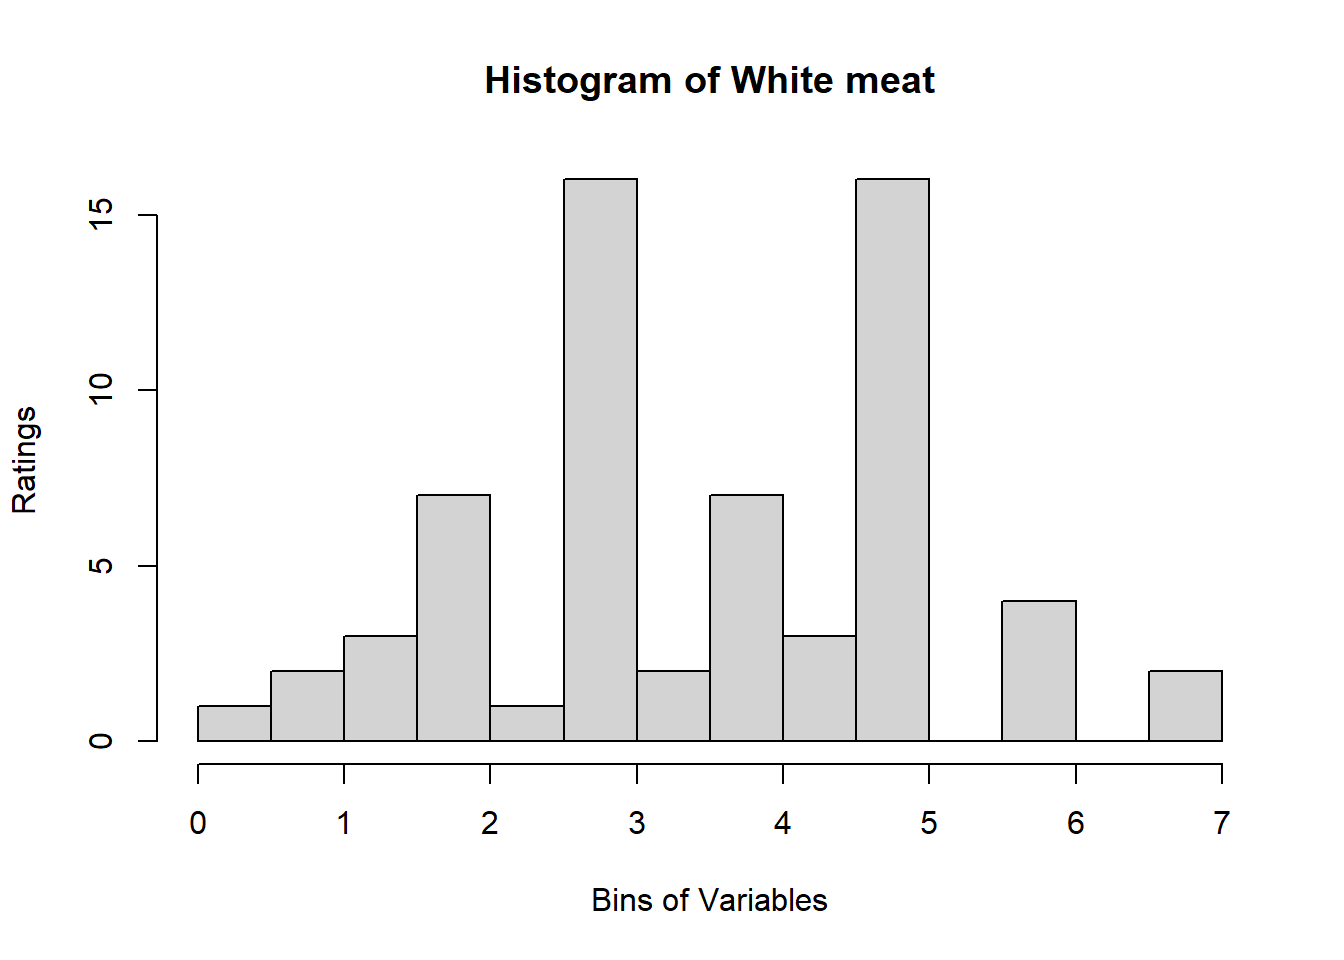
4.3 Binning Data:
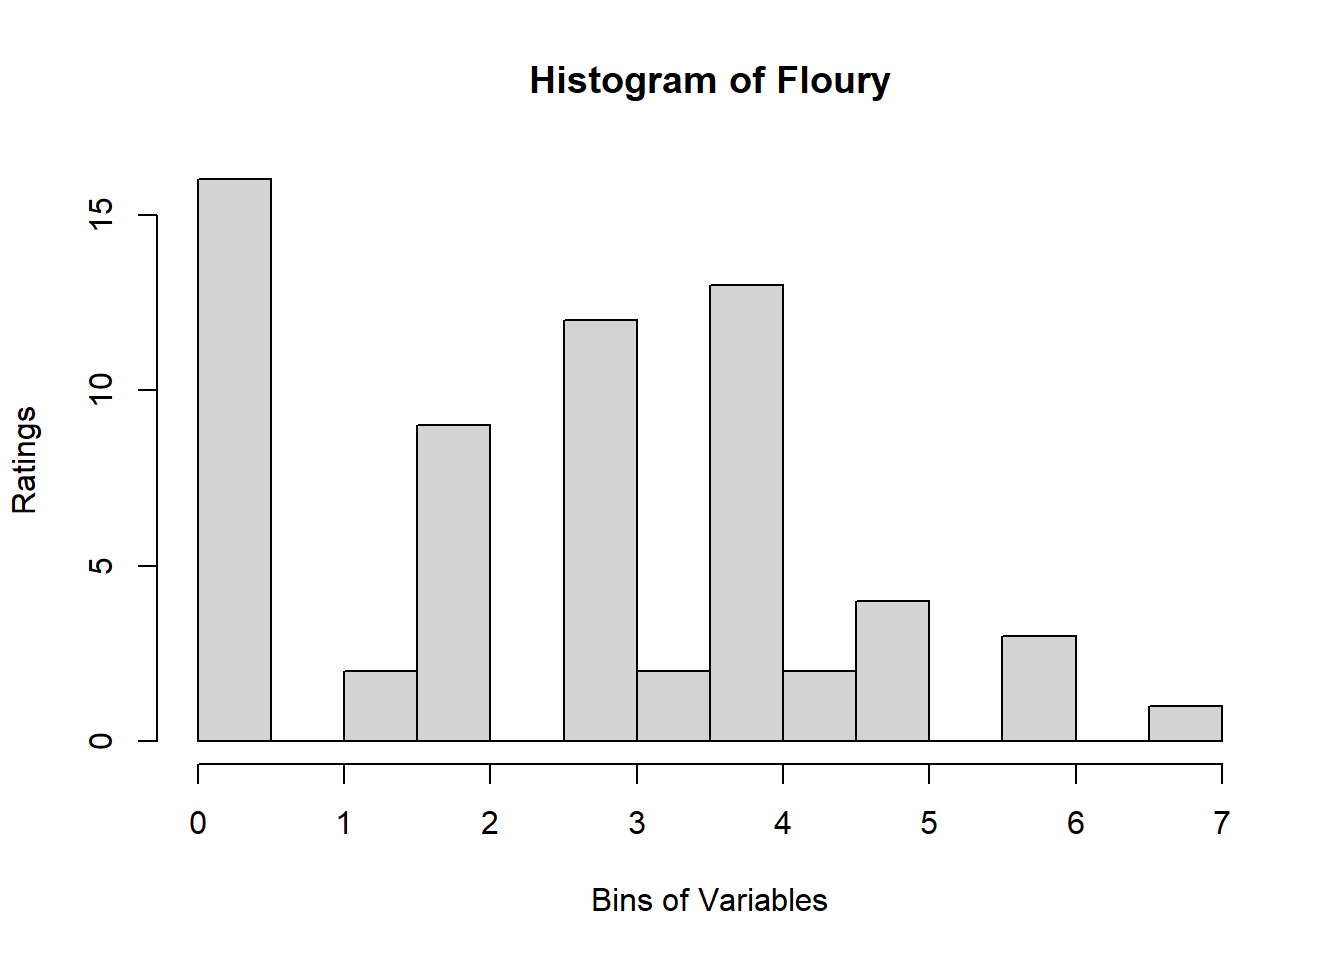
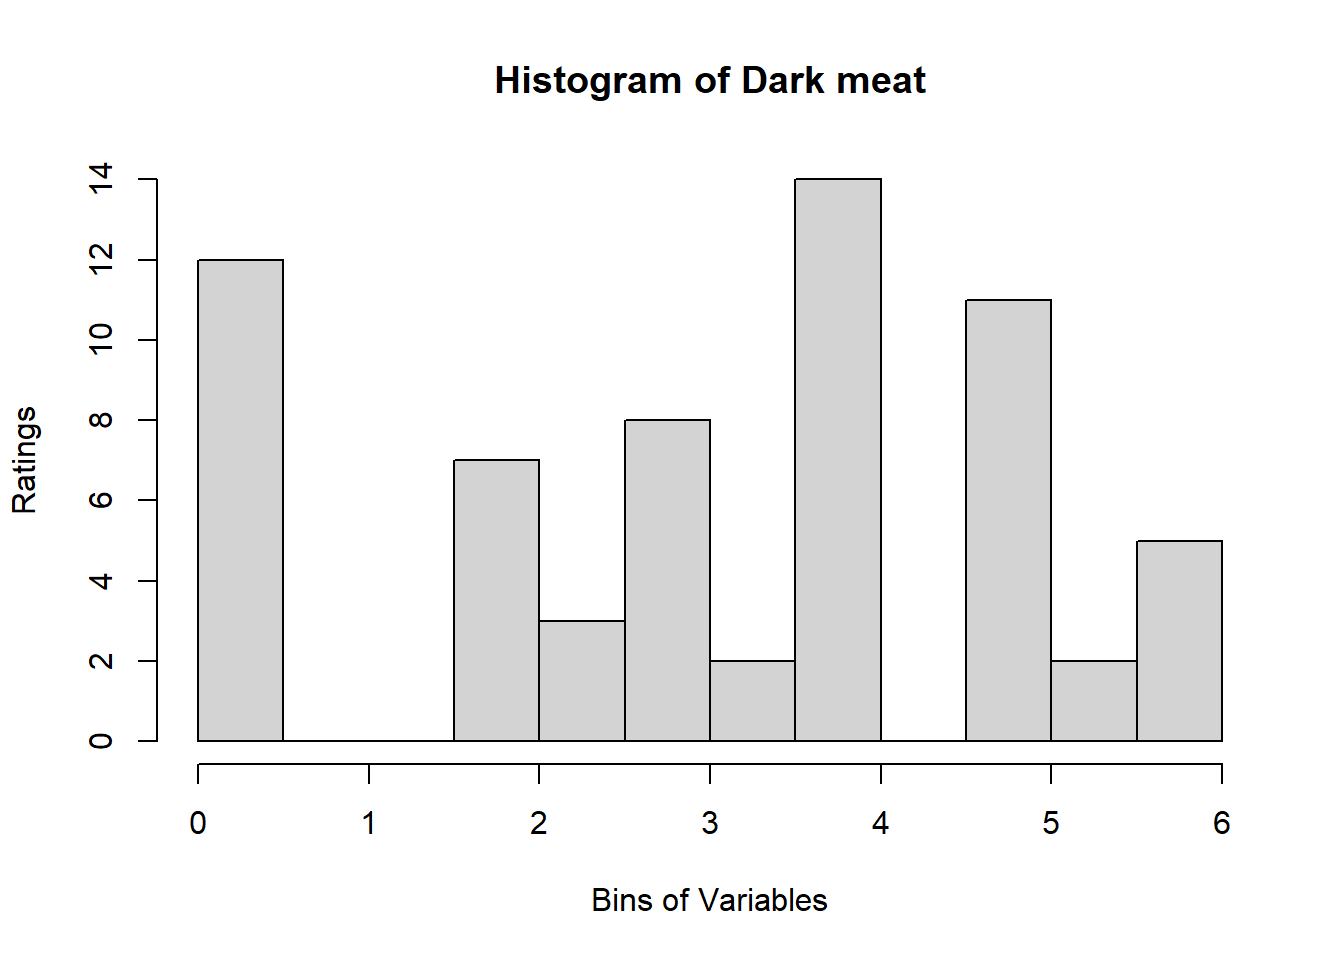
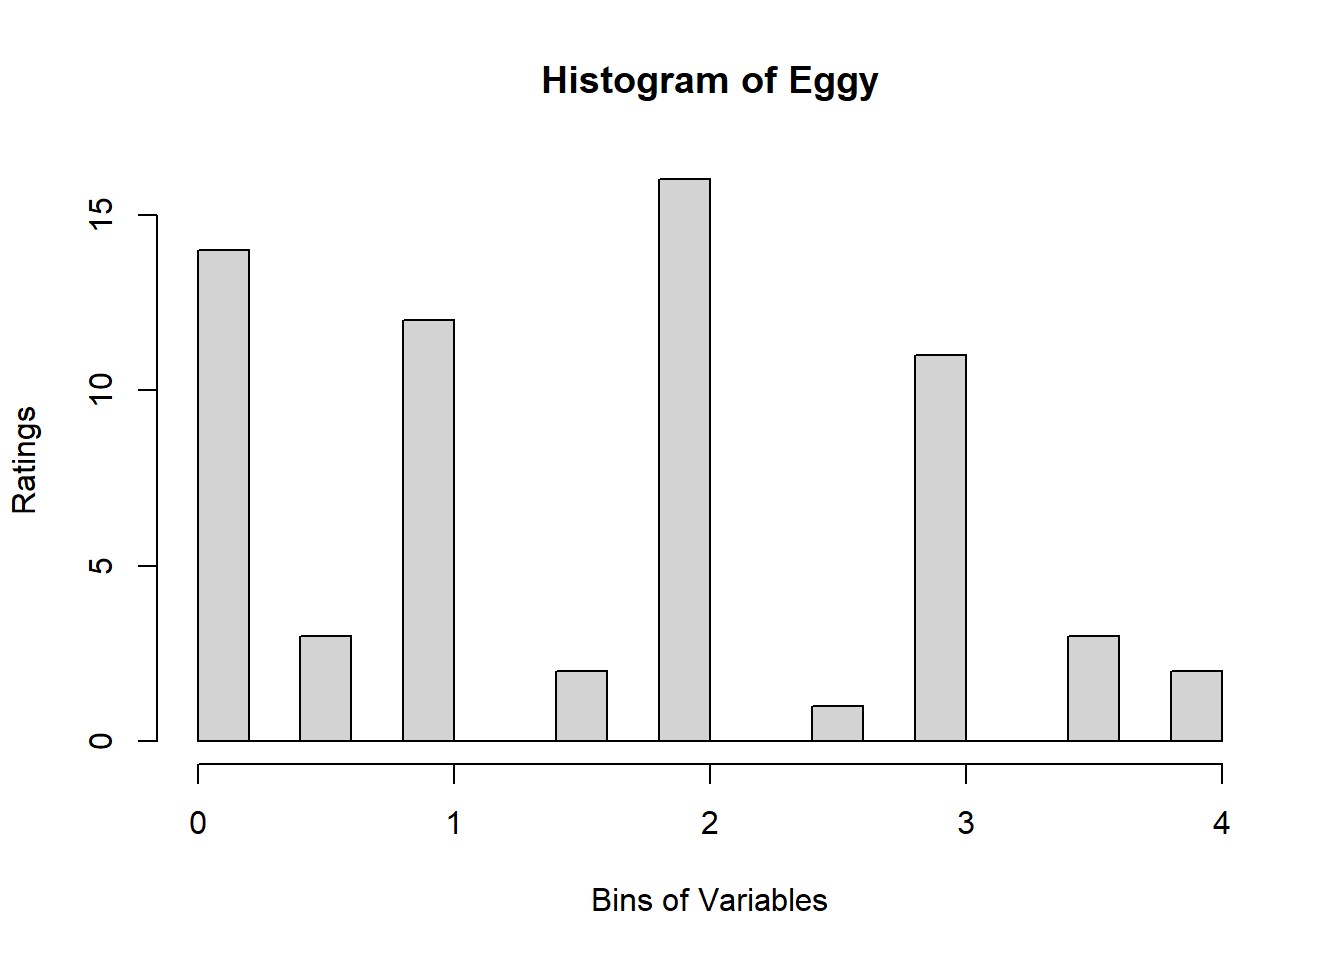
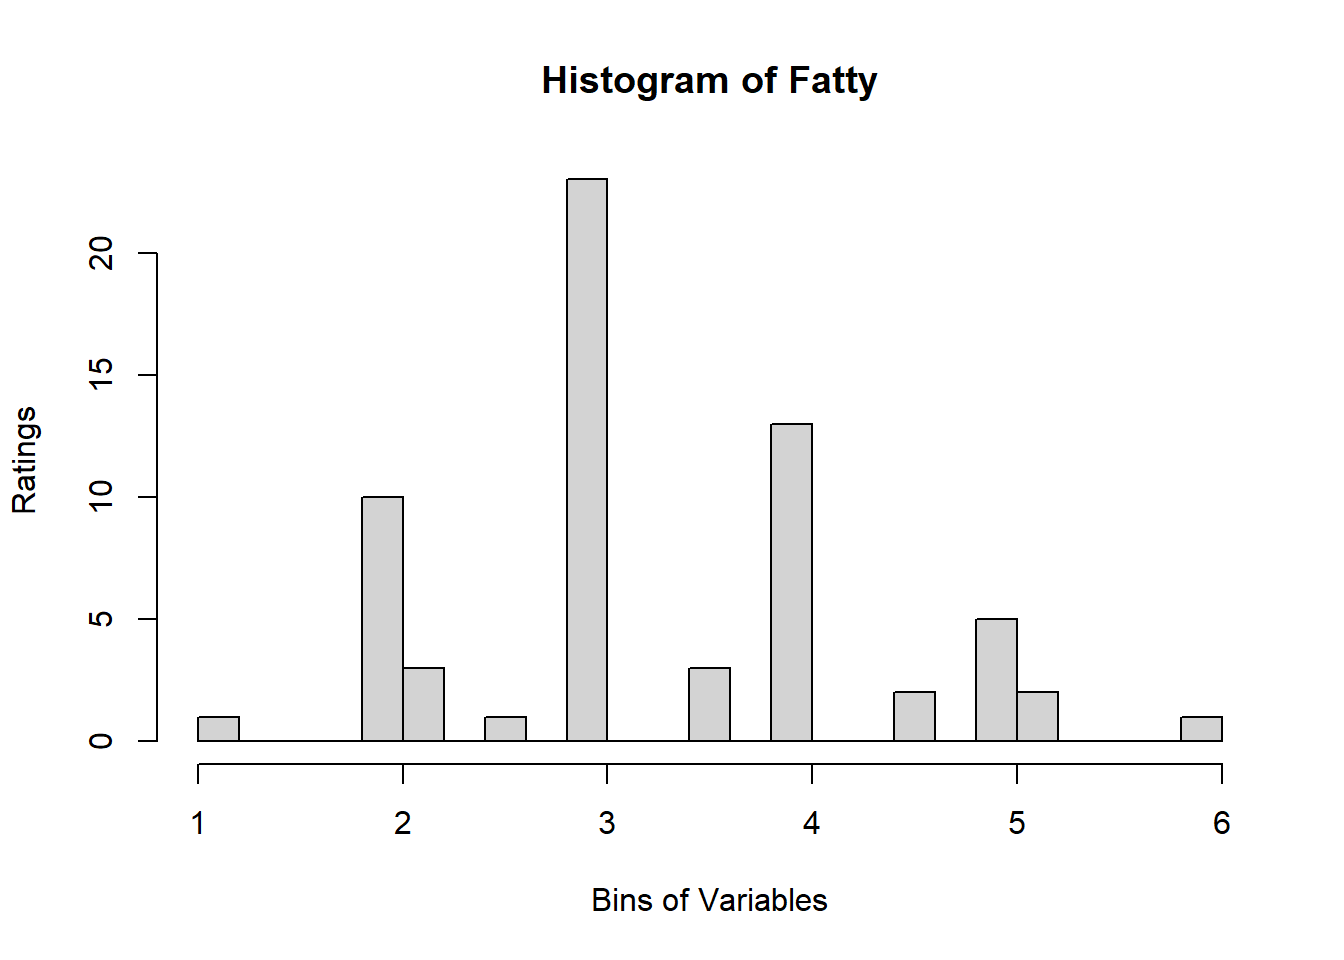
A quick look at Distribution of Variables:
for (i in 1:19) {
  hist <- hist(sausage.processed[,i], breaks = 20,
  main = paste("Histogram of" ,colnames(sausage.processed)[i]),
  xlab = "Bins of Variables",
  ylab = "Ratings")
} 
Binning using BinQuant:
We make the matrix space to store the dplyr::recoded data. Here we use the same dimensions as the original data and fill in with NA to signal if the data was not successfully filled.
# create a space to store our binning results and spearman
bin_data  <- matrix(rep(NA,nrow(sausage.processed)),nrow =
                         nrow(sausage.processed), ncol = ncol(sausage.processed)
                         )
colnames(bin_data) <- colnames(sausage.processed)
rownames(bin_data) <- wk0$Product
We use this loop along with a try catch to skip the varibles that BinQuant cannot bin. We see that the issue irise when nclass is larger than 1. Here, at nclass = 4, we see 3 variables with error. We will go in to bin_data to find which one it is then manually bin ourselves.
# we use this loop along with a try catch to skip the varibles that BinQuant cannot bin.
for (i in 1:19) {
    tryCatch({
  var_clust = which(colnames(sausage.processed) == colnames(sausage.processed)[i])
  bin_data[,colnames(sausage.processed)[var_clust]] <- BinQuant(
                     sausage.processed[,var_clust], nClass = 4, stem = '')
  }, error=function(e){cat("ERROR :",conditionMessage(e), "\n")})
}
## ERROR : 'breaks' are not unique
## ERROR : 'breaks' are not unique
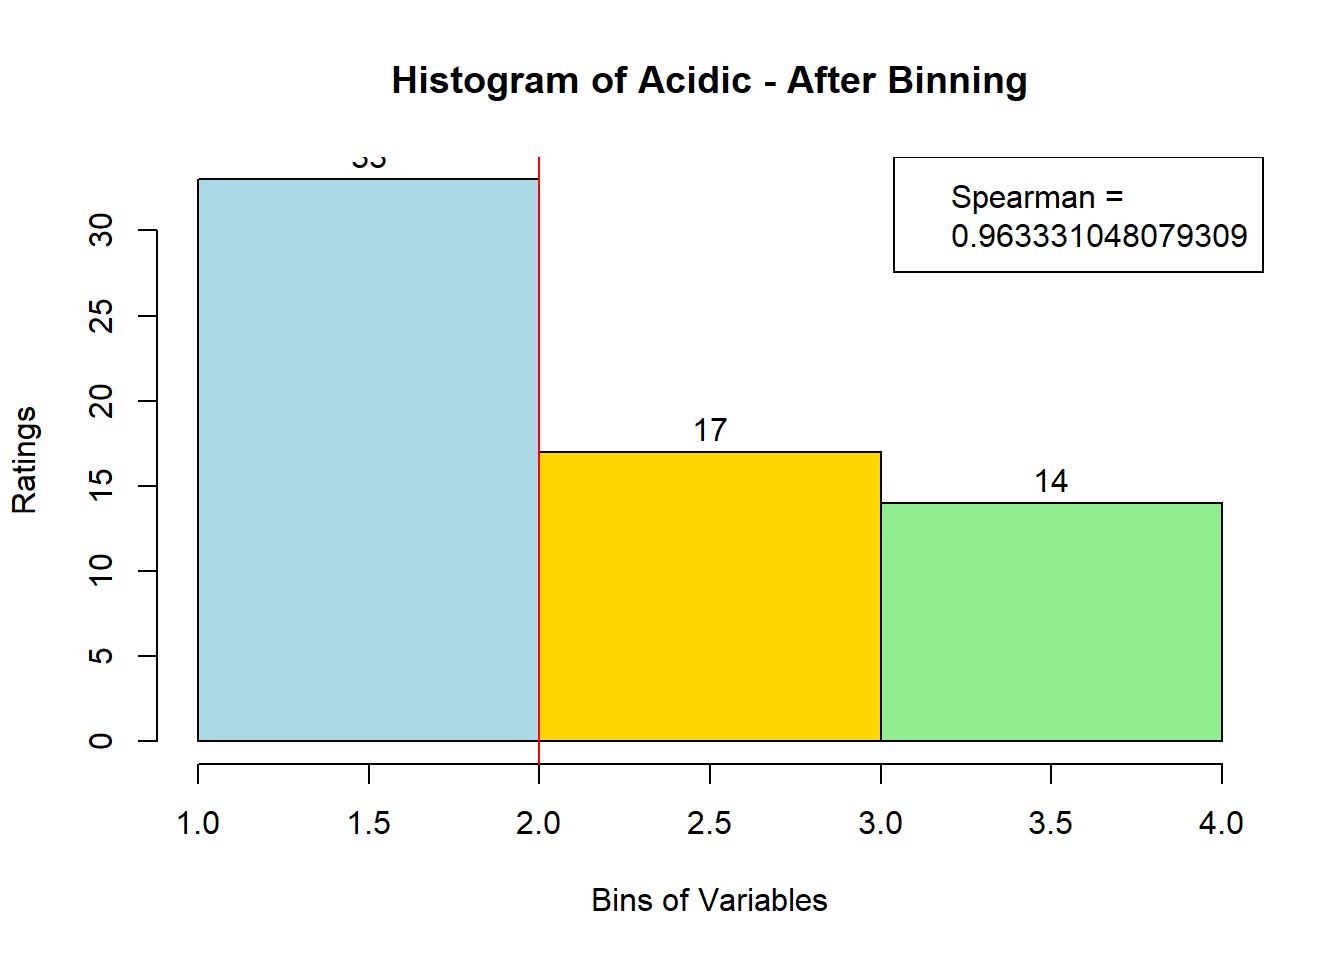
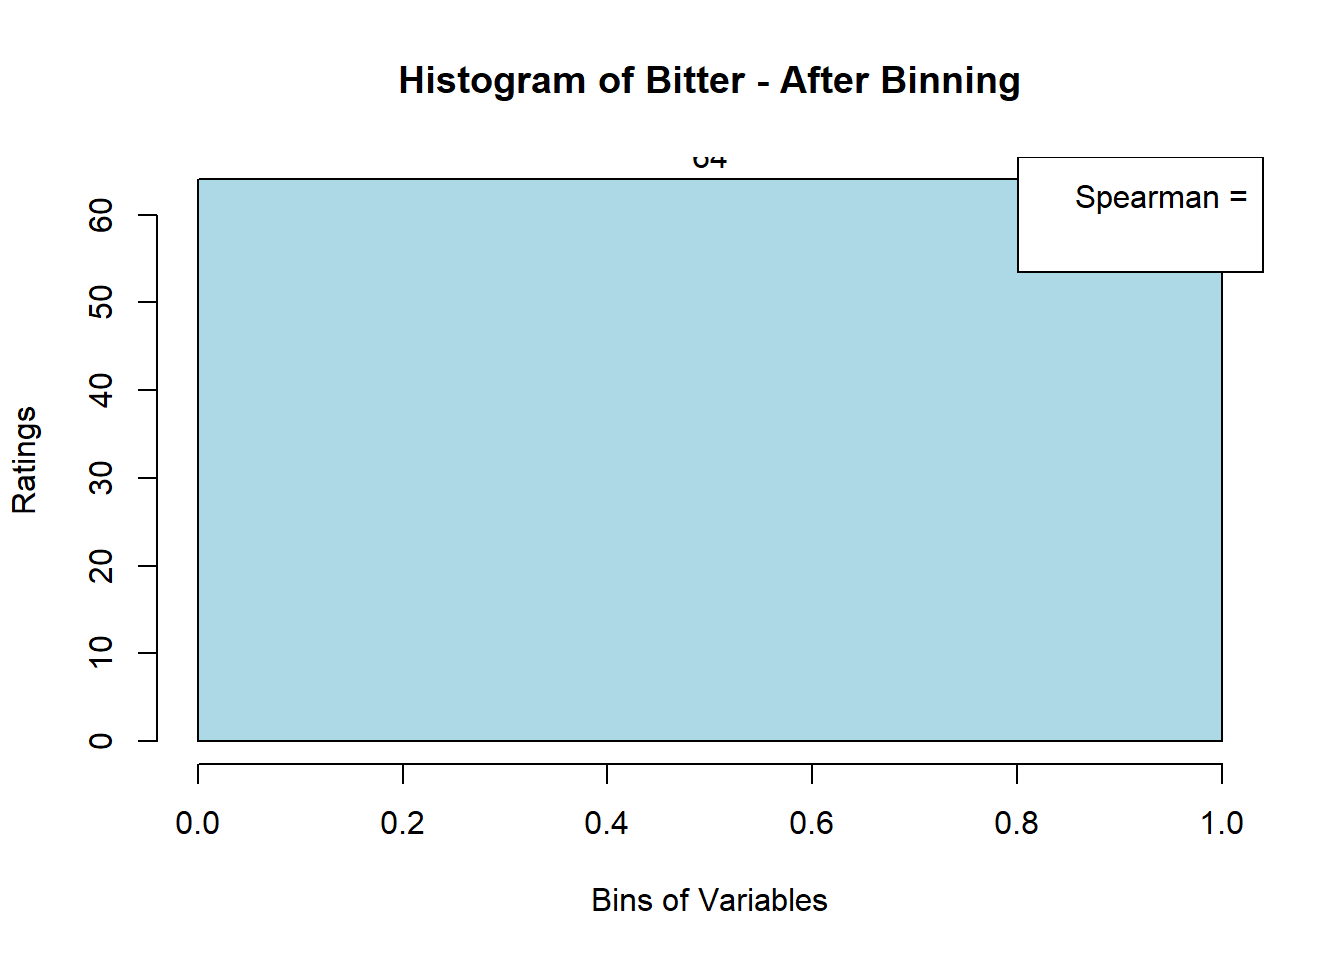
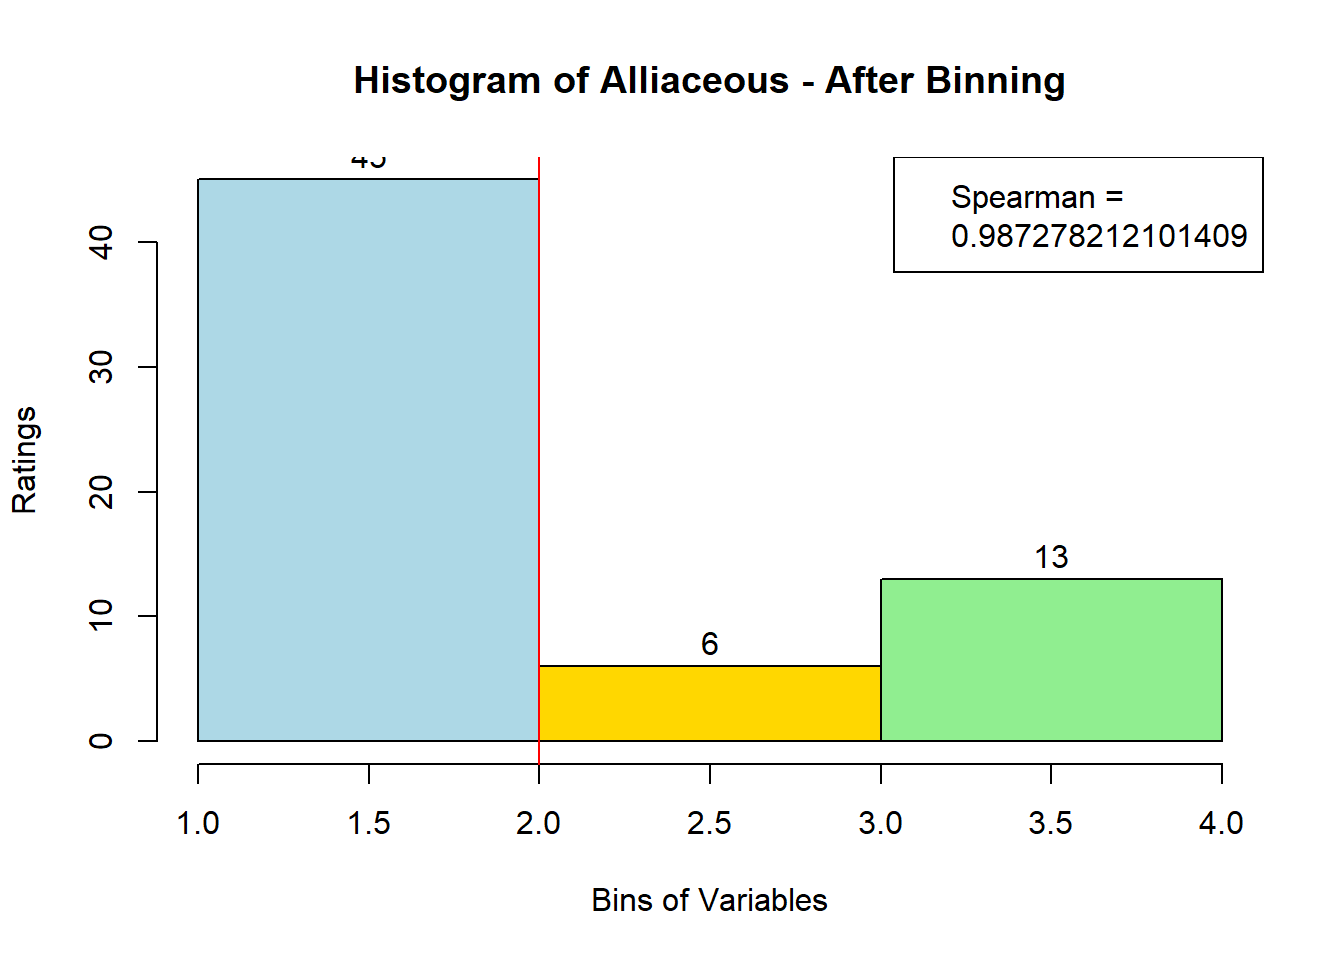
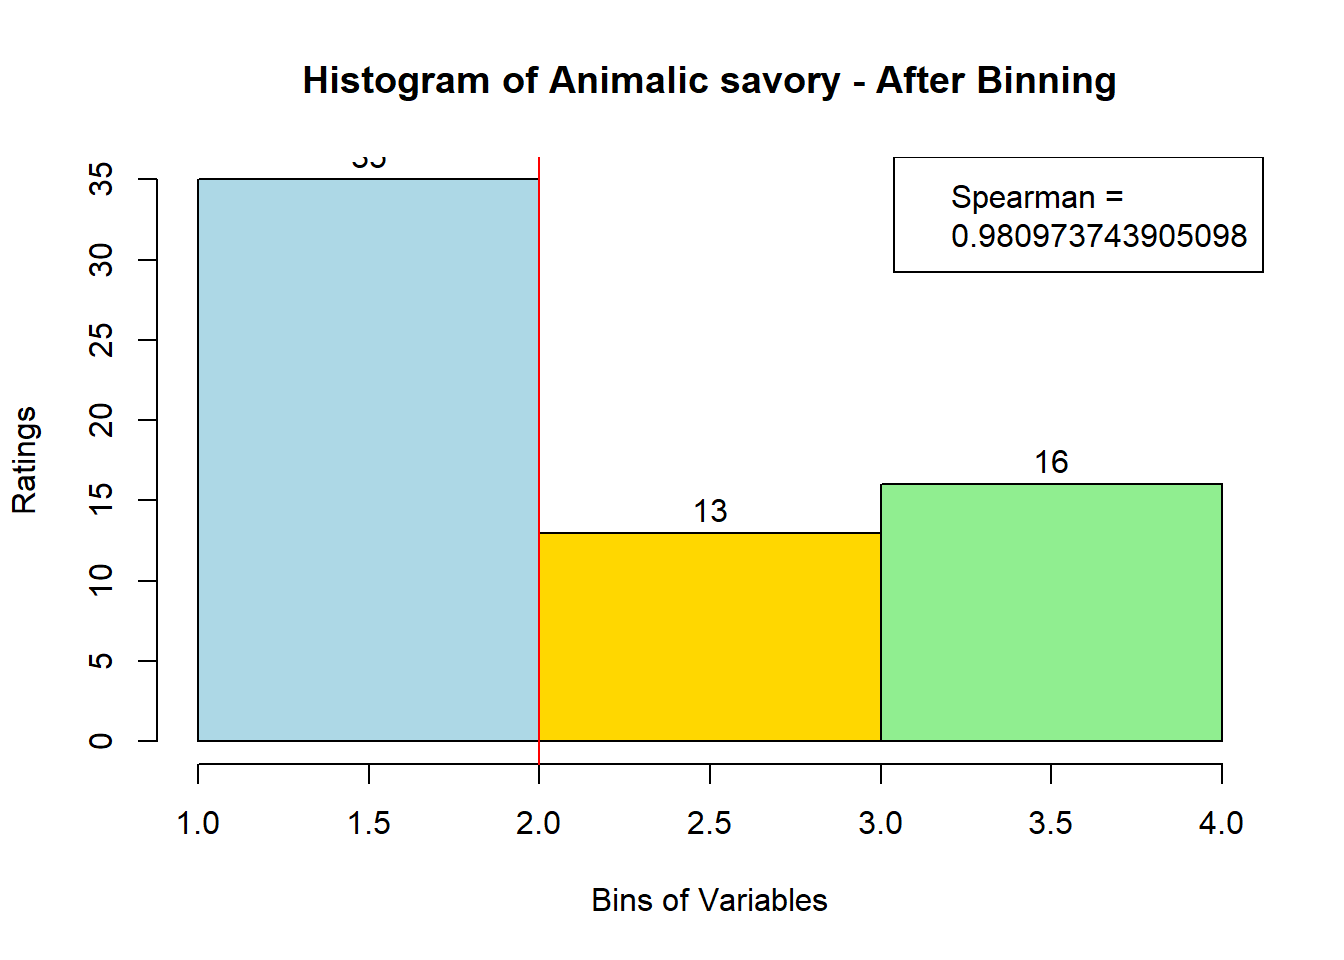
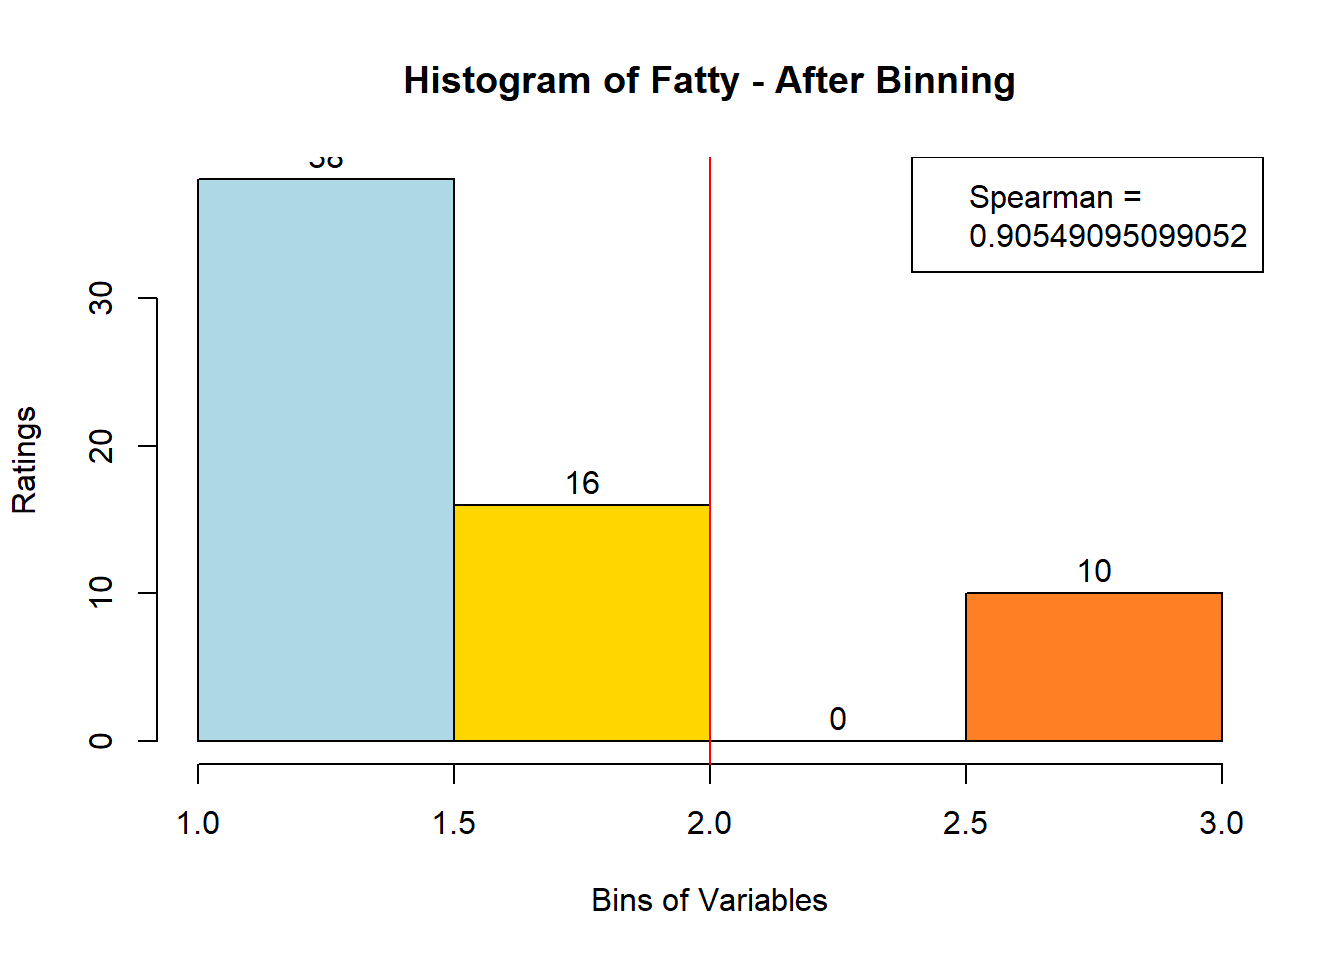
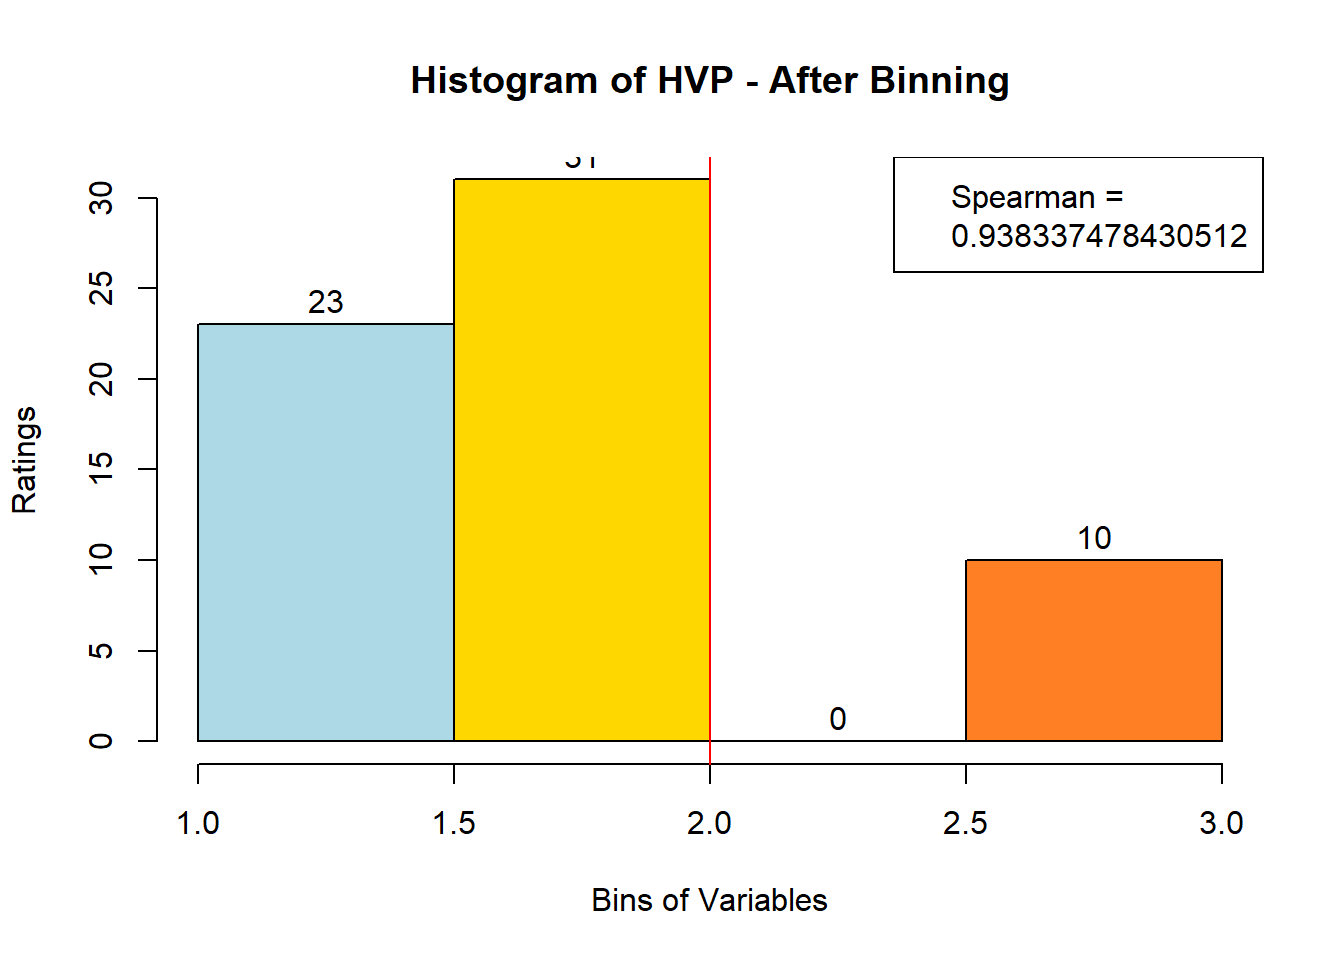
## ERROR : 'breaks' are not uniqueNext, after looking at the newly-filled bin_data, we see that 3 variables (Bitter-6, Fatty-13, HVP-14) had issue. We will attempt to bin them manually. Suspected reason:
# variable Bitter - works only when nclass = 1
var_clust = which(colnames(sausage.processed) == colnames(sausage.processed)[6])
bin_data[,colnames(sausage.processed)[var_clust]] <- BinQuant(
sausage.processed[,var_clust], nClass = 1, stem = '')
# variable Fatty - works when nclass = 3
var_clust = which(colnames(sausage.processed) == colnames(sausage.processed)[13])
bin_data[,colnames(sausage.processed)[var_clust]] <- BinQuant(
sausage.processed[,var_clust], nClass = 3, stem = '')
# variable Fatty - works when nclass = 3
var_clust = which(colnames(sausage.processed) == colnames(sausage.processed)[14])
bin_data[,colnames(sausage.processed)[var_clust]] <- BinQuant(
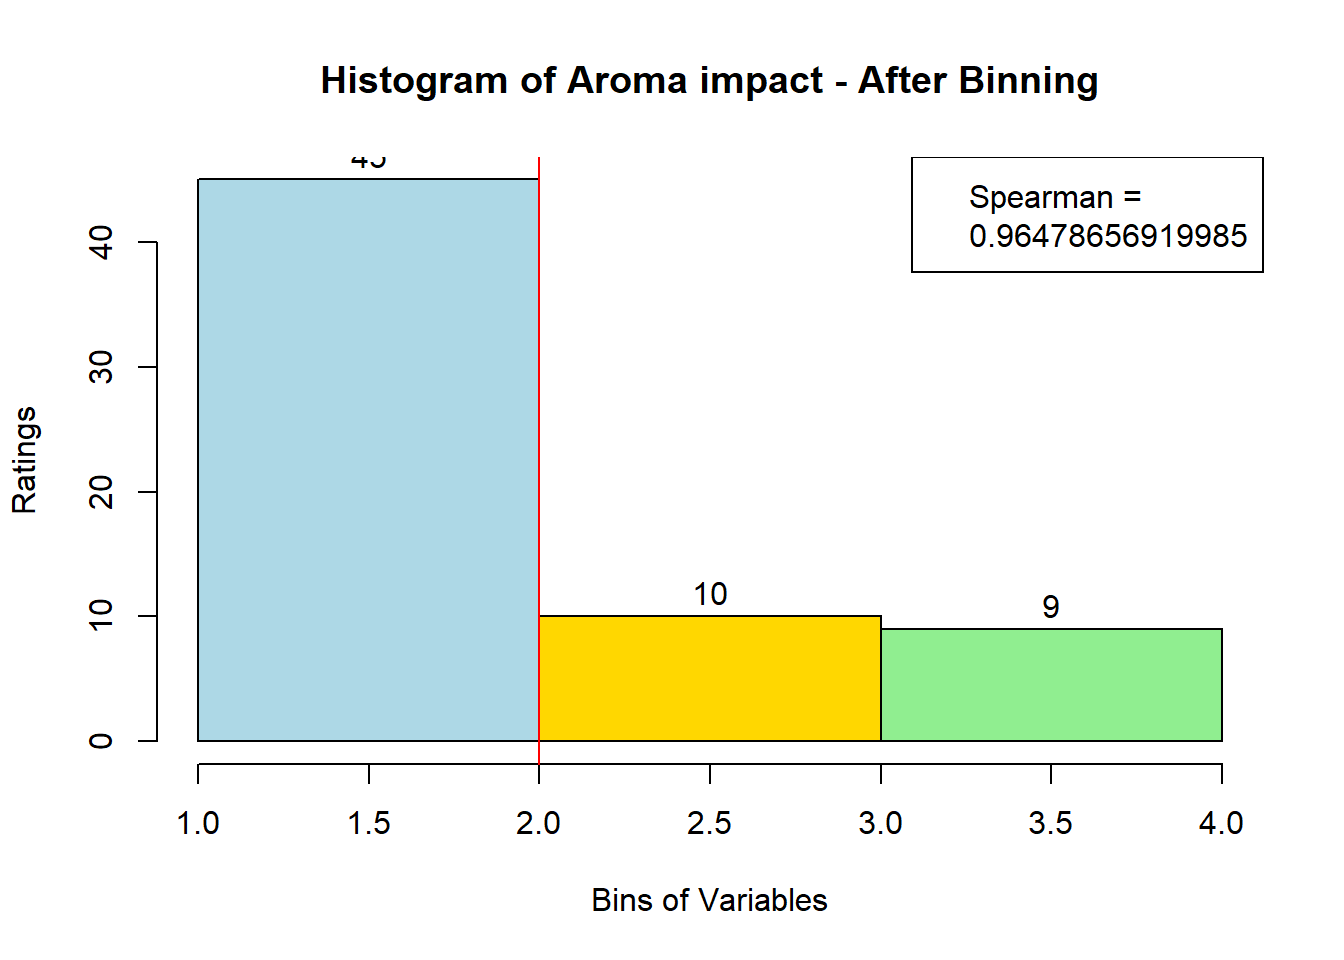
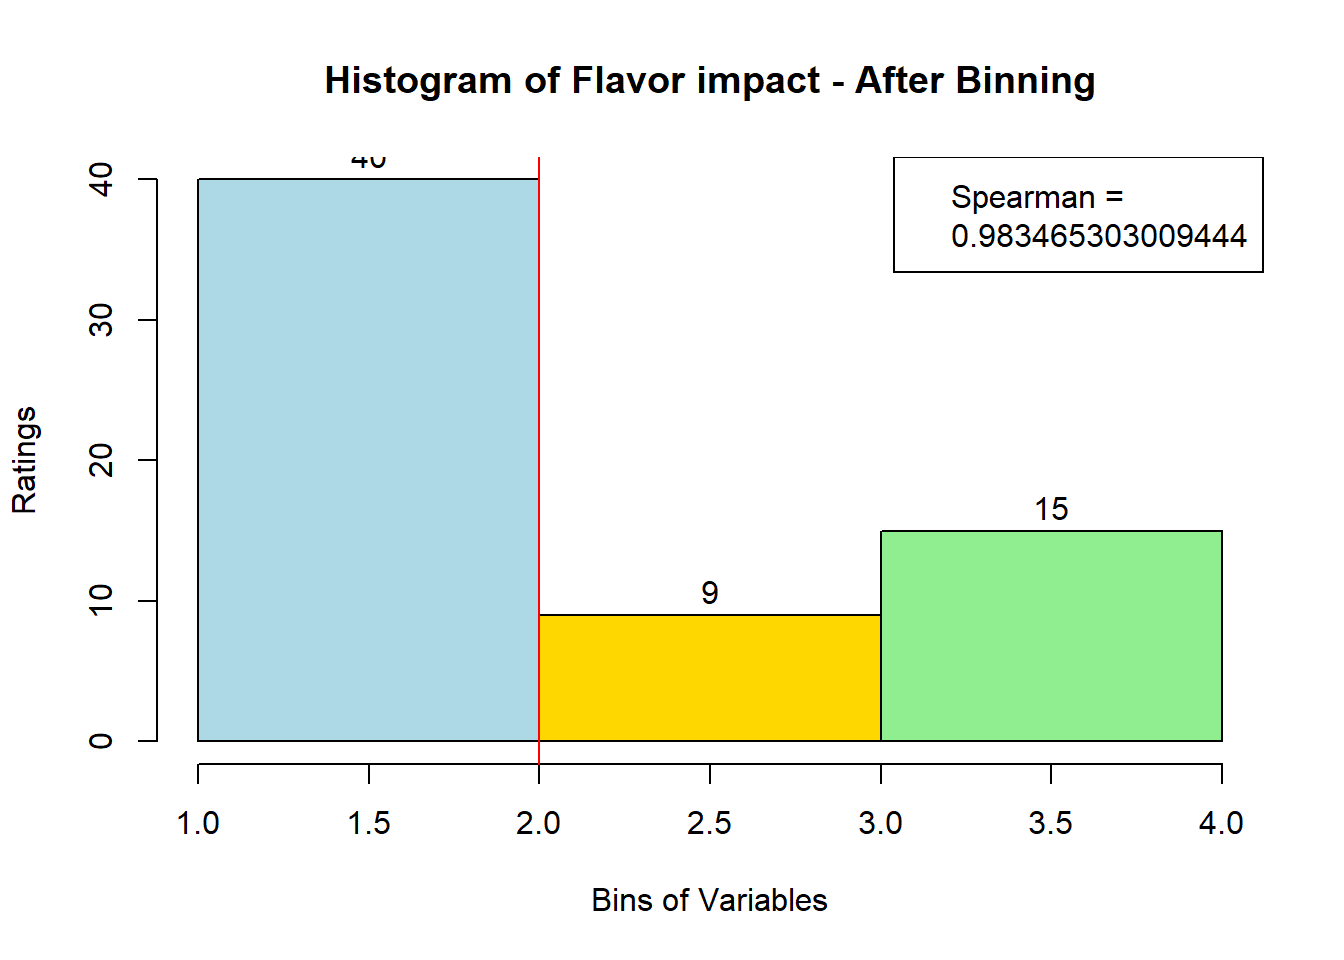
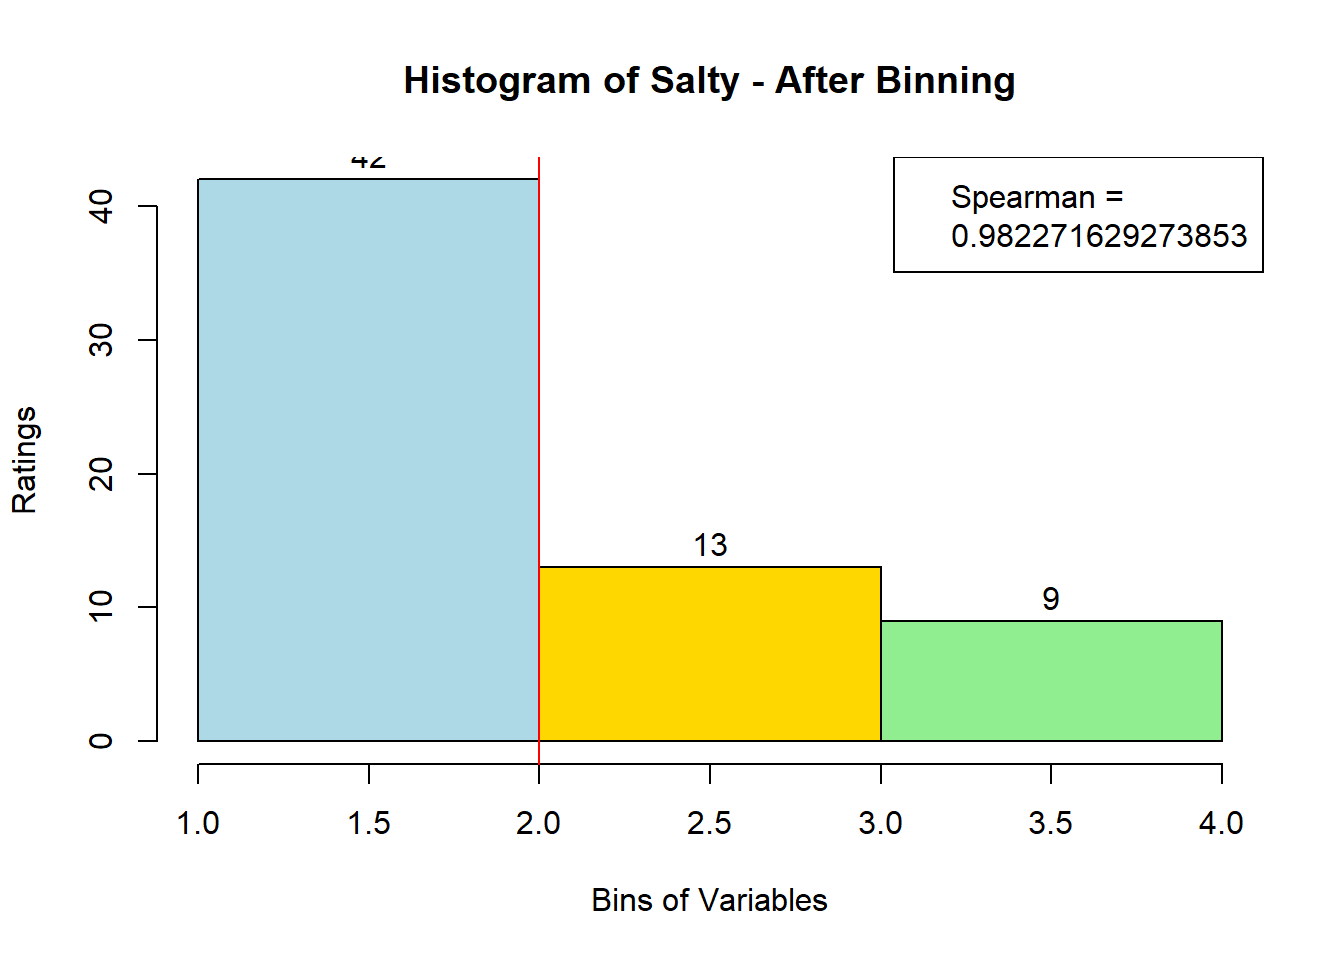
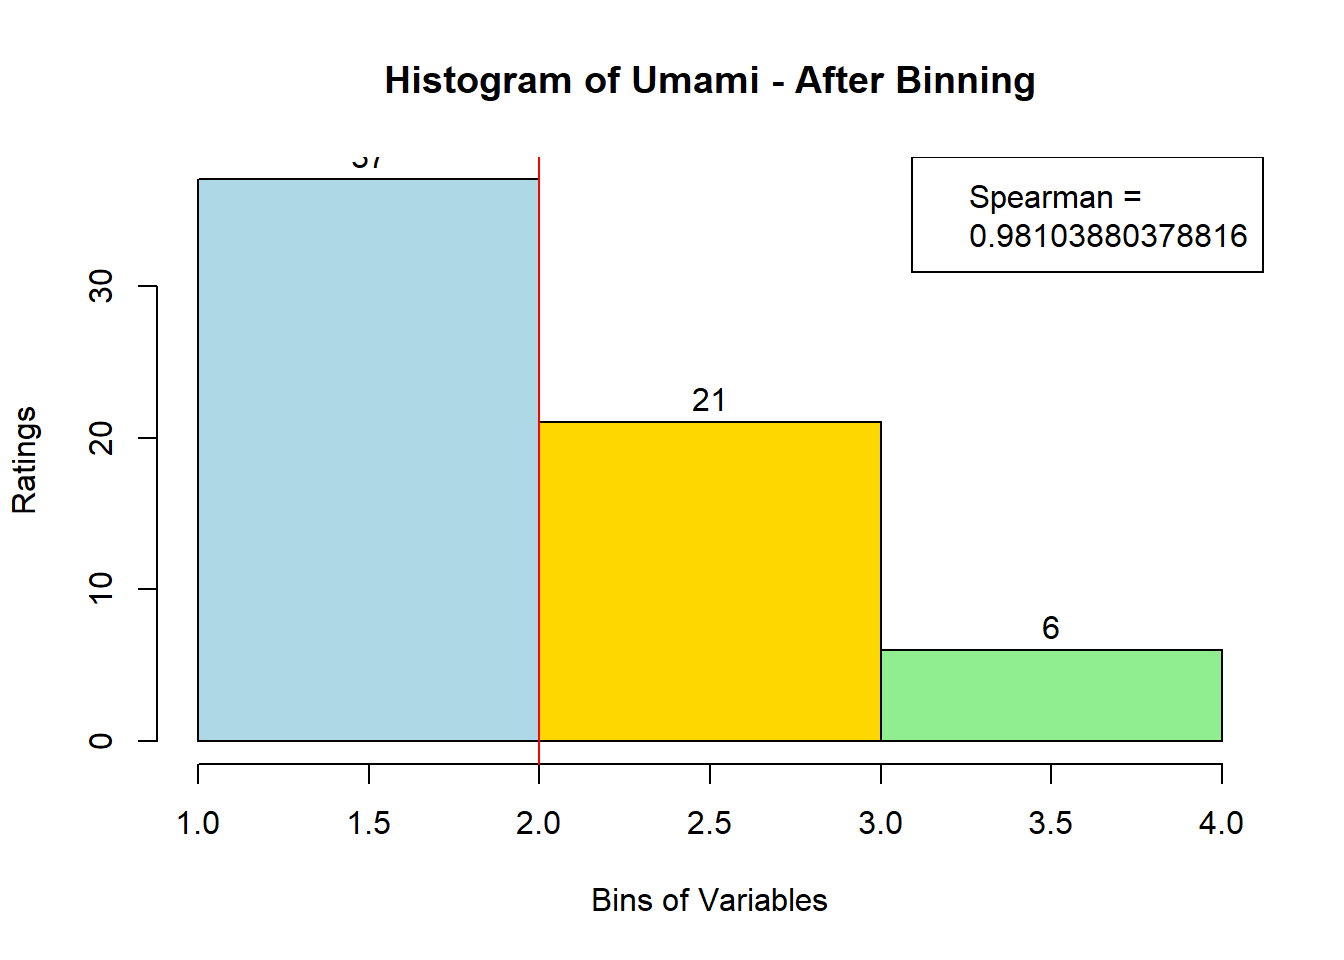
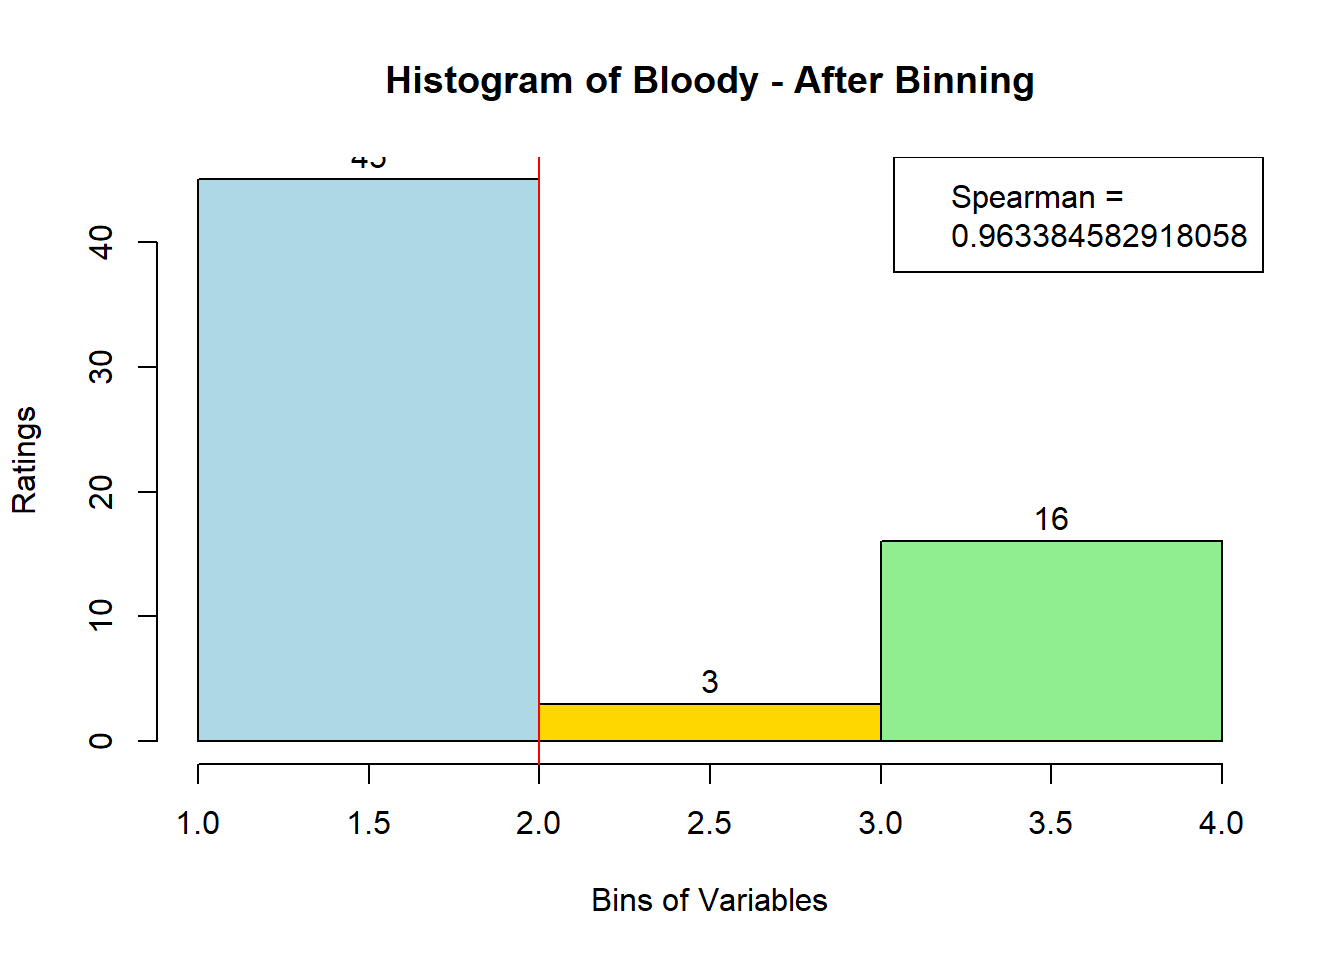
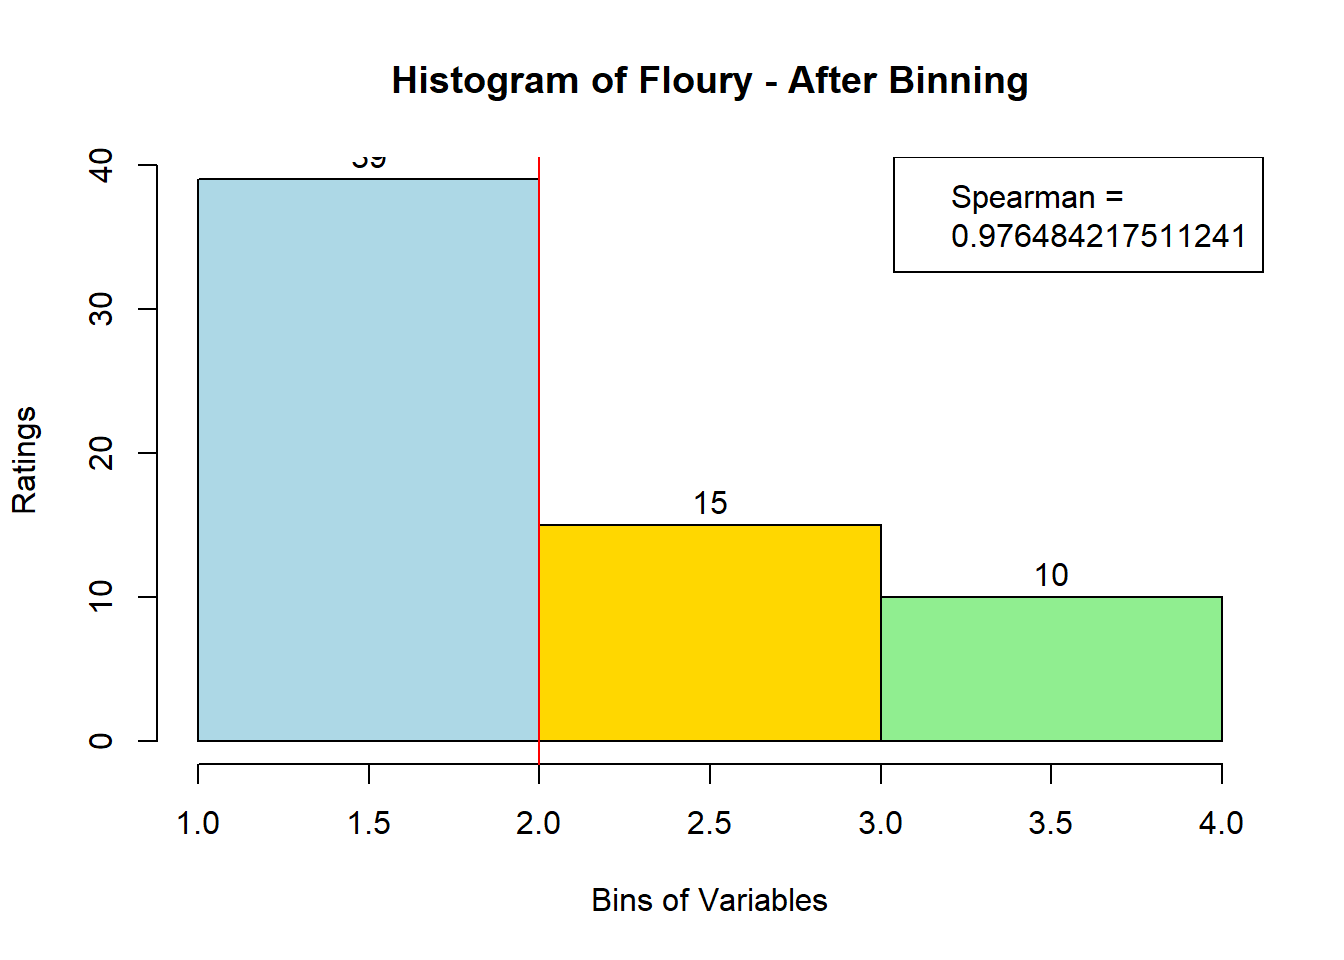
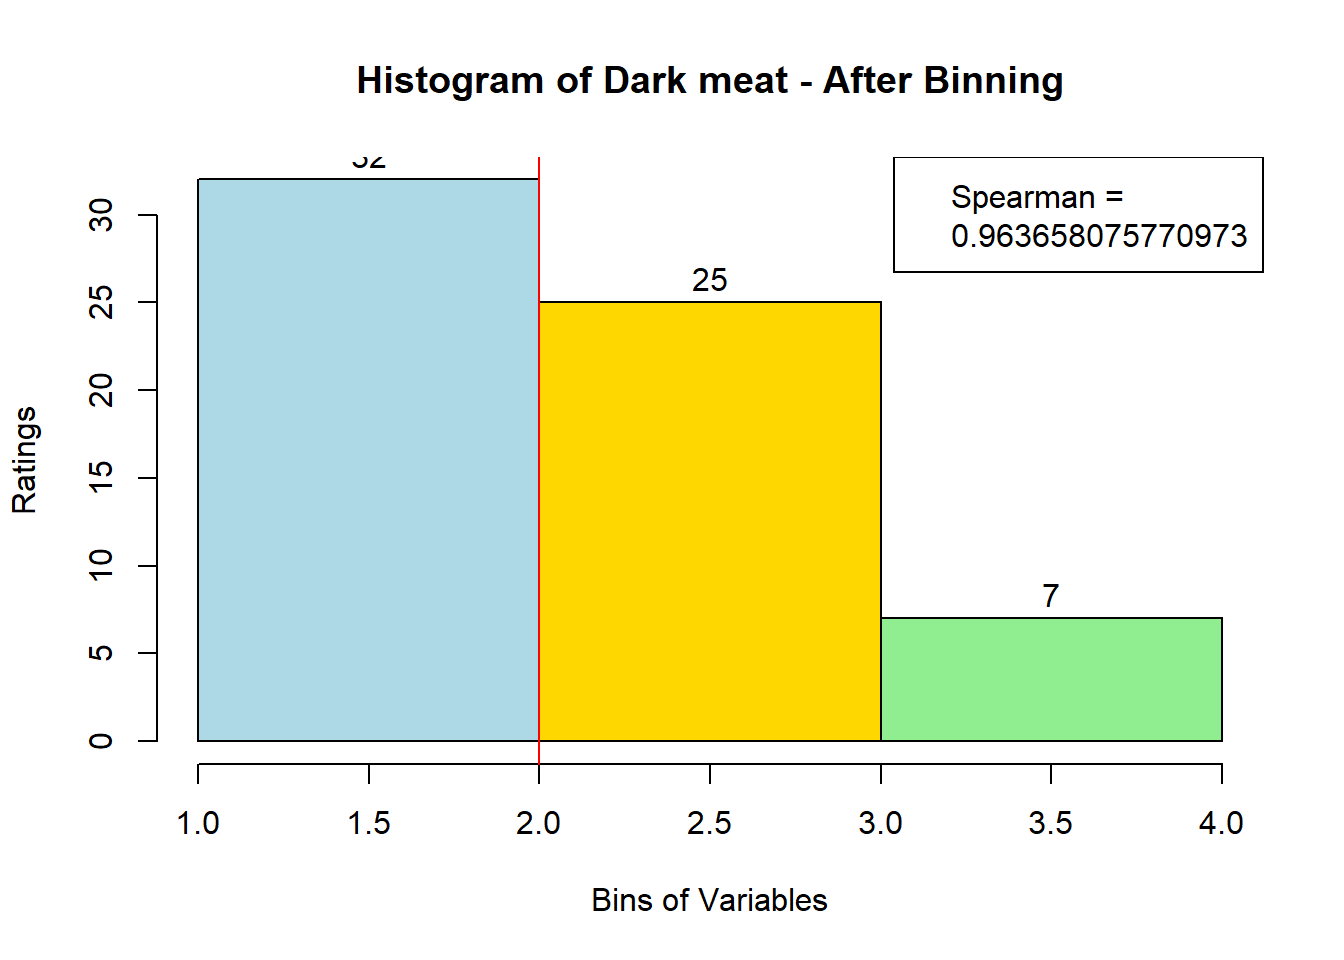
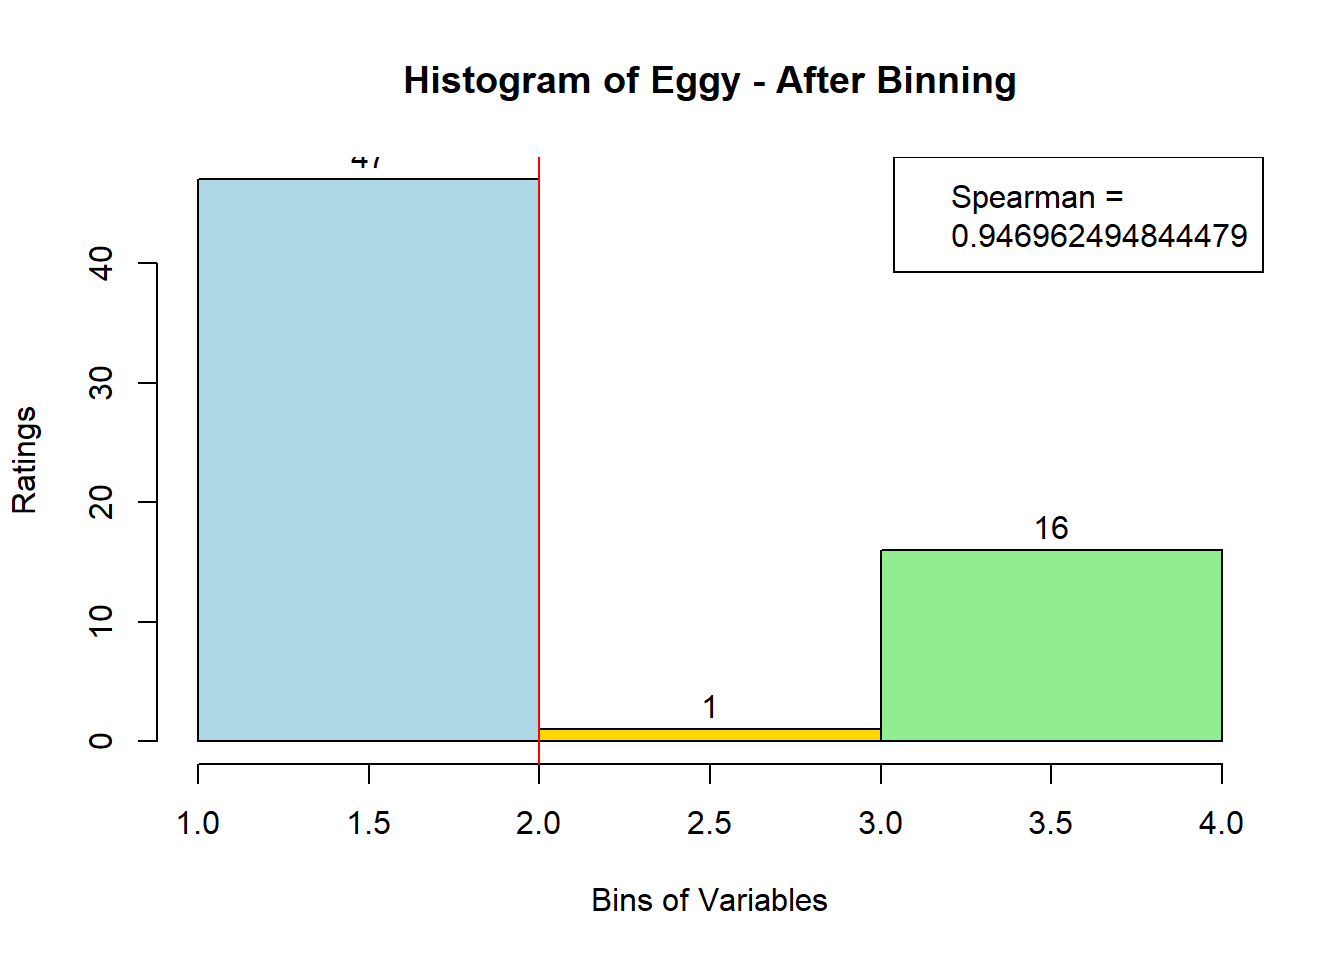
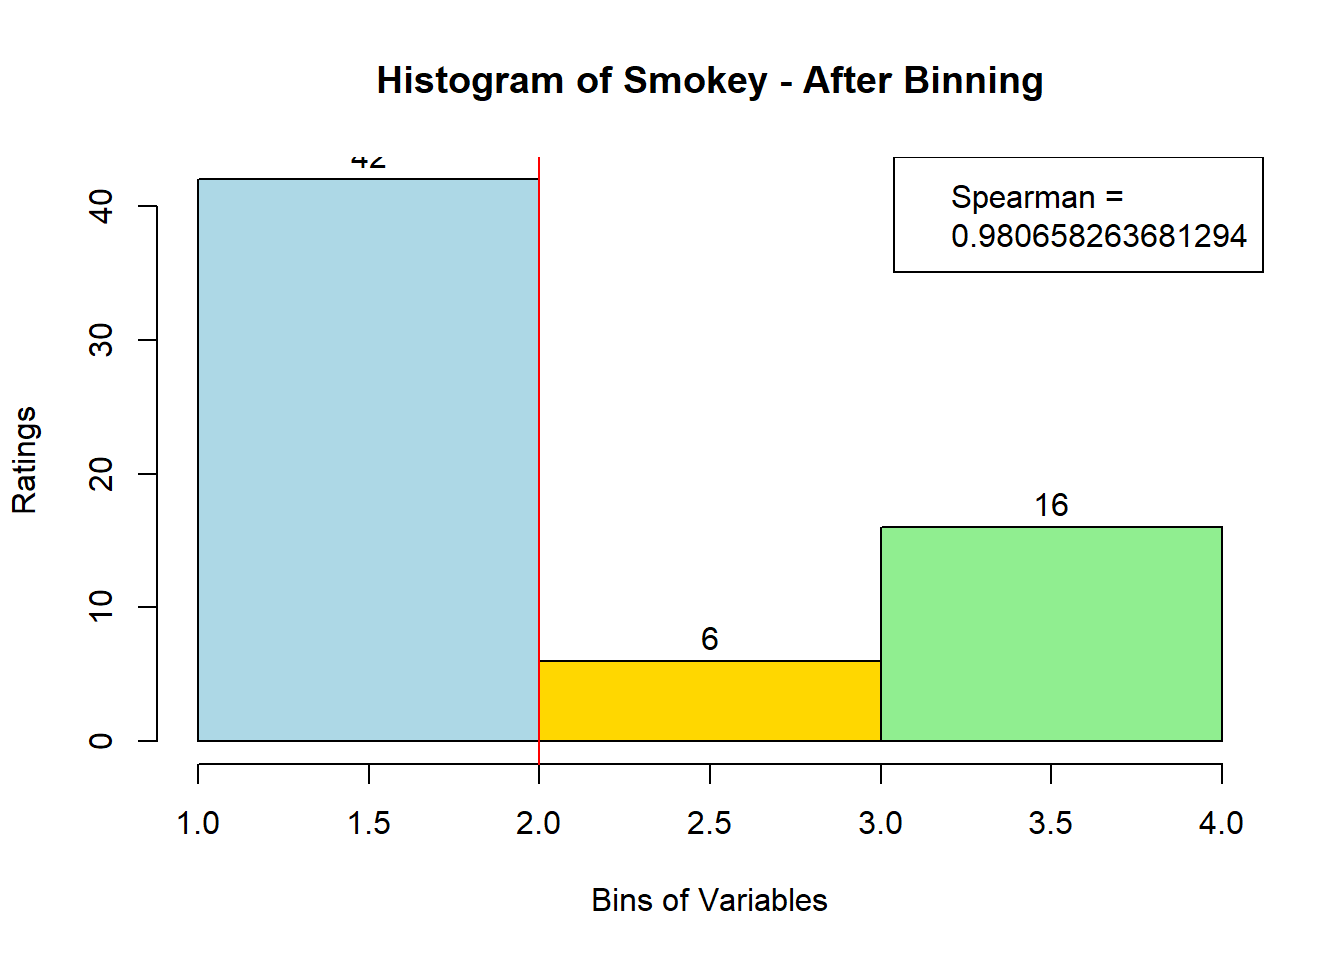
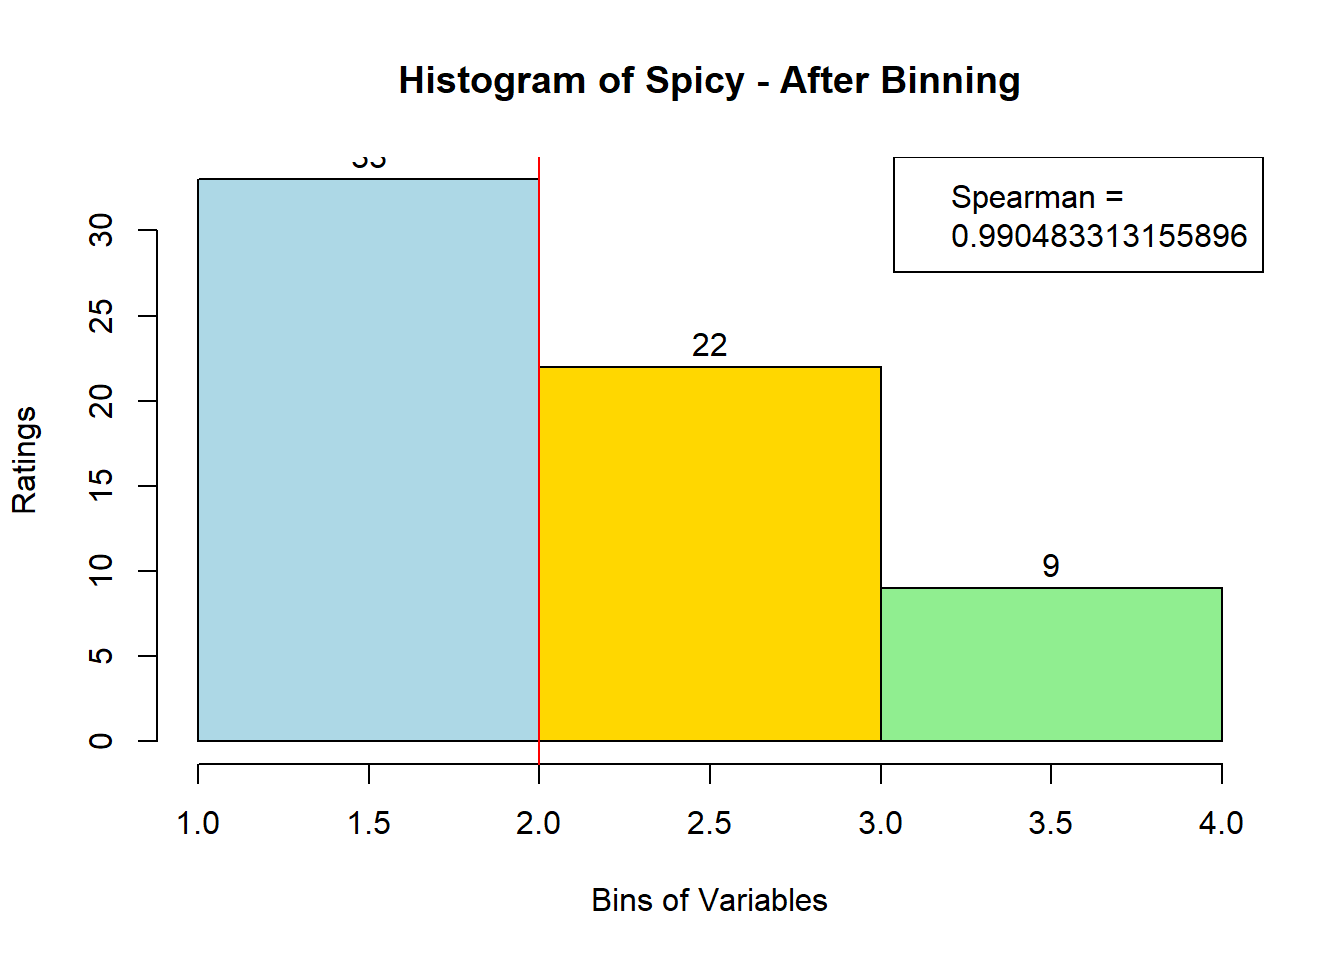
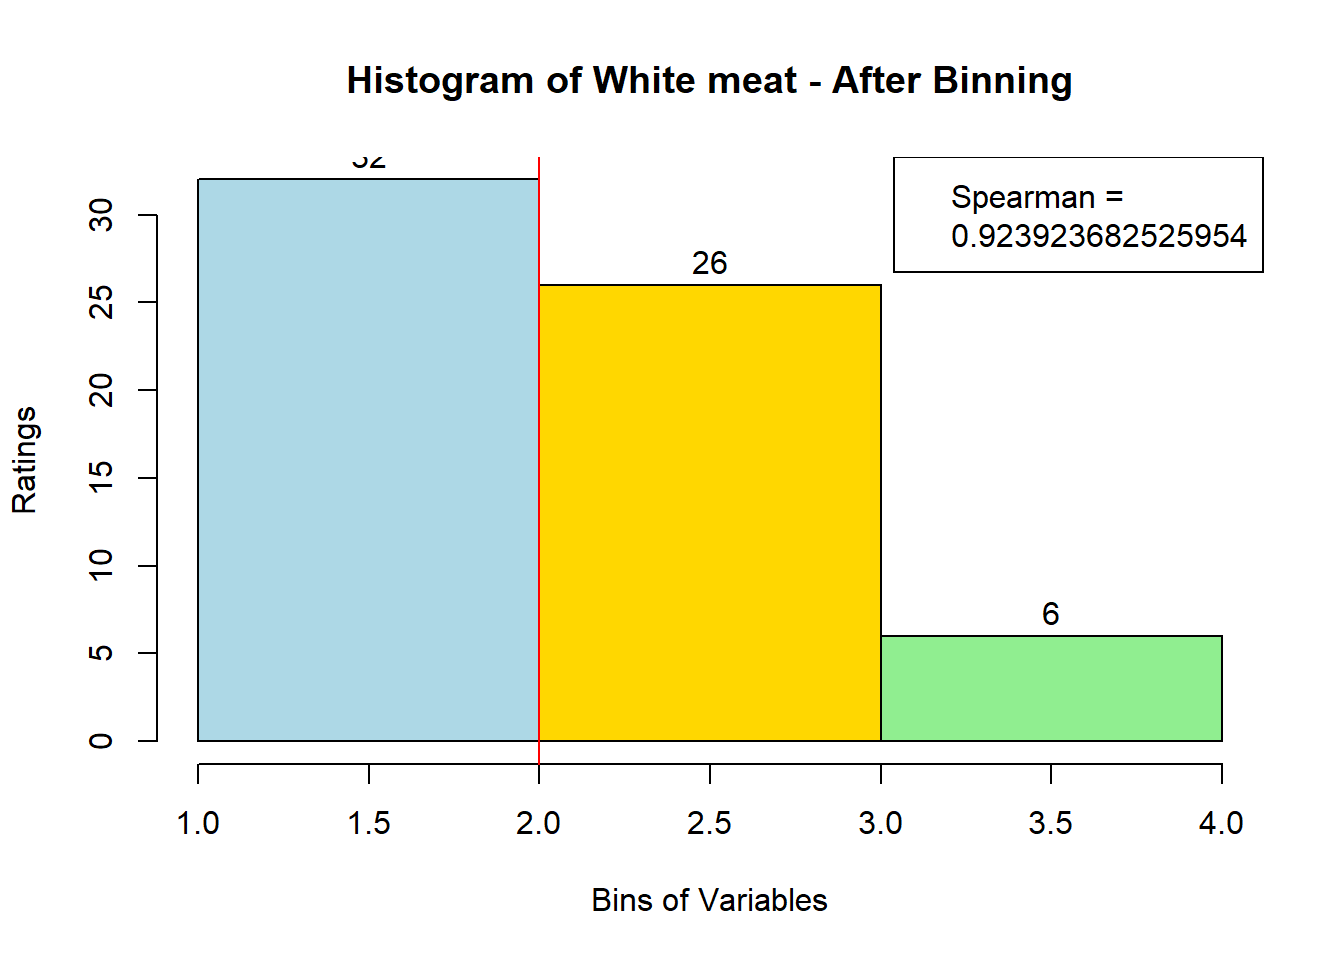
sausage.processed[,var_clust], nClass = 3, stem = '')Distribution, Sample size, and Spearman Correlation after Binning:
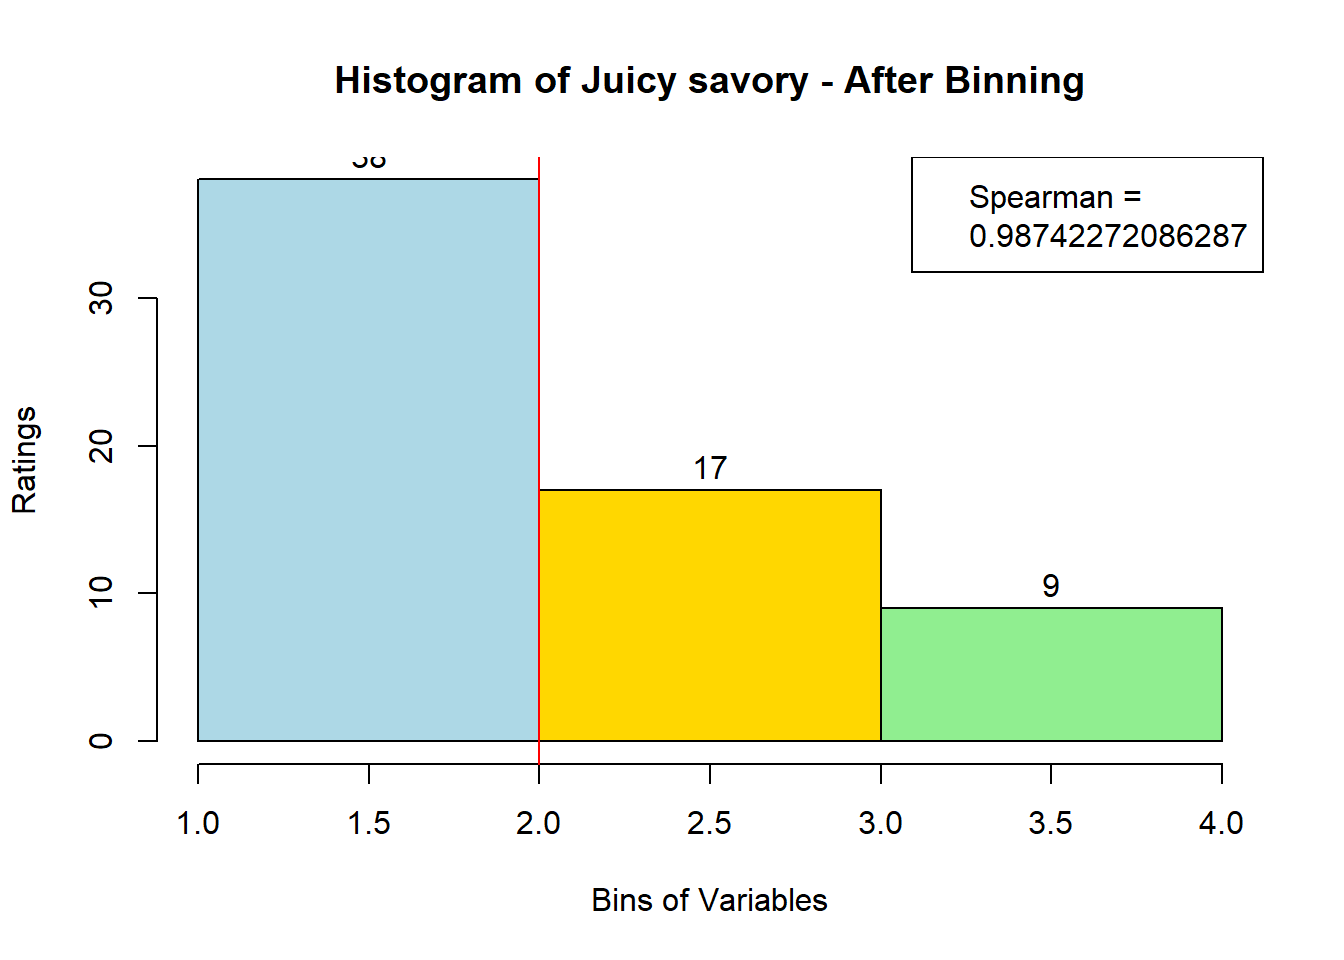
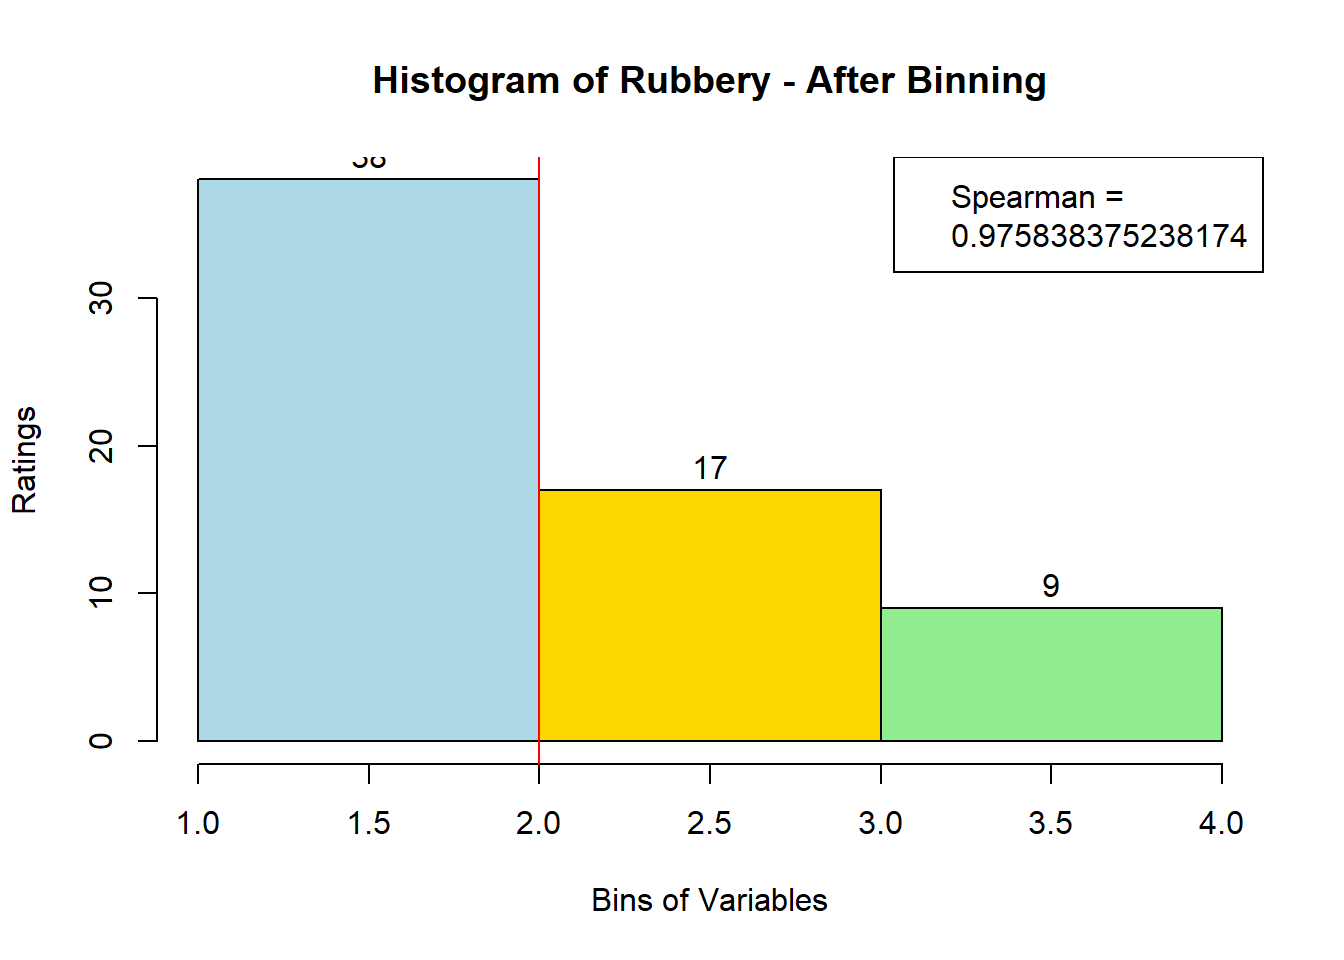
for (i in 1:19) {
  hist <- hist(bin_data[,i], breaks = 4,
  main = paste("Histogram of" ,colnames(sausage.processed)[i], "- After Binning"),
  xlab = "Bins of Variables",
  ylab = "Ratings",
  labels = TRUE,
  col = c("lightblue", "gold", "lightgreen", "chocolate1")
  )

  Spearman <- cor(sausage.processed[,i], bin_data, method = "spearman")

  hist <- legend("topright", legend = c("Spearman =", Spearman[i]))

  hist <- abline(v = 2, col = "red")

}