Chapter 1 Simple Data Science Process
The data science process has 6 parts as shown in Figure 1.1 .2
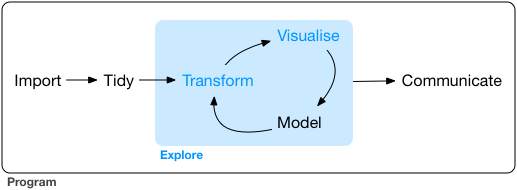
Figure 1.1: Data science process
Data import, data tidying, data transformation and processing, visualization, modeling, and the formation of repeatable reports should all be done in one integrated environment and program. The entire analysis and exploration process should be completed in one program code. This method is very helpful for training our data thinking. Thus three tools become indispensable when doing data science in R.
Please refer to the guide here to get started on RStudio.
1.1 The tidyverse family
The tidyverse is a collection of R packages designed for data science as shown in Figure 1.26. All packages share an underlying design philosophy, grammar, and data structures.
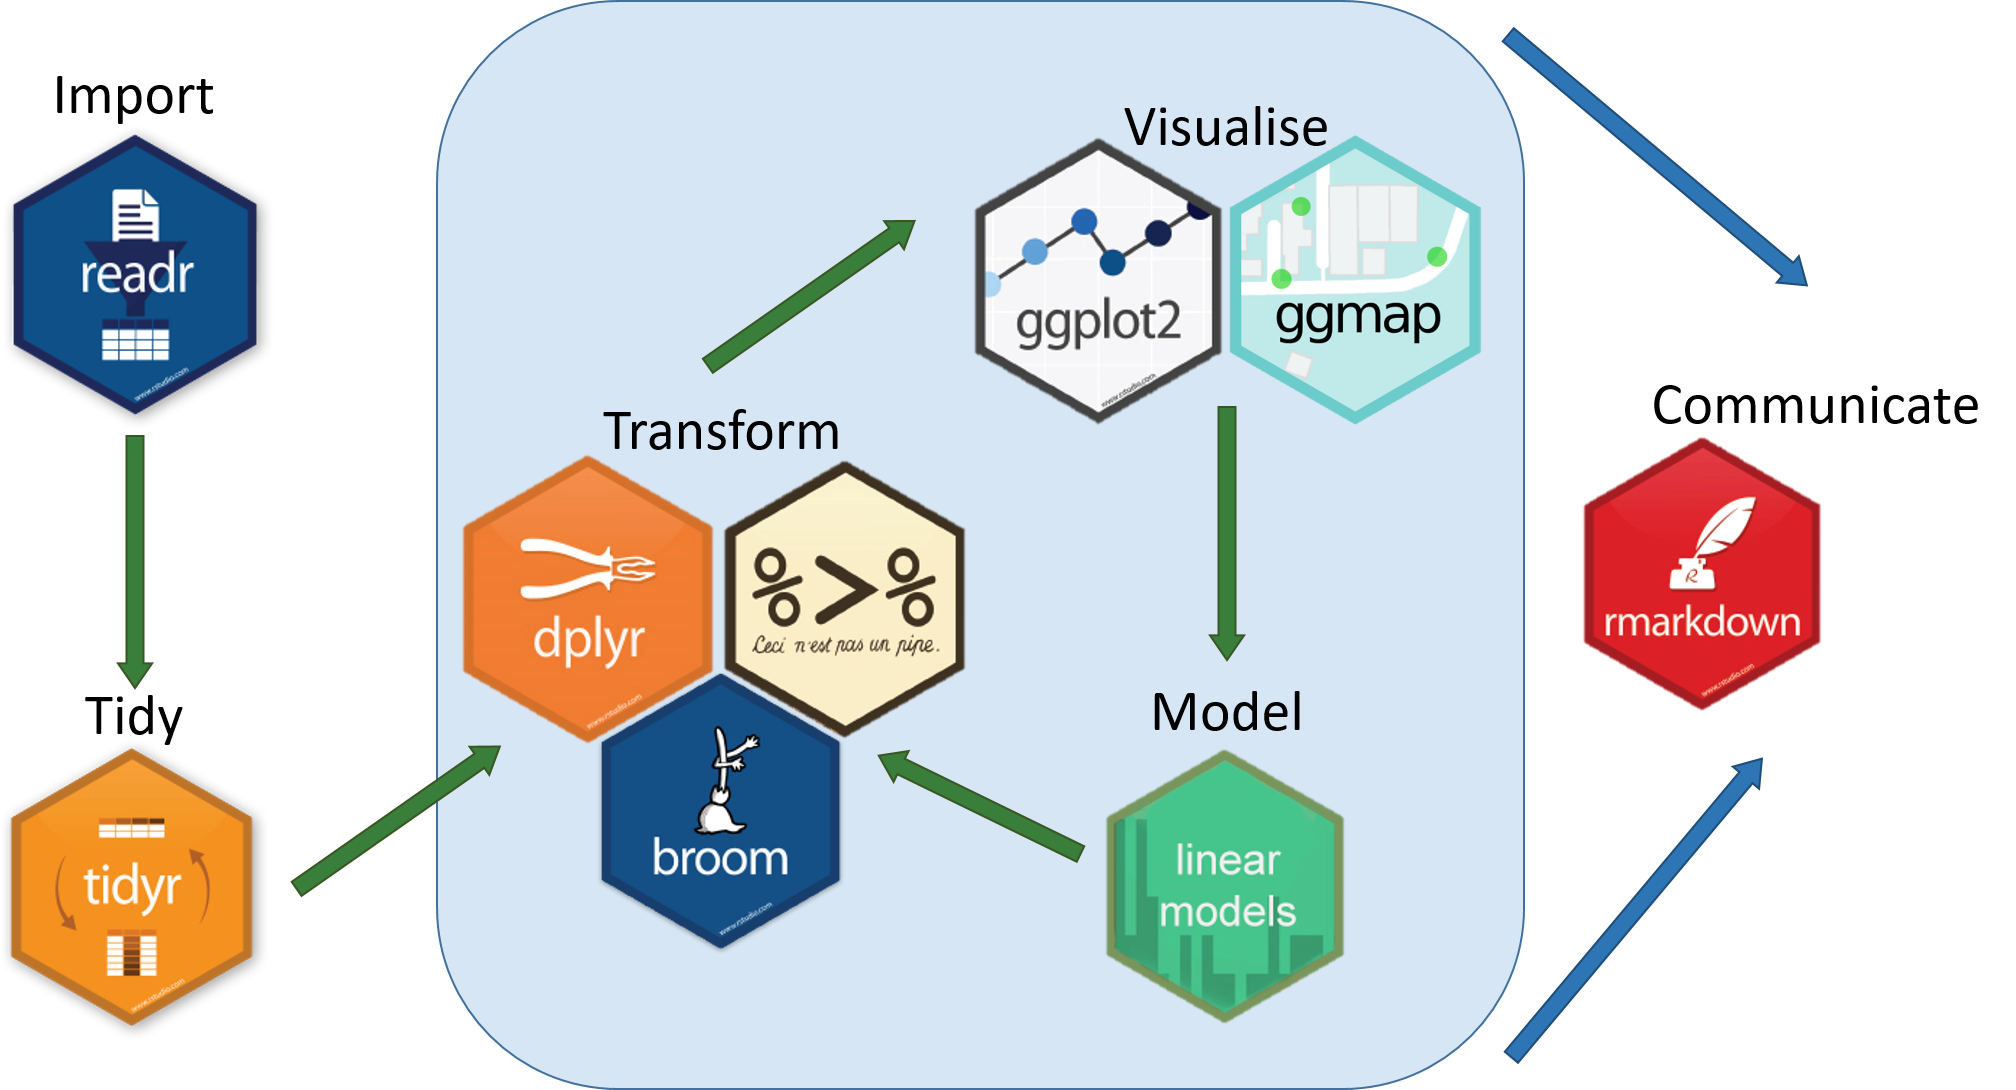
Figure 1.2: Components of Tidyverse package
1.2 Set up and load packages
We set up our R working environment by activating the following packages that we will use in Part I, Part II, and Part III. Readers will have to download and install these packages on their respective computers first before running the following chunk of R code. We will repeat the library function to activate other packages as we need them.
library(dplyr)
library(tidyverse)
library(readr) # Loading the data
library(tidyr)
library(sf) # For the maps
library(sp) # Transform coordinates
library(ggplot2)
library(viridis)
library(igraph) # build network
library(spdep) # builds network
library(tidygraph)
library(ggraph) # for plotting networks
library(cowplot)
library(zoo)
1.3 Data Preparation
Based on the process shown in Figure 1.1 we must first import our Malaysian Covid data from an external source into R. The data will be in an R data frame and/or tibble. There are differences between the two formats but the later versions of R will default to a tibble. We will use the terms dataset, data frame, and tibble interchangeably. The last two terms have a specific meaning in R.
1.4 Importing data
R can import data from almost any source; text files, Excel spreadsheets, and databases. The Malaysia Covid data are all in csv text files. So we will only show how to download such files into R data frames.
1.4.1 Open data on COVID-19 in Malaysia7
The scope and granularity of data in this depository will evolve over time. We “copy and paste” below the description of the csv datasets from the github depository.
- Cases and Testing
- cases_malaysia.csv: Daily recorded COVID-19 cases at country level, as of 1200 of date.
- cases_state.csv: Daily recorded COVID-19 cases at the state level, as of 1200 of date.
- clusters.csv: Exhaustive list of announced clusters with relevant epidemiological data points, as of 2359 of date of update.
- tests_malaysia.csv: Daily tests (note: not necessarily unique individuals) by type at country level, as of 1200 of date.
- Healthcare
- pkrc.csv: Flow of patients to/out of Covid-19 Quarantine and Treatment Centres (PKRC), with capacity and utilization as of 2359 of date.
- hospital.csv: Flow of patients to/out of hospitals, with capacity and utilization as of 2359 of date.
- icu.csv: Capacity and utilization of intensive care unit (ICU) beds as of 2359 of date.
- Deaths
- deaths_malaysia.csv: Daily deaths due to COVID-19 at country level, as of 1200 of date.
- deaths_state.csv: Daily deaths due to COVID-19 at the state level, as of 1200 of date.
- Vaccination
MoH collaborates with MoSTI and the COVID-19 Immunisation Task Force (CITF) to publish open data on Malaysia’s vaccination rollout.8
- vax_state.csv: Daily and cumulative vaccination at the state level, as at 2359 of date.
- Mobility and Contact Tracing
- checkin_malaysia.csv: Daily check-ins on MySejahtera at country level, as of 2359 of date.
- checkin_malaysia_time.csv: Time distribution of daily check-ins on MySejahtera at country level, as of 2359 of date.
- trace_malaysia.csv: Daily casual contacts traced and hotspots identified by HIDE, at country level, as of 2359 of date.
- Static data
- population.csv: Total, adult (18+), and elderly (60+) population at the state level.
Static data will (probably) remain unchanged for the duration of the program, barring an update from the source.
The readr package which is part of tidyverse as shown in Figure 1.2, provides functions for importing delimited text files into R data frames. These functions assume that the first line of the data contains the variable or column names, the values are separated by commas or tabs respectively and that missing data are represented by blanks. The good news is that all the csv files listed above follow this format, so we can simply download the raw data on an ’as-is" basis.
We run this R chunk for the first time to get the latest data. Then we safe the files in the R rds format and use it throughout the examples in the book. Readers should edit the R chunk below by removing the # comment at the beginning of the line for the commands to be executed. There are 3 groups of commands to
- Download the required files from the source into an
R data frame - Save the
R data frameinto the current working directory - Load the
R data frame
We chose to download only 8 of the csv datasets for now. We may add others later. Note that the vax_state.csv file is downloaded from another depository.
library(readr)

# mys1 <- read.csv("https://raw.githubusercontent.com/MoH-Malaysia/covid19-public/main/epidemic/cases_malaysia.csv")
# mysstates <- read_csv("https://raw.githubusercontent.com/MoH-Malaysia/covid19-public/main/epidemic/cases_state.csv")
# mysclusters <- read.csv("https://raw.githubusercontent.com/MoH-Malaysia/covid19-public/main/epidemic/clusters.csv")
# mystests <- read.csv("https://raw.githubusercontent.com/MoH-Malaysia/covid19-public/main/epidemic/tests_malaysia.csv")
# mysdeaths <- read.csv("https://raw.githubusercontent.com/MoH-Malaysia/covid19-public/main/epidemic/deaths_state.csv")
# popn <- read.csv("https://raw.githubusercontent.com/MoH-Malaysia/covid19-public/main/static/population.csv")
# vacn <- read.csv("https://raw.githubusercontent.com/CITF-Malaysia/citf-public/main/vaccination/vax_state.csv")
# hospital <- read.csv("https://raw.githubusercontent.com/MoH-Malaysia/covid19-public/main/epidemic/hospital.csv")
# icu <- read.csv("https://raw.githubusercontent.com/MoH-Malaysia/covid19-public/main/epidemic/icu.csv")

# saveRDS(mys1, "data/mys1.rds")
# saveRDS(mysstates, "data/mysstates.rds")
# saveRDS(mysclusters, "data/mysclusters.rds")
# saveRDS(mysdeaths, "data/mysdeaths.rds")
# saveRDS(popn, "data/popn.rds")
# saveRDS(vacn, "data/vacn.rds")
# saveRDS(hospital, "data/hospital.rds")
# saveRDS(icu, "data/icu.rds")

mys1 <- readRDS("data/mys1.rds")
mysstates <- readRDS("data/mysstates.rds")
mysclusters <- readRDS("data/mysclusters.rds")
mysdeaths <- readRDS("data/mysdeaths.rds")
popn <- readRDS("data/popn.rds")
vacn <- readRDS("data/vacn.rds")
hospital <- readRDS("data/hospital.rds")
icu <- readRDS("data/icu.rds")
1.5 Basic data manipulation (wrangling) commands
We will show some examples of using the dplyr and tidyr packages with some selected Malaysia Covid datasets that we have downloaded. Earlier we have enabled or activated these packages using the library function. Otherwise, they can be explicitly activated with the package::function notation.
- dplyr::select - select variables/columns (we will mainly use columns in the book)
- dplyr::filter - select observations/rows (we will mainly use rows in the book)
- dplyr::mutate - transform existing columns or create new columns
- dplyr::summarize - summarize data
- dplyr::group_by - identify subgroups for further processing
- tidyr::gather - convert wide format data frame to long format
- tidyr::spread - convert long format data frame to wide format
Many other functions to manipulate data can be found here.9
1.5.1 Data frame structure
The following code displays the column or variable name and type for each data frame we created from the downloaded datasets.
mys1
##                    date               cases_new            cases_import
##             "character"               "integer"               "integer"
##         cases_recovered          cluster_import       cluster_religious
##               "integer"               "integer"               "integer"
##       cluster_community        cluster_highRisk       cluster_education
##               "integer"               "integer"               "integer"
## cluster_detentionCentre       cluster_workplace
##               "integer"               "integer"
mysclusters
##         cluster           state        district  date_announced date_last_onset
##     "character"     "character"     "character"     "character"     "character"
##        category          status       cases_new     cases_total    cases_active
##     "character"     "character"       "integer"       "integer"       "integer"
##           tests             icu          deaths       recovered
##       "integer"       "integer"       "integer"       "integer"
mysstates
##            date           state    cases_import       cases_new cases_recovered
##        "double"     "character"        "double"        "double"        "double"
mysdeaths
##           date          state     deaths_new     deaths_bid deaths_new_dod
##    "character"    "character"      "integer"      "integer"      "integer"
## deaths_bid_dod    deaths_pvax    deaths_fvax     deaths_tat
##      "integer"      "integer"      "integer"      "integer"
popn
##       state        idxs         pop      pop_18      pop_60
## "character"   "integer"   "integer"   "integer"   "integer"
vacn
##                date               state       daily_partial          daily_full
##         "character"         "character"           "integer"           "integer"
##               daily daily_partial_child    daily_full_child       cumul_partial
##           "integer"           "integer"           "integer"           "integer"
##          cumul_full               cumul cumul_partial_child    cumul_full_child
##           "integer"           "integer"           "integer"           "integer"
##             pfizer1             pfizer2            sinovac1            sinovac2
##           "integer"           "integer"           "integer"           "integer"
##              astra1              astra2             cansino             pending
##           "integer"           "integer"           "integer"           "integer"
hospital
##             date            state             beds       beds_covid
##      "character"      "character"        "integer"        "integer"
##     beds_noncrit     admitted_pui   admitted_covid   admitted_total
##        "integer"        "integer"        "integer"        "integer"
##   discharged_pui discharged_covid discharged_total       hosp_covid
##        "integer"        "integer"        "integer"        "integer"
##         hosp_pui    hosp_noncovid
##        "integer"        "integer"
icu
##           date          state       beds_icu   beds_icu_rep beds_icu_total
##    "character"    "character"      "integer"      "integer"      "integer"
## beds_icu_covid           vent      vent_port      icu_covid        icu_pui
##      "integer"      "integer"      "integer"      "integer"      "integer"
##   icu_noncovid     vent_covid       vent_pui  vent_noncovid      vent_used
##      "integer"      "integer"      "integer"      "integer"      "integer"
## vent_port_used
##      "integer"
Notice that not all the date variables are of the same type, some are defined as character and some as double. These were defined by the data providers. We will have to make the necessary adjustments when we use them.
1.5.2 Selecting columns
The select function allows us to limit the data frame to specified variables (columns).
- Select from
mysclustersdata frame the columnscluster,state,district. - Store the results in a new data frame
tmp. We show two similar ways using the->and<-assign operator. We can also use=. - Display the first 10 records or rows using
head. - Display the last 10 records or rows using
tail.
# library(dplyr) (only if it has not been loaded)

select(mysclusters, cluster, state, district) -> tmp
tmp <- select(mysclusters, cluster, state, district)
head(tmp, 10)
## cluster
## 1 Kluster Warga Jepun
## 2 Kluster UDA
## 3 Kluster Keagamaan (Tabligh Sri Petaling)
## 4 Kluster Tabligh New Delhi
## 5 Kluster AIROD
## 6 Kluster PUI Itali
## 7 Subkluster Tabligh Sri Petaling - Kluster Majlis Perkahwinan Bandar Baru Bangi
## 8 Kluster Persidangan Gereja GNF
## 9 Subkluster Tabligh Sri Petaling - Kluster Bandar Baru Ibrahim Majid & kawasan sekitar
## 10 Subkluster Tabligh Sri Petaling - Kluster Menara Plaza City One
## state
## 1 WP Kuala Lumpur
## 2 WP Kuala Lumpur, WP Putrajaya, Selangor, Negeri Sembilan & Johor
## 3 Semua Negeri
## 4 Selangor, Negeri Sembilan, WP Kuala Lumpur & WP Putrajaya
## 5 Pahang
## 6 Sarawak
## 7 WP Kuala Lumpur, WP Putrajaya, Kedah, Selangor, Perak, Kelantan, Terengganu, Johor, Melaka & Negeri Sembilan
## 8 Sarawak
## 9 Johor
## 10 WP Kuala Lumpur
## district
## 1 Lembah Pantai
## 2 Pelbagai
## 3 Pelbagai
## 4 Pelbagai
## 5 Kuantan
## 6 Kuching
## 7 Pelbagai
## 8 Kuching, Samarahan & Serian
## 9 Kluang
## 10 Lembah Pantai## cluster state
## 5468 Kluster Industri Sri Tanjung Johor
## 5469 Kluster Industri Dua Anggerik Mokara 48 Selangor
## 5470 Kluster Dua Jalan Puchong Selangor
## 5471 Kluster Tapak Bina Jalan Kamunting Perak
## 5472 Kluster Jalan Teknologi Dua Gopeng Perak
## 5473 Kluster Kampung Dalam Pupoh Kelantan
## 5474 Kluster Kampung Padang Tok La Hilir Kelantan
## 5475 Kluster Long Pasia Sabah
## 5476 Kluster Kampung Jejawi Alor Pasir Kelantan
## 5477 Kluster Kampung Simpang Tiga Banggol Petaling Kelantan
## district
## 5468 Tangkak, Muar
## 5469 Klang, Petaling, Hulu Langat
## 5470 Petaling
## 5471 Larut, Matang dan Selama
## 5472 Kampar, Kinta
## 5473 Kota Bharu
## 5474 Pasir Mas
## 5475 Sipitang
## 5476 Pasir Mas
## 5477 Pasir Mas1.5.3 Using pipes
dplyr and tidyr allow us to write our code in a compact format using the pipe %>% operator. It also shows the flow of the operations.
Let us redo the above using %>%. We also show how to sort of unselect columns from a data frame.
##                                                                                  cluster
## 1                                                                    Kluster Warga Jepun
## 2                                                                            Kluster UDA
## 3                                               Kluster Keagamaan (Tabligh Sri Petaling)
## 4                                                              Kluster Tabligh New Delhi
## 5                                                                          Kluster AIROD
## 6                                                                      Kluster PUI Itali
## 7         Subkluster Tabligh Sri Petaling - Kluster Majlis Perkahwinan Bandar Baru Bangi
## 8                                                         Kluster Persidangan Gereja GNF
## 9  Subkluster Tabligh Sri Petaling - Kluster Bandar Baru Ibrahim Majid & kawasan sekitar
## 10                       Subkluster Tabligh Sri Petaling - Kluster Menara Plaza City One
##                                                                                                           state
## 1                                                                                               WP Kuala Lumpur
## 2                                              WP Kuala Lumpur, WP Putrajaya, Selangor, Negeri Sembilan & Johor
## 3                                                                                                  Semua Negeri
## 4                                                     Selangor, Negeri Sembilan, WP Kuala Lumpur & WP Putrajaya
## 5                                                                                                        Pahang
## 6                                                                                                       Sarawak
## 7  WP Kuala Lumpur, WP Putrajaya, Kedah, Selangor, Perak, Kelantan, Terengganu, Johor, Melaka & Negeri Sembilan
## 8                                                                                                       Sarawak
## 9                                                                                                         Johor
## 10                                                                                              WP Kuala Lumpur
##                       district
## 1                Lembah Pantai
## 2                     Pelbagai
## 3                     Pelbagai
## 4                     Pelbagai
## 5                      Kuantan
## 6                      Kuching
## 7                     Pelbagai
## 8  Kuching, Samarahan & Serian
## 9                       Kluang
## 10 Lembah Pantai## date_announced date_last_onset category status cases_new cases_total
## 5468 2021-09-30 2021-09-29 workplace active 9 10
## 5469 2021-09-30 2021-09-29 workplace active 37 44
## 5470 2021-09-30 2021-09-29 workplace active 1 79
## 5471 2021-09-30 2021-09-29 workplace active 20 20
## 5472 2021-09-30 2021-09-29 workplace active 19 36
## 5473 2021-09-30 2021-09-29 community active 4 10
## 5474 2021-09-30 2021-09-29 community active 3 13
## 5475 2021-09-30 2021-09-29 community active 10 25
## 5476 2021-09-30 2021-09-29 community active 10 11
## 5477 2021-09-30 2021-09-29 community active 2 8
## cases_active tests icu deaths recovered
## 5468 10 21 0 0 0
## 5469 44 113 0 0 0
## 5470 79 318 0 0 0
## 5471 20 116 0 0 0
## 5472 36 155 0 0 0
## 5473 10 15 0 0 0
## 5474 13 16 0 0 0
## 5475 25 25 0 0 0
## 5476 11 11 0 0 0
## 5477 8 10 0 0 0The %>% operator passes the result on the left to the first parameter of the function on the right. We no longer need to create a temporary data frame like tmp to store the results. Note that mysclusters remain unchanged.
There are 14 columns in mysclusters. We selected 3 in the first line of the code chunk above and the remaining 11 in the second line.
1.5.4 Filtering rows
The filter function allows us to limit our data frame to rows(observations, records) that meet specific criteria. Multiple criteria can be combined with the & (AND) and | (OR) operators.
- Filter records for Sarawak
##                                                 cluster   state
## 1                                     Kluster PUI Itali Sarawak
## 2                        Kluster Persidangan Gereja GNF Sarawak
## 3                         Kluster Hospital Umum Sarawak Sarawak
## 4  Subkluster Tabligh Sri Petaling - Kluster di Kuching Sarawak
## 5                       Kluster Tapak Pembinaan Kuching Sarawak
## 6                                      Kluster Kidurong Sarawak
## 7                    Kluster Syarikat Pembinaan Kuching Sarawak
## 8                          Kluster Kejuruteraan Kuching Sarawak
## 9                                       Kluster Mambong Sarawak
## 10                                      Kluster Jupiter Sarawak
##                         district date_announced date_last_onset  category
## 1                        Kuching     2020-04-05      2020-03-20    import
## 2    Kuching, Samarahan & Serian     2020-04-06      2020-03-15 religious
## 3                        Kuching     2020-04-17      2020-03-31  highRisk
## 4  Kuching, Samarahan & Simunjan     2020-05-04      2020-03-18 religious
## 5                        Kuching     2020-06-18      2020-06-17 workplace
## 6                        Bintulu     2020-06-19      2020-06-13 community
## 7                        Kuching     2020-06-24      2020-07-12 workplace
## 8                        Kuching     2020-07-12      2020-07-12 workplace
## 9            Kuching & Samarahan     2020-07-16      2020-07-15 workplace
## 10                       Bintulu     2020-07-17      2020-07-13    import
##    status cases_new cases_total cases_active tests icu deaths recovered
## 1   ended         0          65            0   629   0      5        60
## 2   ended         0         191            0  6991   0      3       188
## 3   ended         0          68            0  4849   0      0        68
## 4   ended         0          41            0  1034   0      2        39
## 5   ended         0           3            0   315   0      0         3
## 6   ended         0           8            0   200   0      0         8
## 7   ended         0           2            0    91   0      0         2
## 8   ended         0           8            0   189   0      0         8
## 9   ended         0           7            0   293   0      0         7
## 10 ended 0 3 0 35 0 0 3- Filter records for Sarawak, Sabah, Selangor
##                                                         cluster    state
## 1                                             Kluster PUI Itali  Sarawak
## 2                                Kluster Persidangan Gereja GNF  Sarawak
## 3  Subkluster Tabligh Sri Petaling - Kluster Kampung Sungai Lui Selangor
## 4                                            Kluster Warga Emas Selangor
## 5                                              Kluster Pakistan    Sabah
## 6                                 Kluster Hospital Sungai Buloh Selangor
## 7                                 Kluster Hospital Umum Sarawak  Sarawak
## 8                               Kluster Petugas Kesihatan Sabah    Sabah
## 9                                       Kluster Seksyen 6 Bangi Selangor
## 10                                        Kluster Selayang Baru Selangor
##                                       district date_announced date_last_onset
## 1                                      Kuching     2020-04-05      2020-03-20
## 2                  Kuching, Samarahan & Serian     2020-04-06      2020-03-15
## 3                                  Hulu Langat     2020-04-12      2020-03-16
## 4                             Klang & Petaling     2020-04-16      2020-03-22
## 5                                        Tawau     2020-04-16      2020-04-13
## 6                                       Gombak     2020-04-17      2020-03-23
## 7                                      Kuching     2020-04-17      2020-03-31
## 8  Kota Kinabalu, Penampang, Keningau & Tuaran     2020-04-18      2020-04-03
## 9                                  Hulu Langat     2020-04-21      2020-03-17
## 10                                      Gombak     2020-04-30      2020-04-28
##     category status cases_new cases_total cases_active tests icu deaths
## 1     import  ended         0          65            0   629   0      5
## 2  religious  ended         0         191            0  6991   0      3
## 3  religious  ended         0         211            0  1088   0      0
## 4   highRisk  ended         0          36            0   242   0      5
## 5  community  ended         0           6            0    12   0      0
## 6   highRisk  ended         0          18            0   354   0      0
## 7   highRisk  ended         0          68            0  4849   0      0
## 8   highRisk  ended         0          35            0  1463   0      0
## 9  community  ended         0          31            0   301   0      2
## 10 community  ended         0          52            0  3802   0      0
##    recovered
## 1         60
## 2        188
## 3        211
## 4         31
## 5          6
## 6         18
## 7         68
## 8         35
## 9         29
## 10        52
We can achieve the same outcome by using the %in% operator where c('Sarawak', 'Sabah', 'Selangor') is the vector of matching observations.
##                                                         cluster    state
## 1                                             Kluster PUI Itali  Sarawak
## 2                                Kluster Persidangan Gereja GNF  Sarawak
## 3  Subkluster Tabligh Sri Petaling - Kluster Kampung Sungai Lui Selangor
## 4                                            Kluster Warga Emas Selangor
## 5                                              Kluster Pakistan    Sabah
## 6                                 Kluster Hospital Sungai Buloh Selangor
## 7                                 Kluster Hospital Umum Sarawak  Sarawak
## 8                               Kluster Petugas Kesihatan Sabah    Sabah
## 9                                       Kluster Seksyen 6 Bangi Selangor
## 10                                        Kluster Selayang Baru Selangor
##                                       district date_announced date_last_onset
## 1                                      Kuching     2020-04-05      2020-03-20
## 2                  Kuching, Samarahan & Serian     2020-04-06      2020-03-15
## 3                                  Hulu Langat     2020-04-12      2020-03-16
## 4                             Klang & Petaling     2020-04-16      2020-03-22
## 5                                        Tawau     2020-04-16      2020-04-13
## 6                                       Gombak     2020-04-17      2020-03-23
## 7                                      Kuching     2020-04-17      2020-03-31
## 8  Kota Kinabalu, Penampang, Keningau & Tuaran     2020-04-18      2020-04-03
## 9                                  Hulu Langat     2020-04-21      2020-03-17
## 10                                      Gombak     2020-04-30      2020-04-28
##     category status cases_new cases_total cases_active tests icu deaths
## 1     import  ended         0          65            0   629   0      5
## 2  religious  ended         0         191            0  6991   0      3
## 3  religious  ended         0         211            0  1088   0      0
## 4   highRisk  ended         0          36            0   242   0      5
## 5  community  ended         0           6            0    12   0      0
## 6   highRisk  ended         0          18            0   354   0      0
## 7   highRisk  ended         0          68            0  4849   0      0
## 8   highRisk  ended         0          35            0  1463   0      0
## 9  community  ended         0          31            0   301   0      2
## 10 community  ended         0          52            0  3802   0      0
##    recovered
## 1         60
## 2        188
## 3        211
## 4         31
## 5          6
## 6         18
## 7         68
## 8         35
## 9         29
## 10        52
1.5.5 Creating/Changing columns
The mutate function allows us to create new columns or change existing ones.
In the following code, we combine mutate, select, and filter to know the percentage of icu beds occupied in Kelantan. Note carefully that the icu data frame is not changed in any way.
 icu %>%
  mutate(icucovidbedoccupied = (icu_covid/beds_icu_covid)*100,
         icubedoccupied = ((icu_covid+icu_noncovid)/beds_icu_total)*100) %>%
  select(date, state, icucovidbedoccupied, icubedoccupied) %>%
  filter(state == "Kelantan") %>%
  head(10)
## date state icucovidbedoccupied icubedoccupied
## 1 2020-03-24 Kelantan 5 53.84615
## 2 2020-03-25 Kelantan 15 79.54545
## 3 2020-03-26 Kelantan 20 61.36364
## 4 2020-03-27 Kelantan 25 75.00000
## 5 2020-03-28 Kelantan 20 72.72727
## 6 2020-03-29 Kelantan 24 68.18182
## 7 2020-03-30 Kelantan 20 70.45455
## 8 2020-03-31 Kelantan 16 77.27273
## 9 2020-04-01 Kelantan 20 68.18182
## 10 2020-04-02 Kelantan 16 75.000001.5.6 Summarizing data
The summarize function can be used to reduce multiple values down to a single value (like the sum). It is often used together with the by_group function, to calculate statistics by group. In the code below, the na.rm=TRUE option is used to drop missing values before calculating.
We calculate the mean, median, minimum, and maximum daily new Covid cases for each state. We save the results in a new data frame new_cases_summary'. Again,mysstates` remain unchanged.
mysstates %>%
  group_by(state) %>%
  summarize(mean = mean(cases_new, na.rm=TRUE),
            median = median(cases_new, na.rm=TRUE),
            min = min(cases_new, na.rm=TRUE),
            max = max(cases_new, na.rm=TRUE)) -> new_cases_summary
new_cases_summary
## # A tibble: 16 x 5
## state mean median min max
## <chr> <dbl> <dbl> <dbl> <dbl>
## 1 Johor 320. 44.5 0 2785
## 2 Kedah 220. 16 0 2455
## 3 Kelantan 189. 6.5 0 1573
## 4 Melaka 95.3 5 0 1120
## 5 Negeri Sembilan 158. 33 0 1619
## 6 Pahang 106. 6 0 926
## 7 Perak 168. 24 0 1596
## 8 Perlis 6.45 0 0 113
## 9 Pulau Pinang 213. 35 0 2474
## 10 Sabah 323. 98.5 0 3487
## 11 Sarawak 344. 9.5 0 5291
## 12 Selangor 1103. 261 0 8792
## 13 Terengganu 91.5 3 0 993
## 14 W.P. Kuala Lumpur 303. 68 0 2880
## 15 W.P. Labuan 16.2 1 0 253
## 16 W.P. Putrajaya 10.0 2 0 122The minimum number of new cases is 0 for all states because the mysstates data frame starts at 2020-01-25 when all states had 0 new cases. We all know that the Sabah state elections and the social distancing, as well as the quarantine SOP non-compliance, was the main trigger that led to the jump in the number of cases after we had almost “flattened the curve”. Let us summarize the results starting 01 October 2020 without saving the results.
We use the arrange function with desc to sort the output starting with the highest mean new cases.
mysstates %>%
  filter(date >= as.Date('2020-10-01')) %>%
  group_by(state) %>%
  summarize(mean = mean(cases_new, na.rm=TRUE),
            median = median(cases_new, na.rm=TRUE),
            min = min(cases_new, na.rm=TRUE),
            max = max(cases_new, na.rm=TRUE)) %>%
  arrange(desc(mean))
## # A tibble: 16 x 5
## state mean median min max
## <chr> <dbl> <dbl> <dbl> <dbl>
## 1 Selangor 1850. 1082. 13 8792
## 2 Sarawak 577. 268. 0 5291
## 3 Sabah 538. 275 29 3487
## 4 Johor 536. 329 0 2785
## 5 W.P. Kuala Lumpur 502. 317 1 2880
## 6 Kedah 369. 96.5 0 2455
## 7 Pulau Pinang 357. 144. 0 2474
## 8 Kelantan 317. 97 0 1573
## 9 Perak 281. 99.5 0 1596
## 10 Negeri Sembilan 263. 124. 0 1619
## 11 Pahang 178. 47 0 926
## 12 Melaka 160. 63 0 1120
## 13 Terengganu 154. 33.5 0 993
## 14 W.P. Labuan 27.1 6 0 253
## 15 W.P. Putrajaya 16.6 8 0 122
## 16 Perlis 10.8 1 0 1131.5.7 Reshaping data
Some graphs require the data to be in wide format, while some graphs require the data to be in long format.
We can convert a wide data frame to a long data frame using gather. Welcome to our first picture of a selected Malaysia Covid data frame. We deliberately label the R code Chp1-3 and add other parameters to control and identify the plot.
mys1 %>%
  gather("cluster", "value", -date) %>%
  ggplot(aes(x=as.Date(date),
                 y=value,
                 color=cluster,
                 shape=cluster)) +
  geom_point() +
  scale_shape_manual(values=c(0,1,2,3,4,5,6,7,8,9,10,11,12,13,14,15)) +
  labs(title = "Daily New Cases by Cluster",
      subtitle = "Color by clusters")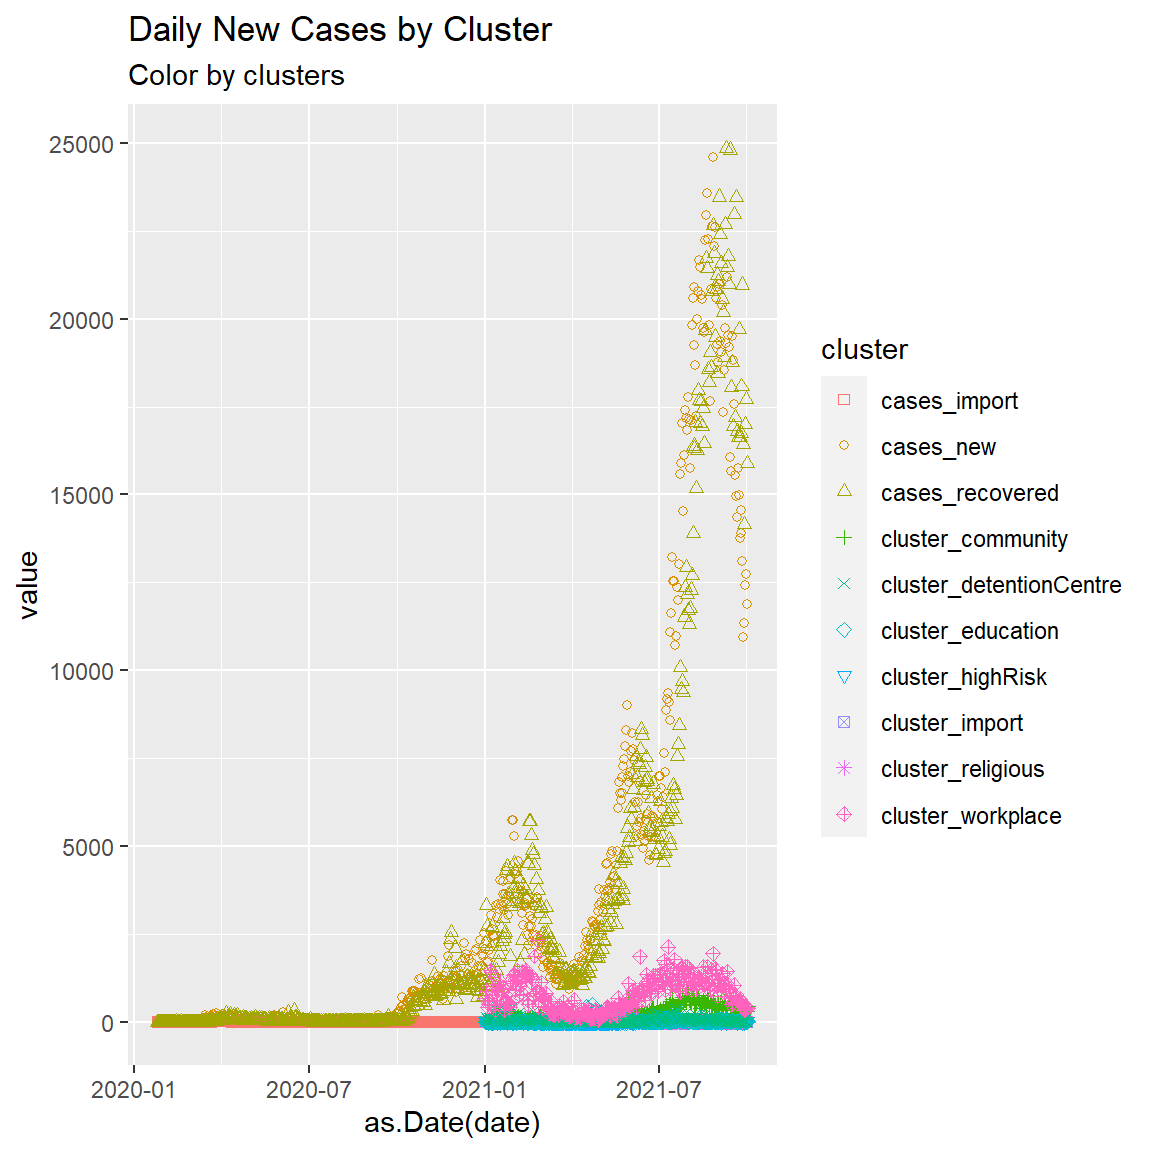
Figure 1.3: Point plot of Malaysia case data
We will explain the steps to create the plot using the ggplot functions later. The above code again does not change mys1 data frame but converts it to a long format to facilitate drawing Figure 1.3.
We can convert a long data frame to a wide data frame using
tidyr::wide_data <- spread(long_data, variable, value).
1.5.8 Missing data
Actual data are likely to contain missing values. There are three basic approaches to dealing with missing data: feature selection, listwise deletion, and imputation. Let’s see how each applies to the mys1 data frame.
1.5.8.1 Feature selection
In feature selection, we delete columns that contain too many missing values.
What is the proportion of missing data for each column?
##                    date               cases_new            cases_import
##                    0.00                    0.00                    0.00
##         cases_recovered          cluster_import       cluster_religious
##                    0.00                    0.56                    0.56
##       cluster_community        cluster_highRisk       cluster_education
##                    0.56                    0.56                    0.56
## cluster_detentionCentre       cluster_workplace
##                    0.56                    0.56
61 percent of the [cluster_import, cluster_religious, cluster_community, cluster_highRisk, cluster_education, cluster_detentionCentre, cluster_workplace] values are missing. This is probably due to these data being collected later on.
1.5.8.2 Listwise deletion
Listwise deletion involves deleting rows that contain missing values on any of the columns of interest.
Create a data frame without any rows containing missing data.
##                    date               cases_new            cases_import
##                       0                       0                       0
##         cases_recovered          cluster_import       cluster_religious
##                       0                       0                       0
##       cluster_community        cluster_highRisk       cluster_education
##                       0                       0                       0
## cluster_detentionCentre       cluster_workplace
##                       0                       0
1.5.8.3 Imputation
Imputation involves replacing missing values with “reasonable” guesses about what the values would have been if they had not been missing. There are several approaches.10
1.6 Discussion
We have introduced the basic tools and functions to transform the data frames we have created to take advantage of the features and functions of our visualization package ggplot2. As we prepare to plot the various types of graphs, we will show how to manipulate or transform the relevant data frame(s).