Chapter 29 Review + Fun data sets if you need them
29.1 Review
You should be pretty comfortable with the ideas of
- Parameters vs Estimates
- Sampling and what can go wrong
- Null hypothesis significance testing
- Common test statistics
- F
- t
- F
- Calculating Sums of Squares
- Interpreting stats output like that below
ToothGrowth <- mutate(ToothGrowth, dose = factor(dose))
tooth_lm <- lm(len ~ supp * dose, data = ToothGrowth)


summary(tooth_lm)
##
## Call:
## lm(formula = len ~ supp * dose, data = ToothGrowth)
##
## Residuals:
## Min 1Q Median 3Q Max
## -8.20 -2.72 -0.27 2.65 8.27
##
## Coefficients:
## Estimate Std. Error t value Pr(>|t|)
## (Intercept) 13.230 1.148 11.521 3.60e-16 ***
## suppVC -5.250 1.624 -3.233 0.00209 **
## dose1 9.470 1.624 5.831 3.18e-07 ***
## dose2 12.830 1.624 7.900 1.43e-10 ***
## suppVC:dose1 -0.680 2.297 -0.296 0.76831
## suppVC:dose2 5.330 2.297 2.321 0.02411 *
## ---
## Signif. codes: 0 '***' 0.001 '**' 0.01 '*' 0.05 '.' 0.1 ' ' 1
##
## Residual standard error: 3.631 on 54 degrees of freedom
## Multiple R-squared: 0.7937, Adjusted R-squared: 0.7746
## F-statistic: 41.56 on 5 and 54 DF, p-value: < 2.2e-16anova(tooth_lm)## Analysis of Variance Table
##
## Response: len
## Df Sum Sq Mean Sq F value Pr(>F)
## supp 1 205.35 205.35 15.572 0.0002312 ***
## dose 2 2426.43 1213.22 92.000 < 2.2e-16 ***
## supp:dose 2 108.32 54.16 4.107 0.0218603 *
## Residuals 54 712.11 13.19
## ---
## Signif. codes: 0 '***' 0.001 '**' 0.01 '*' 0.05 '.' 0.1 ' ' 1Anova(tooth_lm, type = "II") ## Anova Table (Type II tests)
##
## Response: len
## Sum Sq Df F value Pr(>F)
## supp 205.35 1 15.572 0.0002312 ***
## dose 2426.43 2 92.000 < 2.2e-16 ***
## supp:dose 108.32 2 4.107 0.0218603 *
## Residuals 712.11 54
## ---
## Signif. codes: 0 '***' 0.001 '**' 0.01 '*' 0.05 '.' 0.1 ' ' 129.2 Quiz
Reflection questions on [canvas] ## Potential data sets
Spend the weekend pushing forward on your linear model project.
Recall that a major assumption of linear models is that errors are normally distributed.
Although linear models are robust to minor violations of these assumptions, they are not a good choice for a categorical response variable – so if your early analyses had categorical response variables you probably need a new data set. Here are some currated options.
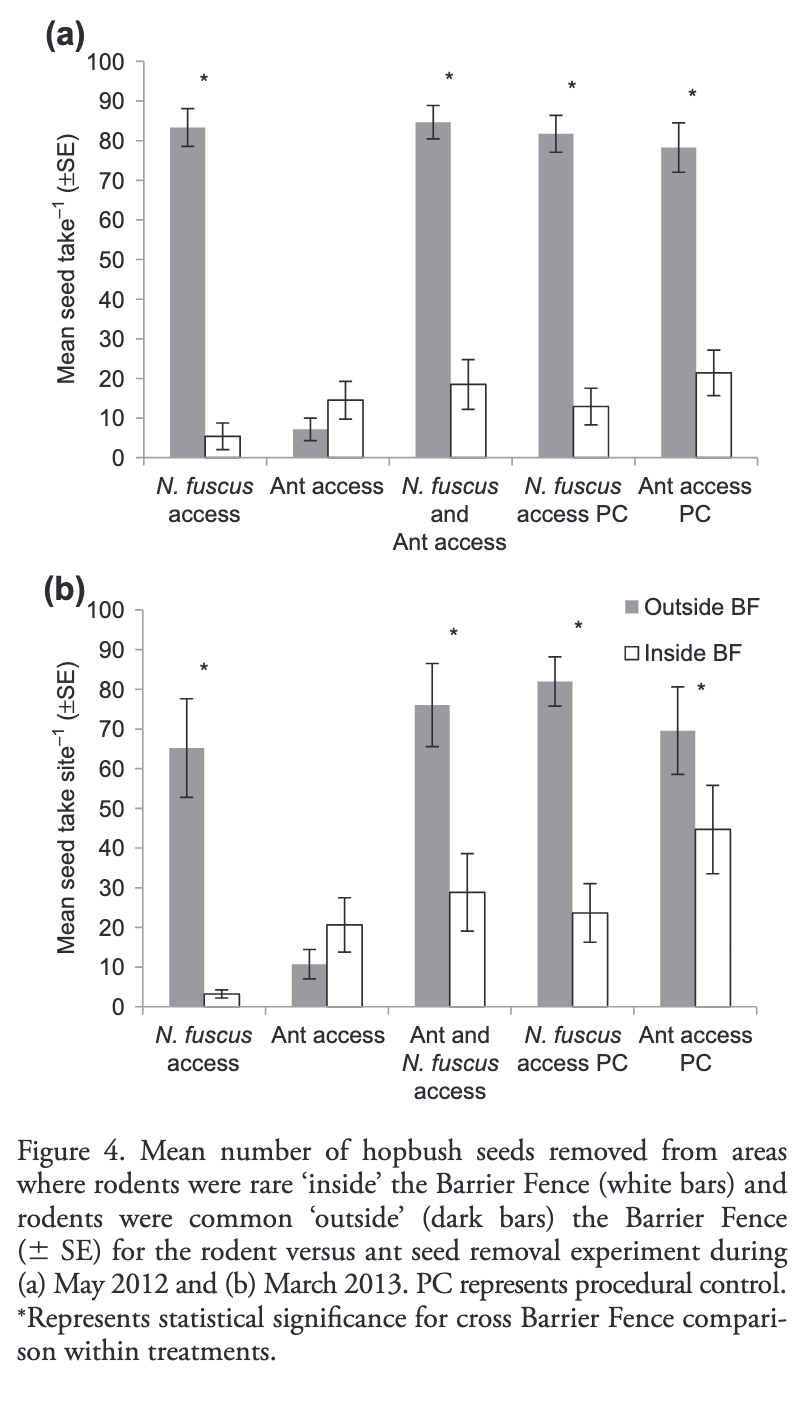
Consequences of extinction
Functional extinction of a desert rodent: implications for seed fate and vegetation dynamics. Gordon and Letnic (2016) . data for project (.xlsx format), paper, full data on dryad.
Image from paper [dont try to recreate this]
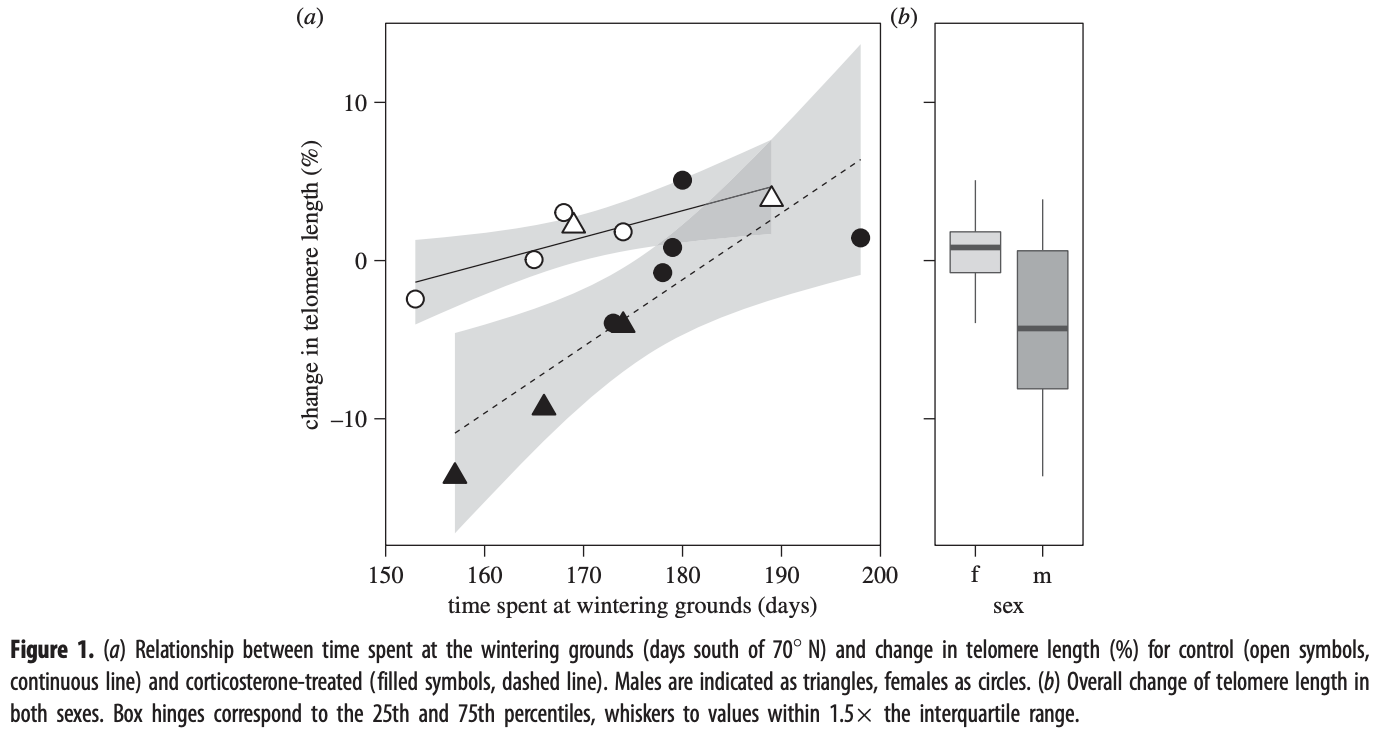
Moving and other stresses might shorten telomeres
Migration and stress during reproduction govern telomere dynamics in a seabird. Schultner et al. (2014). data for project (.xlsx format), paper.
Associations between neurons and IQ
Large and fast human pyramidal neurons associate with intelligence. Goriounova et al. (2018). data for project (.xlsx format), paper, dryad.
Inbreeding and fitness
A high-quality pedigree and genetic markers both reveal inbreeding depression for quality but not survival in a cooperative mammal. Wells et al. (2018). data for project annual reproduction (.csv format), yearling weight (.csv format). paper, dryad.